Executive Overview
The automotive landscape is undergoing a quiet yet profound structural transformation. According to the latest market intelligence data released by Kelley Blue Book (KBB) for February, the pricing chasm separating electric vehicles (EVs) from traditional internal combustion engine (ICE) vehicles has narrowed to one of the slimmest margins on record. With the average transaction price (ATP) for a new EV dropping to $55,300—a modest 1.4% decline year-over-year and a 0.6% dip from January—the price premium for embracing electrification has shrunk to approximately $6,500.
This convergence is not merely the result of natural market maturation; it is being aggressively forced by automakers and dealerships leaning heavily into historic levels of consumer incentives. As gas-powered vehicle prices creep upward, manufacturers of electric mobility solutions are utilizing steep discounts, cash-back offers, and subsidized financing to keep inventory moving off showroom floors.
However, this dynamic plays out against a backdrop of complex market contradictions. While the broader industry slashes prices and ramps up incentives to stimulate demand, market leader Tesla has charted a distinct, almost defiant, course. In February, Tesla’s average transaction prices bucked the downward industry trend, climbing 3% year-over-year to $53,821. Yet, this pricing strategy came at a tangible cost: KBB estimates place Tesla’s February sales volume at roughly 38,500 units—a notable 8.9% decline compared to the same period last year, marking the company’s lowest monthly sales figure since late 2021.
This comprehensive report delves into the intricate mechanics of February’s automotive data, analyzing the shrinking price gap, the aggressive incentive strategies deployed by legacy and startup automakers alike, Tesla’s strategic divergence, and what these shifting paradigms mean for the future of sustainable transportation.
Detailed Chronology: How February’s Automotive Market Unfolded
To understand the current state of the American automotive market, one must trace the timeline of pricing pressures and consumer adoption hurdles that have defined the late-winter sales cycle.
The Build-Up: January’s Precursor
The trajectory of early 2026 automotive pricing was heavily foreshadowed in January, a month characterized by aggressive maneuvers from market leaders attempting to jumpstart sluggish post-holiday sales. Early-year inventory accumulation left lots brimming with unsold units, prompting automakers to reevaluate their pricing architecture. While legacy manufacturers began quietly expanding their promotional budgets, Tesla initiated price adjustments that signaled a volatile start to the quarter. Analysts noted that consumers, hyper-aware of fluctuating interest rates and looming macroeconomic uncertainties, remained hesitant, creating a standoff between buyers waiting for better deals and dealerships burdened by high holding costs.
February: The Acceleration of Price Compression
As the calendar turned to February, the strategies tested in the previous month crystallized into industry-wide execution. The month was defined by two opposing yet intersecting vectors:
- The Inflation of ICE Prices: Traditional gas-powered vehicles continued a steady upward drift in average transaction prices. Driven by a mix of consumer preference for feature-rich, larger SUVs and trucks, alongside raw material and labor cost adjustments, ICE vehicles became incrementally more expensive to acquire.
- The Deflation of EV Tags: Conversely, battery-electric vehicles experienced downward pricing pressure. Driven by the need to maintain production velocity and comply with evolving corporate average fuel economy (CAFE) standards, automakers accepted compressed margins on EVs.
The culmination of these trends in mid-to-late February produced the milestone KBB metrics: an average EV transaction price of $55,300 and a historic narrowing of the price premium to $6,500. For the average American household shopping for a new vehicle, the financial penalty for choosing a battery-electric alternative over a fossil-fuel vehicle is lower today than at almost any point in modern automotive history.
Supporting Context & Metrics: Dissecting the Numbers
Behind the headline figures lies a complex web of financial data, inventory analytics, and consumer behavior metrics that paint a detailed picture of the contemporary EV market.
The Incentive Surge: A Double-Edged Sword
The primary catalyst driving the compression of the EV price gap is the unprecedented deployment of manufacturer and dealer incentives. According to Kelley Blue Book data, the average EV incentive package skyrocketed in February, rising to 14.2% of the vehicle’s total transaction price, up significantly from 12.4% just a month prior.
To put this in perspective, EV incentives are currently more than double the average incentive packages offered across the overall automotive market. While this aggressive discounting strategy is successfully lowering the barrier to entry for budget-conscious consumers, it raises critical questions regarding the long-term financial health of OEM electric divisions. Sustaining 14% to 15% incentive levels requires deep corporate pockets, potentially pressuring profitability for automakers who are still scaling their manufacturing footprints.
+------------------------------------------------------------------------+
|                      February Automotive Metrics                       |
+------------------------------+-----------------------------------------+
| Metric                       | Value                                   |
+------------------------------+-----------------------------------------+
| Average EV Transaction Price | $55,300 (-1.4% YoY, -0.6% MoM)          |
| EV-to-ICE Price Gap          | ~$6,500 (Near historic lows)            |
| Average EV Incentive Level   | 14.2% of transaction price              |
| Tesla ATP                    | $53,821 (+3% YoY)                       |
| Estimated Tesla US Sales     | ~38,500 units (-8.9% YoY)               |
| Broader EV Segment Sales     | Down ~26% YoY                           |
+------------------------------+-----------------------------------------+
Tesla’s Pricing Paradox and Volume Contraction
Tesla’s market positioning remains a fascinating study in contrast. Despite the broader industry trend of discounting and incentivizing to move metal, Tesla’s average transaction price actually ticked upward to $53,821 in February, representing a 3% increase year-over-year.

This pricing resilience, however, came with a heavy volume penalty. Estimated sales of 38,500 units represented an 8.9% decline compared to February of the previous year. More critically, industry analysts point out that this is Tesla’s weakest monthly sales performance in the United States since late 2021.
Yet, context is essential. While an 8.9% drop sounds severe, it looks remarkably stable when compared to the broader EV segment, which suffered an estimated 26% year-over-year sales decline in February. Tesla’s brand equity, Supercharger network advantage, and streamlined product lineup continue to insulate it from the worst of the broader market downturn, even as it navigates a challenging demand plateau.
Official Statements and Industry Analysis
Industry experts and market analysts have been quick to weigh in on the implications of the February data, offering a range of perspectives on where the market is heading.
Automotive economists note that the narrowing price gap to $6,500 crosses a psychological threshold for many mainstream buyers. "For years, the conversation around electric vehicles has centered on the prohibitive upfront cost," noted one senior automotive market analyst. "When you talk about a $10,000 to $15,000 premium, the fuel savings take too long to materialize for the average consumer. Bringing that gap down to $6,500—and supplementing it with aggressive 14% incentive packages—fundamentally changes the Total Cost of Ownership (TCO) equation in favor of EVs much earlier in the ownership lifecycle."
Conversely, legacy manufacturing executives have expressed cautious sentiment regarding the depth of incentives required to maintain sales velocity. Speaking anonymously due to corporate reporting policies, one senior executive at a major traditional OEM remarked: "We are seeing healthy consumer interest whenever price points align with expectations, but the market is undeniably fragile. Pushing incentives north of 14% is a tactical necessity to clear lots, but it is not a permanent operational strategy. The ultimate goal remains structural cost reduction in battery chemistry and platform engineering."
Financial analysts tracking Tesla’s divergence point out that CEO Elon Musk’s focus on long-term technological integration—such as autonomous driving software developments and next-generation vehicle architectures—may be taking precedence over short-term volume chasing in the domestic market. However, investors will undoubtedly scrutinize whether rising average transaction prices can be sustained without sacrificing further market share to an increasingly aggressive array of competitors from both traditional Detroit automakers and foreign entrants.

Future Outlook: Navigating the Road Ahead
As the automotive industry transitions from the end of the first quarter into the remainder of the year, several critical trends and variables will dictate the trajectory of electric vehicle pricing and adoption.
1. Supply Chain and Battery Cost Reductions
The ultimate key to permanently closing the remaining $6,500 price gap without relying on unsustainable 14% incentive packages lies in the upstream supply chain. Continued advancements in lithium-iron-phosphate (LFP) chemistry, localized battery cell manufacturing under the umbrella of federal policy incentives, and structural pack designs (such as cell-to-chassis architectures) are projected to drive raw production costs down further. As these manufacturing efficiencies take root, automakers will gain the operational headroom to permanently lower MSRPs rather than relying purely on temporary dealer incentives.
2. The Evolution of Consumer Financing
Interest rate environments will continue to cast a long shadow over automotive retail. With borrowing costs remaining elevated compared to historical post-pandemic lows, monthly payment affordability reigns supreme. Automakers that can offer proprietary, subsidized financing programs—effectively bypassing traditional institutional auto loans—will likely capture disproportionate market share. Expect to see an increase in creative leasing structures designed to capture federal tax credits directly at the point of sale, bypassing income caps and vehicle-origin restrictions that have historically complicated consumer purchasing decisions.
3. Broadening Model Availability
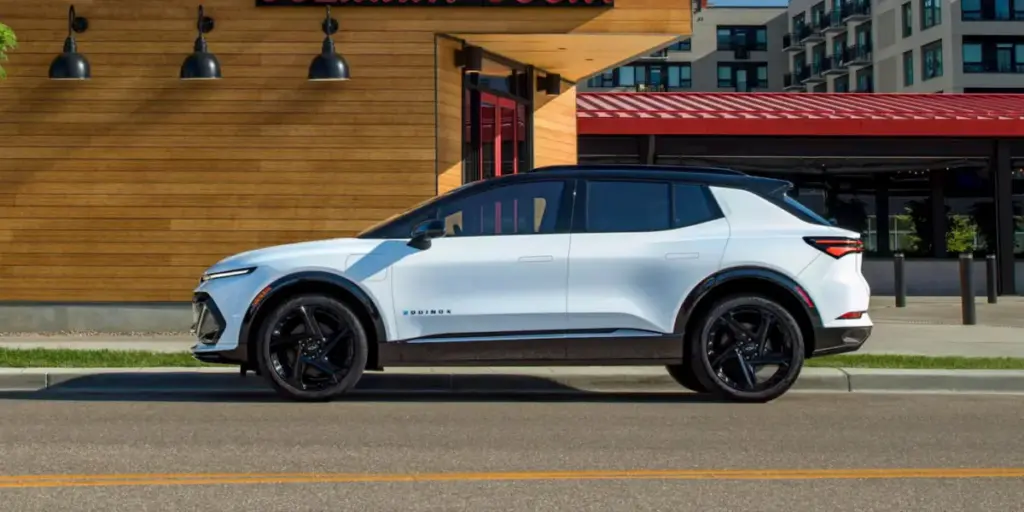
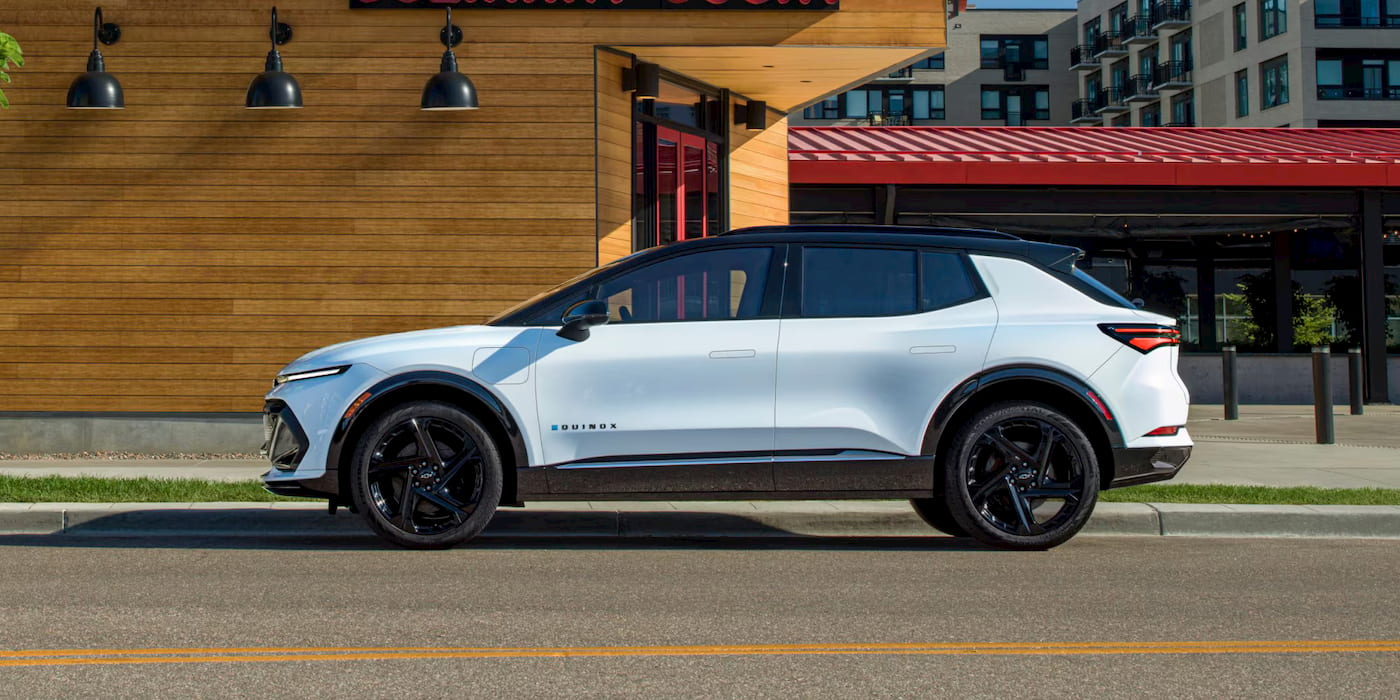
The competitive set for EVs is expanding rapidly into segments that resonate most with American consumers: three-row family SUVs, affordable compact crossovers (exemplified by vehicles like the Chevrolet Equinox EV), and electric pickup trucks. As legacy automakers ramp up production on dedicated EV platforms rather than modified gas-vehicle architectures, consumer choice will diversify. This influx of variety, paired with a narrowing price gap, suggests that while February experienced a temporary volume contraction across the broader segment, the foundational plumbing for long-term mass adoption is steadily falling into place.
Ultimately, February’s data serves as a clear indicator of a market in transition. The era of the hyper-expensive luxury EV novelty is rapidly giving way to a pragmatic, fiercely competitive marketplace where price parity is no longer a distant theoretical goal, but an active, unfolding reality.