Executive Overview
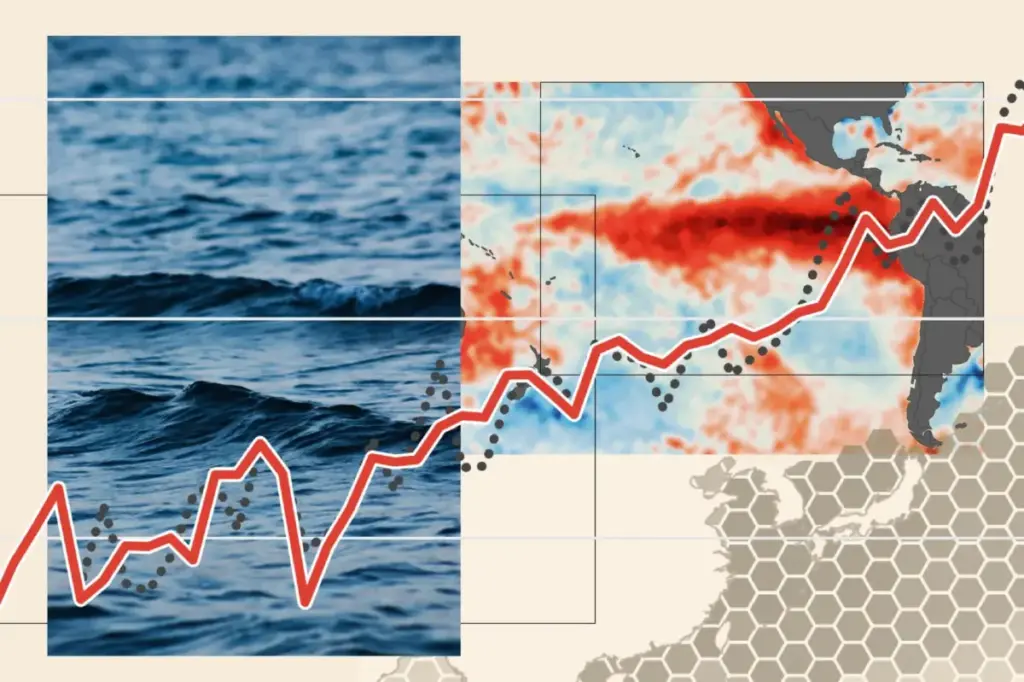
The Earth is entering a critical climate juncture as a rapidly intensifying El Niño event, which took hold in mid-2026, threatens to disrupt global weather patterns through 2027. Climate scientists and forecasting agencies worldwide are closely monitoring the Pacific Ocean, where sea surface temperature anomalies suggest this event could become one of the most powerful on record. Often termed a "super El Niño" in public discourse, the phenomenon reflects an extreme phase of the El Niño-Southern Oscillation (ENSO)—a naturally occurring oceanic-atmospheric feedback loop centered along the equatorial Pacific that acts as the planet’s single largest driver of year-to-year climate variability.
When ENSO transitions from its neutral state into an El Niño phase, the trade winds that normally sweep warm surface waters westward across the Pacific weaken or reverse. This atmospheric relaxation allows a massive pool of heat to slosh eastward toward South America, suppressing the nutrient-rich ocean upwelling that sustains global marine food chains. The resulting redistribution of ocean heat alters atmospheric circulation on a global scale. Tropical storm tracks shift, rainfall patterns invert, and global average surface temperatures receive a temporary but significant upward push.
As climate models project that the 2026–2027 event could surpass peak intensity records established during the catastrophic 2015–2016 El Niño, researchers and policymakers are evaluating both immediate socio-economic threats and long-term climate interactions. From severe droughts and wildfire surges in Southeast Asia and Northern South America to torrents of rain across the southern United States and the Pacific coast of Latin America, the footprint of ENSO touches every continent. Understanding the mechanics, metrics, and history of this climate engine is essential for navigating the hazards of an increasingly volatile global climate system.
Detailed Chronology: From Ancient History to Modern Earth System Science
While modern satellite networks and deep-ocean buoys allow scientists to monitor ENSO in real time, the phenomenon itself is ancient, predating human civilization by hundreds of millennia.
+-----------------------------------------------------------------------------------+
|                            MILESTONES IN ENSO HISTORY                             |
+-----------------------------------------------------------------------------------+
|  ~130,000 BP    | Coral proxy data confirms ENSO-like climate variability.         |
|  1600s          | Peruvian fishers document warm ocean current ("El Niño").         |
|  1926           | Sir Gilbert Walker identifies the atmospheric "Southern           |
|                 | Oscillation" pressure seesaw between Tahiti and Darwin.         |
|  1960s          | Jacob Bjerknes connects ocean temperatures to atmospheric          |
|                 | pressure, forming the unified ENSO model.                         |
|  2026–2027      | Current event develops; 96% of climate models project a record     |
|                 | or near-record "super El Niño."                                   |
+-----------------------------------------------------------------------------------+
Deep Time and Historical Discovery
Paleoclimate investigations using geochemical proxies preserved in ancient corals demonstrate that ENSO-like variability has operated for at least 130,000 years. Analysis of tree rings, ocean sediment cores, and ice sheets indicates that over the past 11,000 years of the Holocene epoch, ENSO has undergone dramatic shifts in frequency and amplitude, demonstrating intrinsic variability across centuries.
Human recognition of the phenomenon began centuries ago along the western coast of South America. By the 1600s, Peruvian fishing communities observed that in certain years, the usually cold, fish-laden coastal waters were replaced by a warm, nutrient-poor southward current. Because this ocean warming typically peaked around December, local mariners named the phenomenon El Niño de Navidad ("The Christ Child"). The warm waters caused dramatic collapses in anchovy harvests, serving as an early indicator of a global climate dynamic.
The Scientific Unification of ENSO
For centuries, El Niño was viewed as a regional marine anomaly localized to the South American coast. The groundwork for a global understanding was laid in 1926 when British physicist Sir Gilbert Walker identified a vast atmospheric pressure "seesaw" operating across the tropical Pacific. Walker discovered that when air pressure rises in the eastern Pacific (measured at Tahiti), it falls in the western Pacific (measured at Darwin, Australia), and vice versa. He named this atmospheric phenomenon the "Southern Oscillation."
It was not until the 1960s that Swedish-born meteorologist Jacob Bjerknes connected Walker’s atmospheric oscillation with the oceanographic warming of El Niño. Bjerknes demonstrated that the atmosphere and the ocean are tightly coupled: changes in sea surface temperatures alter atmospheric pressure gradients, which in turn drive changes in trade winds, reinforcing the initial ocean warming. This unified paradigm became known as the El Niño-Southern Oscillation (ENSO).
Contemporary Timeline: The 2026–2027 Event
In recent decades, major El Niño events in 1997–1998, 2015–2016, and 2023–2024 set new benchmarks for global heat and climate disruption. Following a brief period of neutral conditions, oceanic monitoring systems detected rapid warming across the central and eastern equatorial Pacific in mid-2026. By June 2026, major international meteorological agencies declared the onset of a new El Niño phase, warning that model trajectories pointed toward an extraordinarily powerful event extending well into 2027.
Supporting Context & Metrics: How ENSO Operates and How It Is Measured
To evaluate the progression and severity of an ENSO event, scientists track intricate ocean-atmosphere dynamics and rely on standardized statistical indices.
                       EQUATORIAL PACIFIC OCEAN DYNAMICS

         NEUTRAL CONDITIONS                           EL NIÑO CONDITIONS
    (Strong East-to-West Trade Winds)             (Weakened or Reversed Trade Winds)

 WEST                               EAST     WEST                               EAST
 Asia/Indonesia            S. America     Asia/Indonesia            S. America
     |                          |             |                          |
 [WARM WATER] <== WARM SURFACE =|===       [COOL WATER] === WARM WATER ===> [WARM WATER]
     |              WATER       |             |             SLOSHES EAST         |
     |                          |             |                                  |
 (Heavy Rain)           (Upwelling)       (Drought/Fires)                (Suppressed
                         COLD WATER                                       Upwelling /
                                                                          Heavy Rain)
The Three States of the Pacific Ocean Engine
1. Neutral Conditions
Under neutral conditions, trade winds blow strongly from east to west across the tropical Pacific, driven by Earth’s rotation and the rise of warm air along the equator. These winds drag warm surface water westward, piling it up around Indonesia and northern Australia. Consequently, the sea surface in the western Pacific is roughly 0.5 meters higher and up to 8°C warmer than in the eastern Pacific.
In the east, off the coast of South America, cold, deep ocean water rises to replace the displaced surface water—a process called upwelling. This upwelled water delivers deep-sea nutrients into the sunlit zone, fueling massive phytoplankton blooms that support the Humboldt Current marine ecosystem and make Peru’s anchovy fishery the largest in the world by volume. Rainfall follows the warm water, bringing abundant moisture to Southeast Asia while leaving the western coast of South America arid.
2. El Niño Phase
During El Niño, the atmospheric pressure gradient across the Pacific breaks down, causing trade winds to slacken or even reverse direction. Without strong winds to hold the warm surface water in the west, a massive wave of warm water surges eastward toward South America.
This warm layer caps the cold, nutrient-rich water below, effectively shutting down ocean upwelling along the South American coast. As sea surface temperature contrasts disappear, atmospheric pressure differences weaken further, which slackens the trade winds even more. This self-reinforcing process is known as the Bjerknes positive feedback loop.
            +-------------------------------------------------------+
            |             THE BJERKNES FEEDBACK LOOP                |
            +-------------------------------------------------------+
            |                                                       |
            |  Trade Winds Weaken ---> Warm Water Shifts Eastward   |
            |            ^                             |            |
            |            |                             v            |
            |  Pressure Gradient Drops <--- Ocean Contrast Fades    |
            |                                                       |
            +-------------------------------------------------------+
3. La Niña Phase
Conversely, during a La Niña event, trade winds strengthen beyond normal levels. Warm water is pushed further into the far western Pacific, while upwelling along South America intensifies. Cooler-than-average ocean temperatures stretch across the eastern and central equatorial Pacific, amplifying normal climate patterns: Southeast Asia experiences intensified rainfall and flooding, while coastal South America faces prolonged dry periods.
Monitoring Regions and Quantitative Metrics
To track these shifts, climate scientists divide the equatorial Pacific into operational monitoring zones, focusing primarily on the Niño3.4 region—a 6-million-square-kilometer swath of open ocean straddling the equator in the central Pacific.
       OPERATIONAL PACIFIC MONITORING ZONES
+---------------------------------------------------+
|  Niño 4 (West): 160°E - 150°W                     |
|  Niño 3.4 (Central): 170°W - 120°W  <-- Key Benchmark|
|  Niño 3 (East-Central): 150°W - 90°W              |
|  Niño 1+2 (Far East Coast): 90°W - 80°W           |
+---------------------------------------------------+
The Oceanic Niño Index (ONI)
The primary tool used to measure ENSO intensity is the Oceanic Niño Index (ONI), which tracks three-month running average deviations (anomalies) in Sea Surface Temperatures (SST) within the Niño3.4 region compared to historical baselines:
- El Niño Threshold: Sustained SST anomalies of +0.5°C or higher.
- La Niña Threshold: Sustained SST anomalies of -0.5°C or lower.
- Neutral Phase: Anomalies fluctuating between -0.5°C and +0.5°C.
Methodological Evolution: Relative ONI
As global warming steadily elevates ocean temperatures worldwide, traditional fixed baseline averages risk misinterpreting background baseline climate change as a perpetual El Niño state. To address this baseline drift, major monitoring organizations updated their diagnostic tools. In 2026, the National Oceanic and Atmospheric Administration (NOAA) formally transitioned to using the Relative Oceanic Niño Index (Relative ONI). This metric isolates ENSO-driven temperature changes from broader background tropical warming, offering a clearer picture of actual atmospheric coupling.
Global Socio-Economic and Climatological Impacts
The global impacts of an El Niño event stem from the displacement of tropical convection currents, which alter atmospheric jet streams and reconfigure weather systems across distant latitudes.
                       GLOBAL IMPACTS OF EL NIÑO
+-----------------------+---------------------------------------------------+
| Region                | Primary Observed Impacts                          |
+-----------------------+---------------------------------------------------+
| South America (North) | Drought, elevated wildfire risk (Colombia, Brazil)|
| South America (South) | Heavy rainfall, severe flooding (Argentina, Chile)|
| Southeast Asia        | Monsoonal delay, drought, widespread agricultural risk|
| India                 | Early extreme heat, potential weakening of monsoon|
| Southern Africa       | Warmth, rainfall deficits, drought hazards        |
| North America         | Milder northern winter; wet, stormy southern US   |
| Atlantic Basin        | Reduced hurricane activity (increased wind shear) |
| Pacific Basin         | Longer typhoon tracks; heightened storm intensity |
+-----------------------+---------------------------------------------------+
1. Global Temperatures
El Niño events transfer vast amounts of stored ocean heat into the atmosphere. Mathematically, a 1.0°C warming anomaly in the Niño3.4 region correlates with approximately a 0.1°C increase in global average surface temperature, appearing with a lagged effect of three to six months. Consequently, major El Niño events routinely push global surface temperatures to record highs, as observed in 1998, 2016, 2024, and projected for 2026–2027.
   ERA5 DATASET: RECORD WARM YEARS AND ENSO INFLUENCE

   Year  Event Context          Global Temperature Milestone
  ------ -------------------   ------------------------------
   1998  Major El Niño          Set new global warm record
   2005  Neutral/Minor Warmth   Surpassed 1998 baseline
   2010  Moderate El Niño       Surpassed 2005 baseline
   2016  Super El Niño          Surpassed 2010 baseline
   2023  Developing El Niño     Surpassed 2016 baseline
   2024  Post-El Niño Heat      First calendar year > 1.5°C above pre-industrial
While individual El Niño years create sharp spikes in global temperature charts, long-term climate monitoring shows these spikes sit atop a rising baseline driven by human greenhouse gas emissions.
2. South America and Southeast Asia
- South America: Northern Brazil, Colombia, and Venezuela typically experience lower rainfall, causing reservoir depletion and wildland fires. In contrast, southern Brazil, northern Argentina, and central Chile often experience heavy winter rain and destructive flooding. Oceanically, the collapse of upwelling starves pelagic fish stocks, impacting Peru’s anchovy fleets and triggering domino effects through global fishmeal and agricultural feed markets.
- Southeast Asia & Australia: Indonesia, Malaysia, the Philippines, and eastern Australia face heightened drought conditions. Delayed seasonal rains impair rice production and create ideal conditions for peatland fires, generating regional haze and severe economic losses.
3. Asia and Africa
- Asia: In India, early-year heat waves are frequently followed by a weakened summer monsoon, reducing agricultural output across rain-fed farm sectors. China, Japan, and South Korea often experience unusually mild winter weather.
- Africa: Southern Africa frequently faces dry conditions and crop failures during an El Niño phase, whereas equatorial East Africa (including Kenya and Somalia) often sees heavy rainfall and intense flooding.
4. North American Winter and Tropical Storm Dynamics
- North America: The modified Pacific jet stream directs storm tracks across the southern United States and California, bringing frequent winter rains and mountain snowpack while leaving northern states and central Canada warmer and drier than average.
- Atlantic Hurricanes: El Niño increases vertical wind shear across the Caribbean Sea and tropical Atlantic Ocean. These high-altitude crosswinds tend to disrupt developing tropical depressions, often suppressing the total number of Atlantic hurricanes.
- Pacific Typhoons: In the Pacific Ocean, warm water shifting eastward draws tropical storm formation further out into open ocean waters. Because typhoons generate farther east, they spend more time traveling over warm waters before making landfall. This extended runway allows storms to gather momentum and moisture, increasing the likelihood of high-category typhoons hitting China, Japan, South Korea, and vulnerable Pacific Island nations such as Hawaii, Kiribati, and Tuvalu.
Official Statements, Scientific Consensus, and the 2026–2027 Forecasts
The developing 2026–2027 event has drawn intensive focus from international climate modeling centers due to its unusual growth rate and exceptional strength.
            2026–2027 SUPER EL NIÑO MODEL FORECAST AGREEMENT
+-----------------------------------------------------------------------+
|  Model Runs Predicting Record Peak Anomaly (>2.75°C in Niño3.4): 96%  |
|  Model Runs Predicting Standard Event Intensity:                   4% |
+-----------------------------------------------------------------------+
The 2026–2027 "Super El Niño" Model Consensus
An analysis evaluated by Carbon Brief across 14 international climate modeling groups revealed that 96% of ensemble forecast runs project the 2026–2027 event will set a record high for sea surface temperature anomalies in the Niño3.4 region.
To achieve this benchmark, sea surface temperature anomalies must surpass the +2.75°C anomaly recorded during the peak of the 2015–2016 event. While "super El Niño" is an informal term used by meteorologists rather than an official scientific classification, the sheer scale of predicted ocean warming indicates an extraordinary event.
To declare a formal El Niño event, institutions like NOAA require sea surface temperature anomalies to meet specific criteria: SSTs must exceed the +0.5°C threshold and be projected to persist for at least five consecutive overlapping three-month periods, alongside clear evidence of atmospheric coupling, such as shifted wind patterns and tropical rainfall anomalies.
Climate Change and the Changing Nature of ENSO
The potential arrival of a record-breaking event in 2026 has intensified scientific discussion around how human-caused climate change interacts with natural ocean cycles.
                   SCIENTIFIC PERSPECTIVES ON CLIMATE CHANGE & ENSO
+---------------------------------------------------------------------------------------+
| IPCC AR6 Assessment (2021) | Noted increased El Niño intensity/frequency since 1950    |
|                            | relative to 1400; long-term attribution remains complex  |
|                            | due to multi-century natural variability.              |
+---------------------------------------------------------------------------------------+
| Expert Consensus (NYT Poll) | 50% (8 of 16) surveyed top climate scientists find     |
|                            | compelling evidence that global warming is increasing  |
|                            | El Niño intensity.                                     |
+---------------------------------------------------------------------------------------+
| Future Projections         | Modeling suggests extreme El Niño events could double   |
|                            | in frequency under 1.5°C of global warming.            |
+---------------------------------------------------------------------------------------+
The Intergovernmental Panel on Climate Change (IPCC) Sixth Assessment Report concluded that the overall intensity of El Niño events, along with the frequency of high-magnitude occurrences, has been higher since 1950 than in paleoclimate records dating back to 1400 CE. However, because proxy data shows wide variations in natural ENSO strength over the past 11,000 years, isolating human influence from long-term natural cycles remains challenging.
Despite these baseline challenges, evidence of an interaction continues to grow. In a June 2026 survey conducted by The New York Times involving 16 leading international climate scientists, half (8 of 16) stated that observational data and high-resolution climate modeling now provide compelling evidence that human-caused climate change is intensifying El Niño events. Furthermore, research published in climate modeling studies suggests that extreme El Niño events could double in frequency if global average warming reaches 1.5°C above pre-industrial levels.
Future Outlook
As the 2026–2027 El Niño progresses toward its expected winter peak, global institutions are preparing for widespread agricultural, economic, and humanitarian challenges. The forecast underlines the importance of maintaining robust earth-observation infrastructure, such as the Tropical Atmosphere Ocean (TAO) buoy array, Argo autonomous profiling floats, and satellite altimetry networks.
                          KEY ACTION AREAS FOR ENSO RISK MANAGEMENT
+-------------------------+-------------------------------------------------------------+
| Sector                  | Strategic Response Measure                                  |
+-------------------------+-------------------------------------------------------------+
| Agriculture & Food      | Shift cropping calendars, implement drought-tolerant crops |
| Fisheries               | Manage harvest quotas in anticipation of low upwelling      |
| Water Management        | Secure reservoir reserves; prepare urban flood defenses     |
| Disaster Preparedness   | Pre-position emergency supplies in high-risk strike zones   |
+-------------------------+-------------------------------------------------------------+
Governments and disaster management agencies are using long-range ENSO forecasts to build climate resilience. Agricultural planners in Southeast Asia and Southern Africa are modifying crop calendars and stockpiling drought-resistant seeds, while water resource authorities in Latin America work to balance reservoir supplies between hydroelectric needs and municipal demands.
Ultimately, ENSO demonstrates the deep connections within Earth’s climate system. A shift in equatorial Pacific trade winds triggers a cascade of weather events that impact global food supplies, weather extremes, and economic stability. As background global temperatures continue to rise, managing the impacts of these natural ocean cycles will remain a key priority for global climate adaptation.