Executive Overview
As the international community races against the clock to meet the ambitious global target of protecting at least 30% of the world’s oceans by 2030—a milestone widely known as "30×30"—the challenge has rarely been a lack of passion or local intent. Instead, the persistent bottleneck for marine conservationists, policymakers, and Indigenous stewards has been data fragmentation. For decades, information regarding marine biodiversity, localized conservation victories, Indigenous management areas, and formal government-designated marine protected areas (MPAs) existed in isolated silos. This disconnect made it profoundly difficult to evaluate where conservation efforts were succeeding, where they were failing, and where critical gaps remained vulnerable to industrial exploitation.
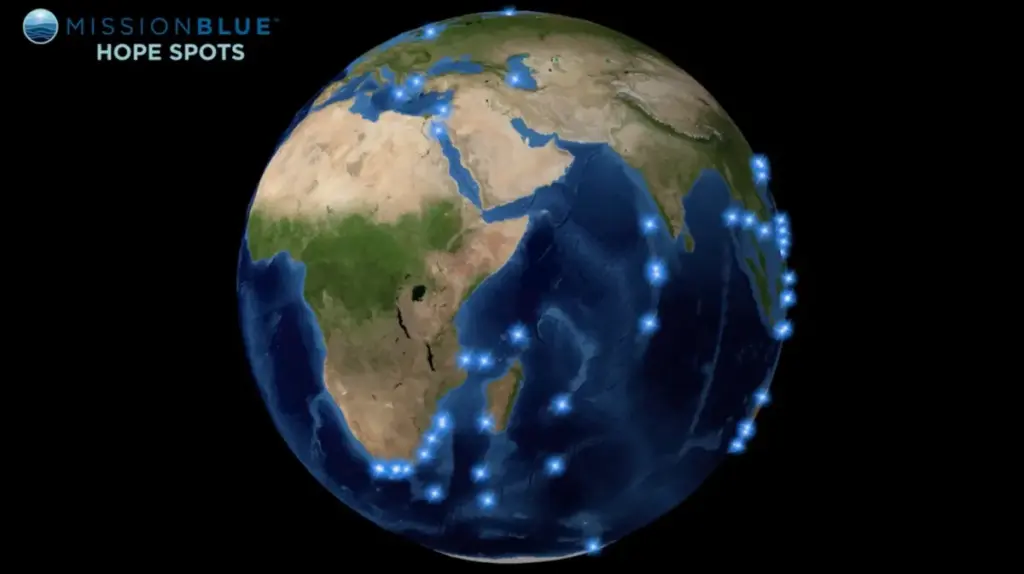
Enter a powerful new technological alliance between Mission Blue®—the global ocean conservation initiative founded by legendary oceanographer Dr. Sylvia Earle—and Esri, the global market leader in geographic information system (GIS) software. By leveraging Esri’s sophisticated ArcGIS platform, Mission Blue has engineered an interactive, dynamic global map that synthesizes Mission Blue Hope Spots® with comprehensive marine protected area data from the Marine Protection Atlas (MPAtlas) and the World Database on Protected Areas (WDPA).
Unveiled during the plenary session of the 2026 Esri User Conference, this groundbreaking mapping tool transforms complex, multidimensional marine data into an intuitive, visually compelling narrative. It does not merely show where ocean protection exists; it evaluates the quality and strength of that protection. By differentiating between fully protected marine reserves that ban all extractive activities and partially protected zones that permit industrial fishing or resource extraction, this technology provides an uncompromising, transparent look at the state of our blue planet.
This article examines the genesis, technological architecture, and profound implications of this mapping initiative. It explores how spatial analysis is empowering local Hope Spot Champions, guiding international policy, and turning raw data into an undeniable call to action for the global ocean conservation community.
Detailed Chronology: From Vision to Digital Reality
To understand the weight of the new Esri-powered mapping initiative, it is essential to trace the evolutionary trajectory of Mission Blue and the technological milestones that brought marine spatial analysis to the forefront of environmental activism.
The Genesis of Hope Spots (2009–2015)
The concept of Hope Spots was introduced to the global consciousness in 2009 by Dr. Sylvia Earle during her TED Prize acceptance speech. At a time when marine conservation discussions were largely dominated by broad, generalized appeals to "save the oceans," Dr. Earle advocated for a more targeted approach. She envisioned a global network of marine areas critical to the health of the biosphere—regions distinguished by extraordinary biodiversity, crucial spawning grounds, unique geological formations, carbon-sequestering seagrass meadows and mangroves, or sites of profound cultural and historical significance.
In its early years, identifying and advocating for Hope Spots relied heavily on academic literature, anecdotal field reports, localized marine expeditions, and grassroots campaigns led by dedicated "Hope Spot Champions." While immensely successful in raising public awareness and inspiring localized stewardship, these early campaigns faced a logistical hurdle: communicating the interconnected scale of these sites to international policymakers and funding bodies. Static maps and descriptive text documents struggled to capture how a local coral reef in the Coral Triangle or a deep-sea trench off the coast of South America fit into a planetary conservation strategy.
The Integration of GIS and Marine Data (2016–2023)
As the digital mapping landscape matured, conservation organizations began recognizing the untapped potential of geographic information systems. Environmental mapping moved beyond static cartography into the realm of dynamic, cloud-based spatial analysis.
During this period, global marine databases expanded exponentially. Initiatives like the Marine Protection Atlas began standardizing how the world measured the actual ecological effectiveness of MPAs, pushing past the political rhetoric of "paper parks"—protected areas that exist on government decree but lack enforcement or genuine restrictions on industrial exploitation. Concurrently, international repositories like the World Database on Protected Areas (WDPA), managed by UNEP-WCMC and the IUCN, refined their spatial datasets.
Mission Blue began integrating these datasets to better understand the geographical relationships between its designated Hope Spots and existing governmental protections. However, these efforts were often siloed, requiring custom GIS work for individual regions or specific campaigns.
The 2026 Esri User Conference Breakthrough
The culmination of years of data integration, technological refinement, and collaborative design took center stage at the 2026 Esri User Conference Plenary Session. There, Mission Blue officially unveiled its comprehensive, global web map powered by Esri’s ArcGIS platform.
For the first time, stakeholders could visualize the entire portfolio of hundreds of global Hope Spots layered directly over the global mosaic of marine protected areas. The presentation demonstrated how geospatial technology could instantly reveal whether a Hope Spot was fully safeguarded, partially protected, or completely devoid of formal legal status. The release marked a paradigm shift: conservation data was no longer locked away in technical databases; it was accessible, interactive, and primed for immediate action.
Supporting Context & Metrics: Decoding the Ocean’s Layers
To fully appreciate the utility of the new Mission Blue ArcGIS map, one must understand the underlying datasets and the nuances of marine protection metrics. Conservation is no longer merely about drawing lines on a map; it is about evaluating the integrity of those boundaries.
The Anatomy of a Hope Spot
Hope Spots are intentionally diverse in their makeup. They are not uniform nature reserves; rather, they represent critical nodes in the global ocean network. Their designations fall into several distinct categories:
- Biodiversity Hotspots: Ecosystems exhibiting exceptionally high species richness and endemism, such as coral reefs, seamounts, and deep-sea hydrothermal vents.
- Essential Habitats & Migration Corridors: Vital zones used by marine mammals, sea turtles, pelagic fish, and seabirds for breeding, feeding, and transoceanic migrations.
- Carbon-Rich Ecosystems ("Blue Carbon"): Mangroves, salt marshes, and seagrass beds capable of sequestering atmospheric carbon at rates up to ten times higher than terrestrial forests.
- Cultural & Socioeconomic Anchors: Marine regions that sustain Indigenous communities, artisanal fisheries, and coastal economies through sustainable stewardship.
- Locally Led Conservation Zones: Areas where grassroots leadership, community-based management, and indigenous ecological knowledge are actively driving conservation success against external threats.
Unpacking the MPA Atlas Classifications
A major innovation of the new Esri-powered map is its integration with the Marine Protection Atlas (MPAtlas). Historically, governments could inflate global marine protection statistics by declaring massive ocean areas as "protected," even if those zones allowed commercial bottom trawling, oil and gas exploration, or industrial longlining.
The MPAtlas addresses this discrepancy by categorizing marine protected areas based on their actual implementation and legal restrictions:
- Fully Protected: Areas where all extractive and destructive activities (such as commercial fishing, mining, and dredging) are prohibited, allowing ecosystems to recover to a pristine state.
- Highly Protected: Zones that allow only minimal, non-industrial extraction (such as traditional subsistence fishing by Indigenous communities) that does not compromise ecological integrity.
- Partially Protected: Areas with significant restrictions on some activities, but which still permit industrial or commercial fishing, drilling, or shipping lanes.
- Unimplemented / Proposed: Areas that have been announced by governments on paper but lack management plans, legal enforcement, or active oversight.
By cross-referencing Hope Spots with these rigorous MPA Atlas classifications, the new Esri map strips away the illusion of paper parks. It allows scientists and policymakers to instantly identify whether a Hope Spot enjoys robust, fully protected status or whether its rich biodiversity is merely masked by weak, nominal policy designations.
Official Statements & Industry Perspectives
The convergence of marine biology and advanced geospatial technology has drawn high praise from leaders across both the conservation and technology sectors.
Dr. Sylvia Earle, President and Founder of Mission Blue, has repeatedly emphasized the urgent need to make ecological data universally accessible. Reflecting on the philosophy behind the mapping initiative, Dr. Earle noted:
"We must know what we have in order to protect it. For too long, the ocean has been treated as out of sight, out of mind—a bottomless basket of goods and an endless waste receptacle. By visualizing where our Hope Spots align with existing marine protected areas, we are shining a light on the ocean’s most vital organs. Technology like Esri’s ArcGIS allows us to translate complex science into a universal language that anyone—from a local schoolchild to a head of state—can understand and act upon."
From the technology sector, industry leaders underscore the role of GIS in democratizing environmental intelligence. Esri representatives highlighted that the collaboration with Mission Blue exemplifies how spatial science can directly support global sustainability goals. By embedding sophisticated spatial analysis into cloud-based dashboards, conservationists are empowered to perform sophisticated multi-layered queries—such as analyzing climate vulnerability trends, tracking illegal fishing incursions, and measuring local community engagement—all within a unified mapping interface.
Furthermore, international conservation bodies, including the International Union for Conservation of Nature (IUCN) and the UN Environment Programme World Conservation Monitoring Centre (UNEP-WCMC), have lauded the initiative for integrating authoritative global datasets (such as the World Database on Protected Areas) into an actionable, user-centric format.
Future Outlook: The Road to 2030 and Beyond
As the global community barrels toward the pivotal 2030 deadline for the 30×30 initiative—the target to formally protect 30% of the Earth’s lands and oceans—tools like the Mission Blue ArcGIS map will serve as indispensable compasses for environmental strategy.
Bridging Policy Gaps and Directing Resources
The immediate utility of this mapping platform lies in its ability to optimize resource allocation. Philanthropic foundations, international NGOs, and government agencies can use the map to pinpoint exactly where funding and political capital are most urgently needed.
For instance, if a Hope Spot overlaps entirely with a fully protected, well-managed marine reserve, conservation efforts can pivot toward long-term monitoring, climate resilience adaptation, and community support. Conversely, if a biologically irreplaceable Hope Spot exhibits zero formal protection—or worse, is classified as a "paper park" with rampant industrial exploitation—the map provides undeniable visual evidence to lobby governments for stronger legislative safeguards.
Empowering Local Champions
Crucially, the mapping platform serves to elevate the voices of local Hope Spot Champions. Conservation is rarely driven solely by remote satellite imagery; it is sustained by the tireless efforts of local fishers, Indigenous leaders, marine biologists, and community activists who fight to protect their ancestral waters. By embedding localized narratives, photographs, and qualitative data into the global ArcGIS framework, Mission Blue ensures that grassroots efforts are visibly connected to the broader planetary movement. A local community fighting to protect a mangrove forest in the Global South can now see their local struggle contextualized within the global tapestry of the 30×30 framework.
Scaling Up for Planetary Resilience
Looking further ahead, Mission Blue plans to continuously update and expand the mapping capabilities of the Esri platform. Future iterations are expected to incorporate real-time environmental monitoring data, including satellite tracking of industrial fishing vessels (via partnerships with platforms like Global Fishing Watch), ocean temperature anomalies linked to marine heatwaves and coral bleaching, and ocean acidification metrics.
By layering these dynamic threat indicators over the static baselines of Hope Spots and MPAs, Mission Blue and Esri are building an early-warning system for the global ocean. This evolution transforms the map from a historical archive of conservation efforts into an active, predictive dashboard for planetary stewardship.
Conclusion
The launch of the Mission Blue Hope Spots and Marine Protected Areas map on the Esri ArcGIS platform marks a defining moment in modern ocean conservation. By bridging the gap between rigorous scientific data and intuitive visual storytelling, this initiative demystifies the state of global marine protection. It strips away the comforting fiction of paper parks, highlights genuine conservation victories, and exposes the glaring gaps where our blue planet remains dangerously exposed to exploitation.
As humanity navigates the critical window leading up to 2030, the tools we use to understand our world will dictate our success in preserving it. Through the fusion of visionary grassroots advocacy and cutting-edge geospatial technology, Mission Blue is transforming raw data into profound insight—and turning insight into the urgent, decisive action required to safeguard the oceans that sustain all life on Earth.