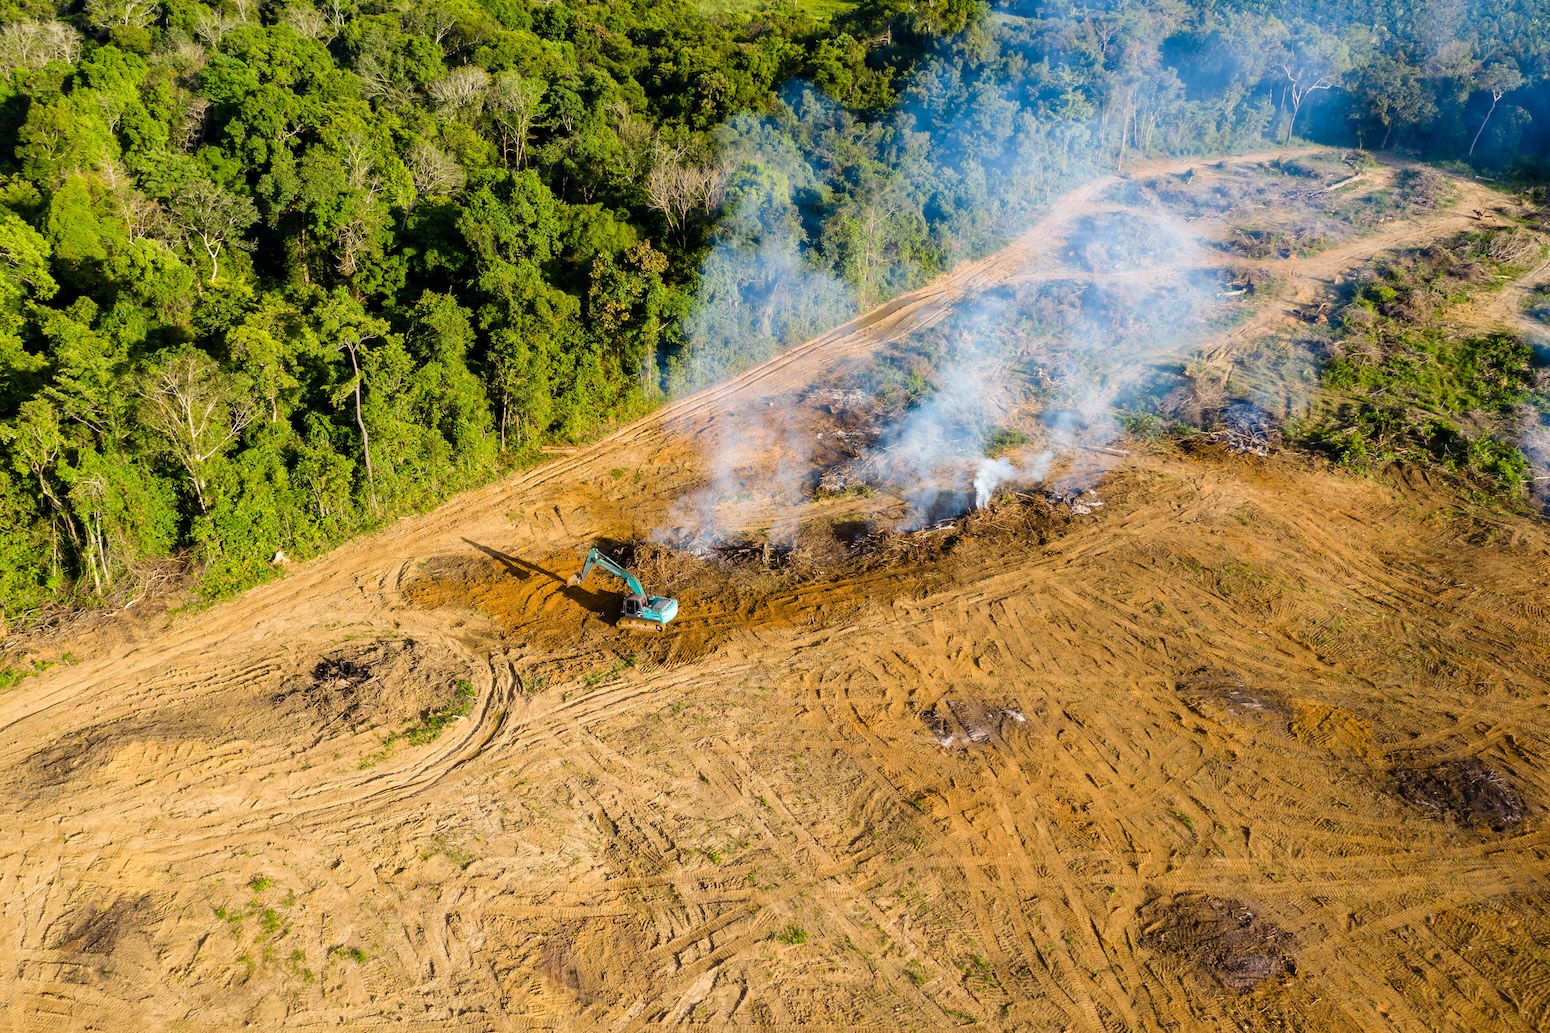
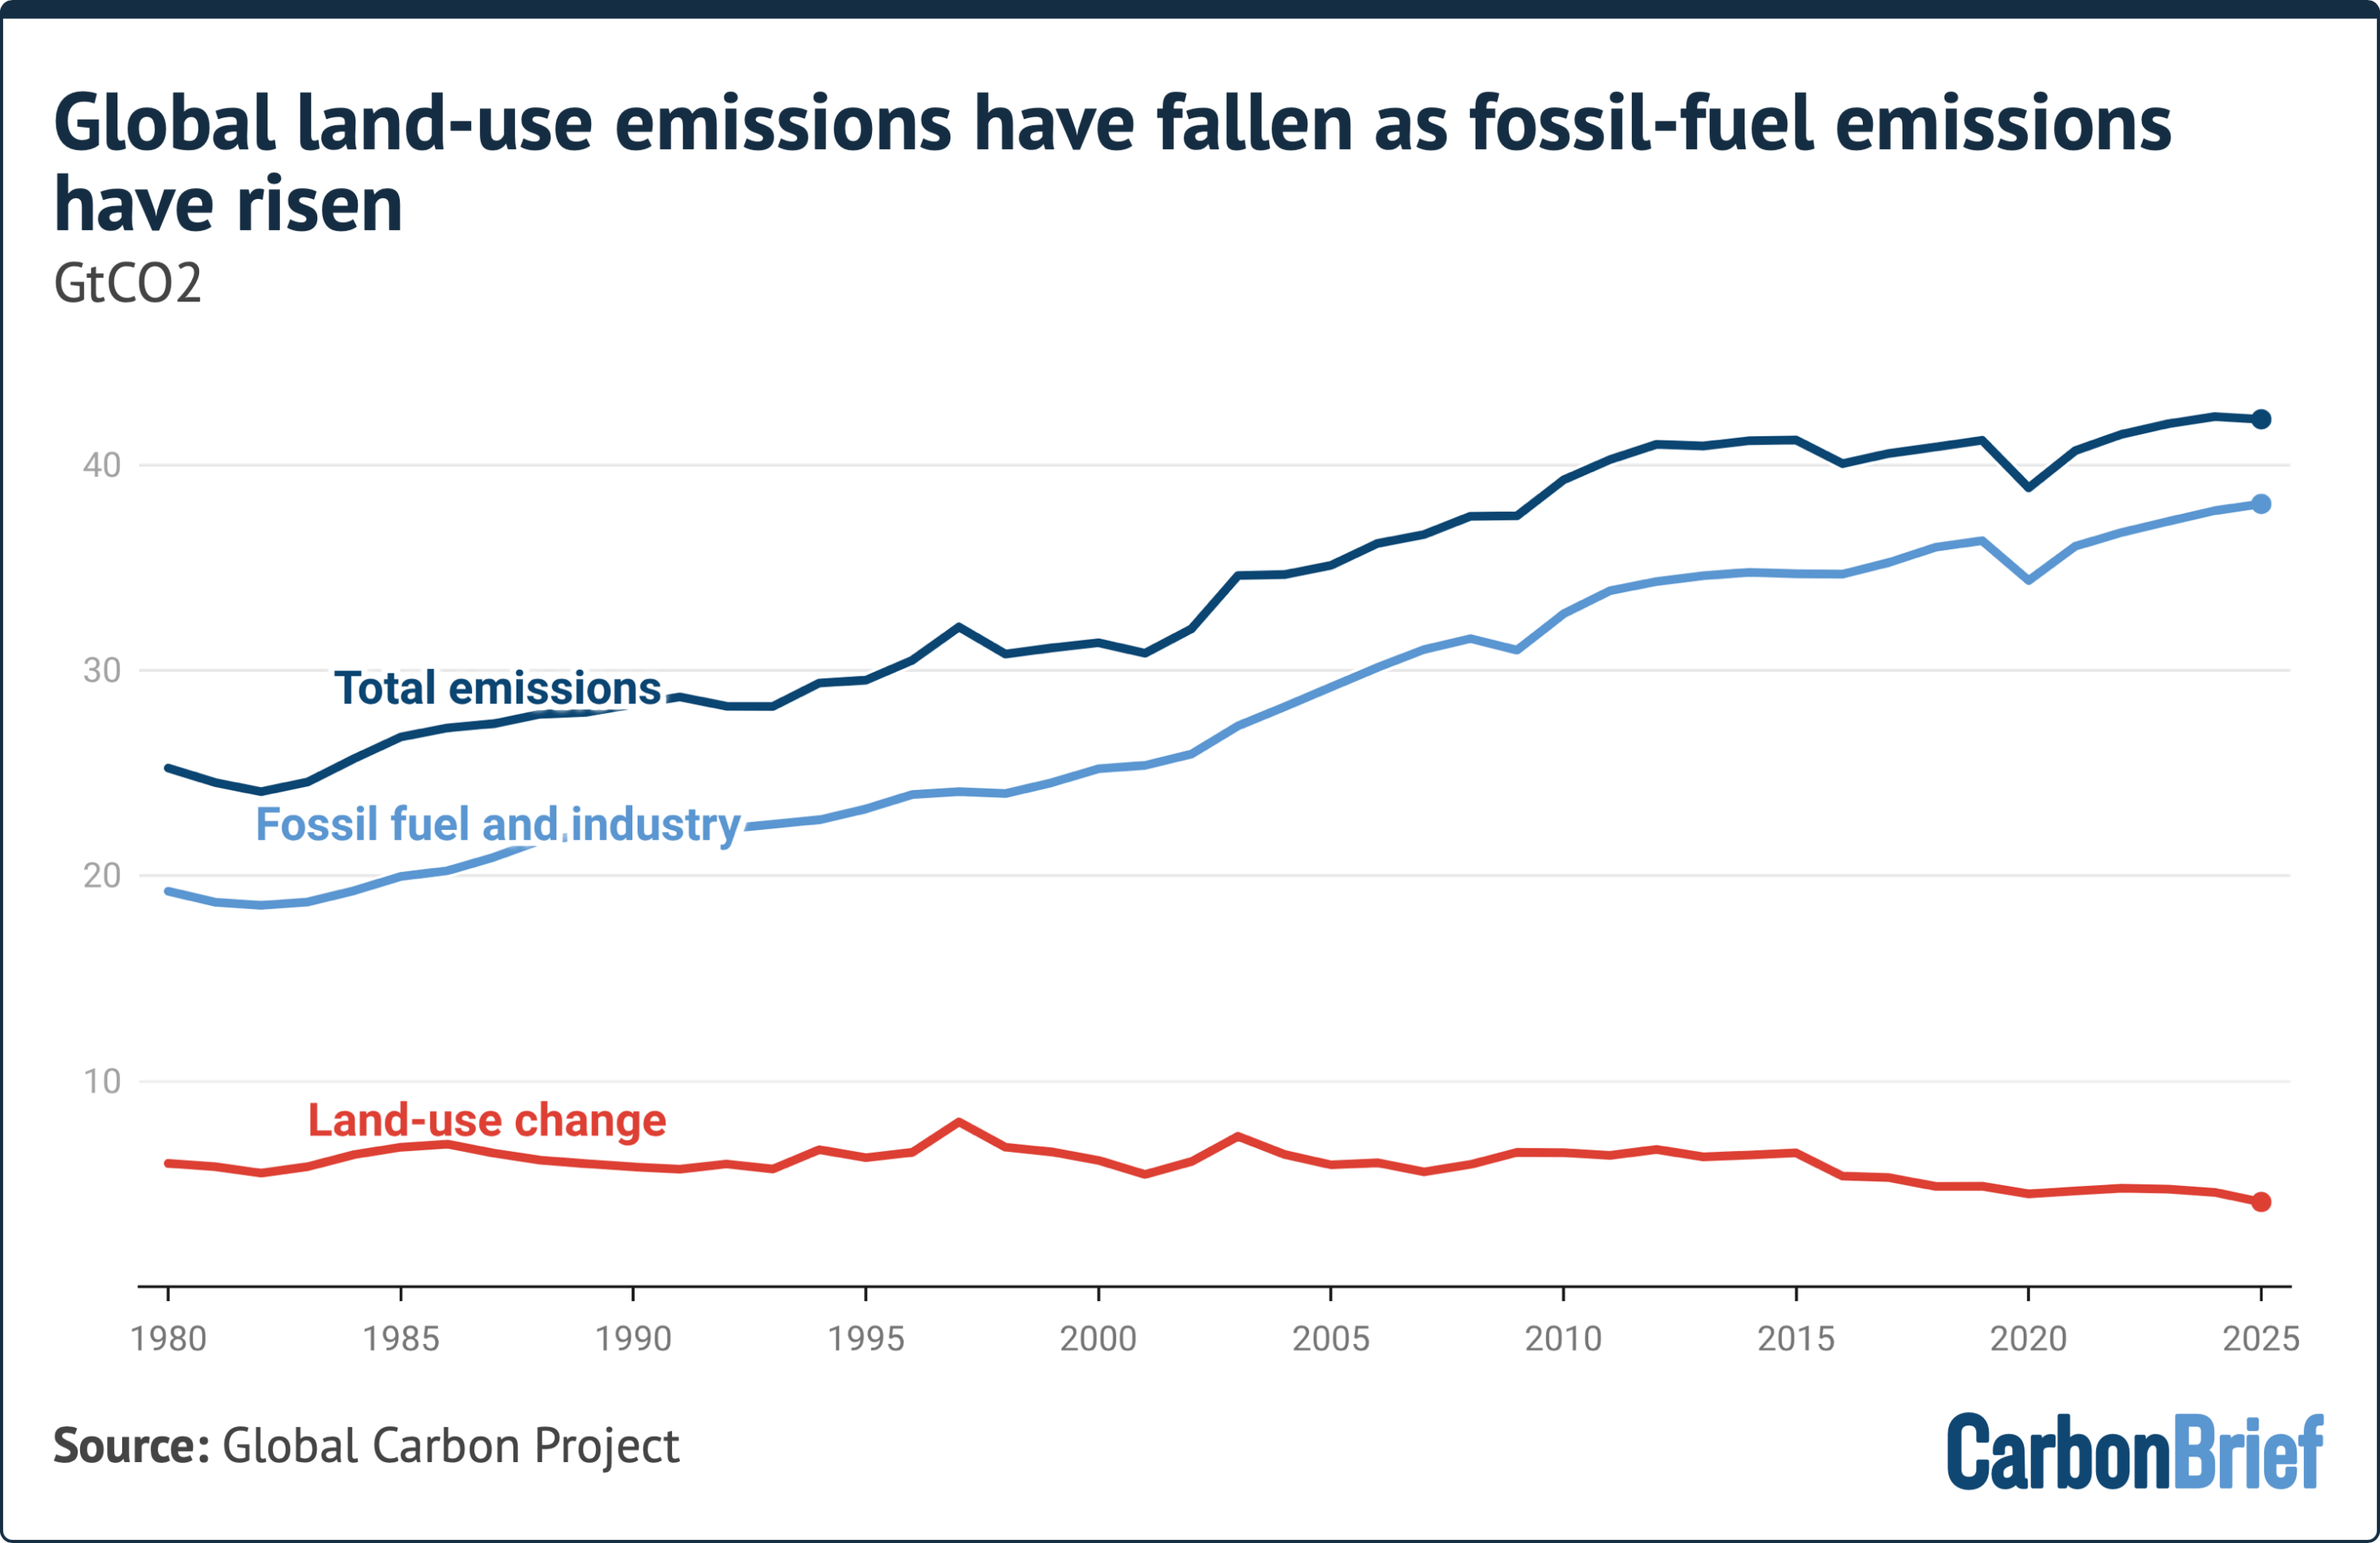
While global reliance on fossil fuels continues to push industrial carbon dioxide ($CO_2$) emissions to record highs, a quiet yet transformative shift has taken root across the planet’s terrestrial ecosystems. According to data formally published in Earth System Science Data by the Global Carbon Budget team, net carbon emissions originating from land-use change, land-use change and forestry (LULUCF)—encompassing tropical deforestation, peatland drainage, and forest degradation—have experienced a statistically significant decline over the past quarter of a century.
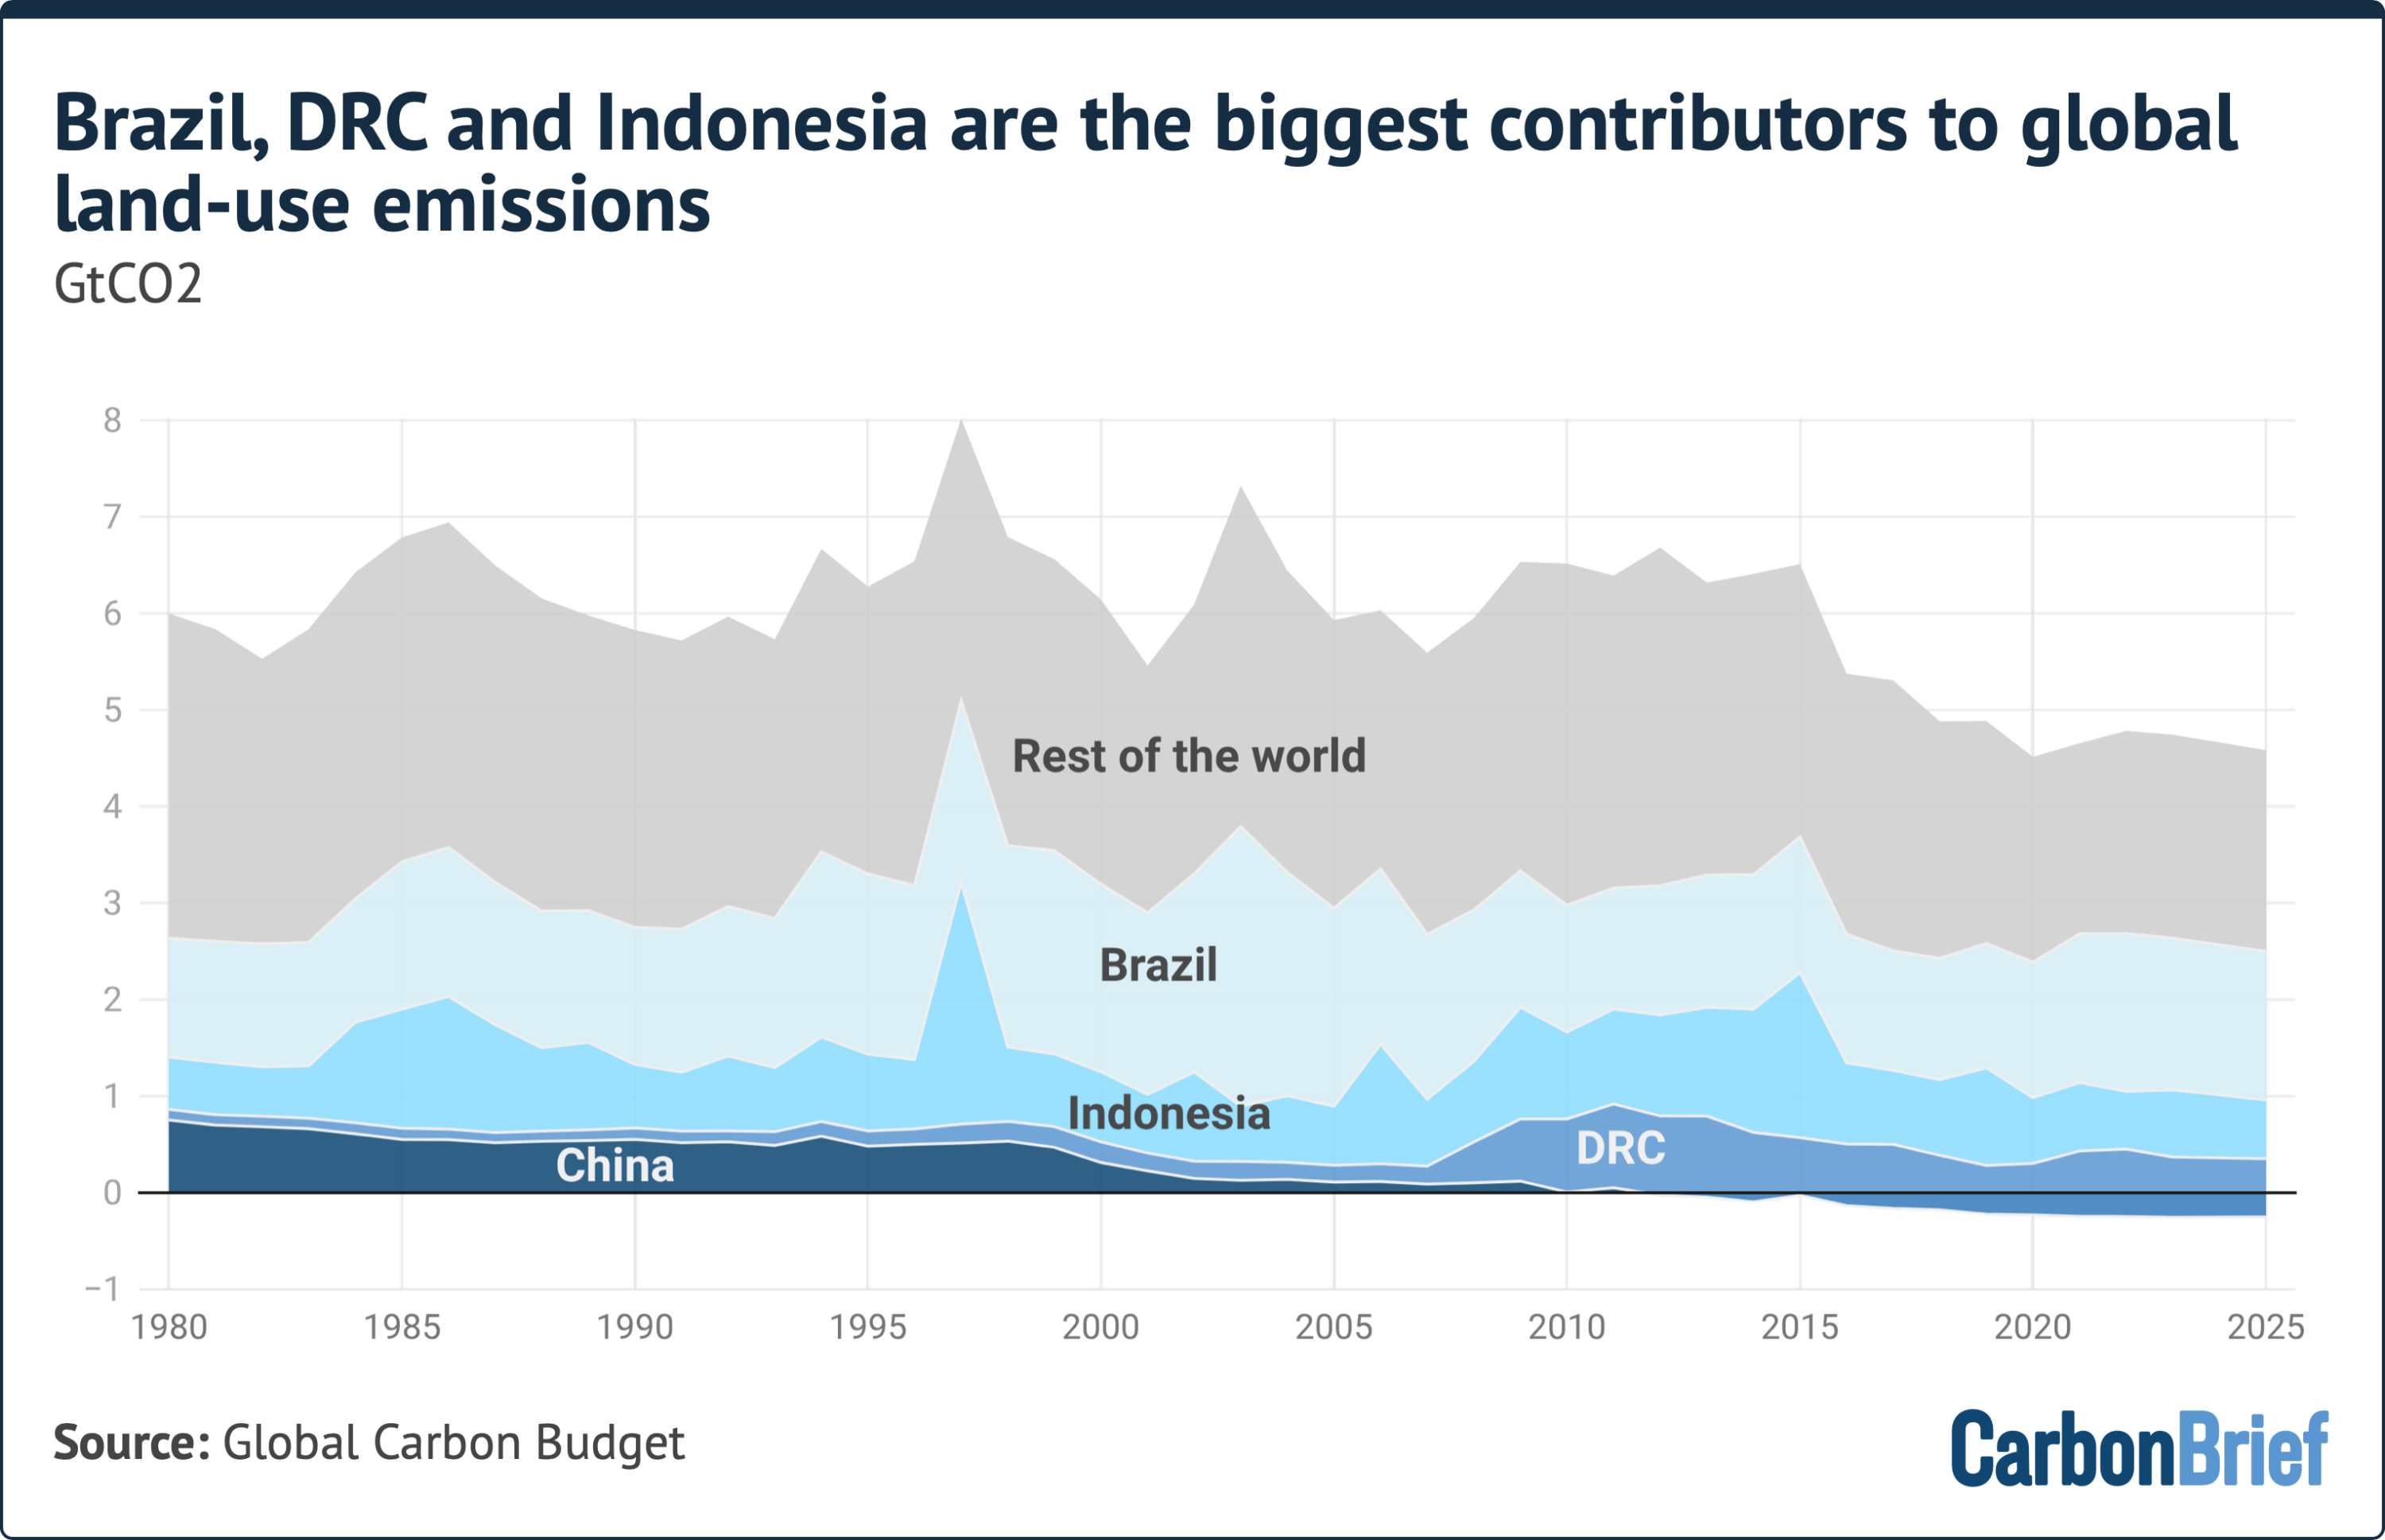
This multi-decade trajectory of falling land-use emissions stands in stark contrast to the relentless growth of industrial emissions. Between 2015 and 2024, annual net land-use emissions averaged 5.0 gigatonnes of carbon dioxide ($GtCO_2$), representing a 23% reduction from the 1995–2004 average ($6.5 GtCO_2$) and a 19% drop from the 2005–14 period. Preliminary figures for 2025 project a further drop to $4.1 GtCO_2$—roughly 32% lower than the annual average recorded during the 2000s.
This deceleration is driven by a combination of targeted anti-deforestation policy frameworks in the tropics, aggressive peatland restoration initiatives in Southeast Asia, and unprecedented afforestation and natural regeneration efforts in Northern Hemisphere economies.
However, carbon accounting experts caution against complacency. While terrestrial ecosystems are increasingly acting as a buffer against total anthropogenic emissions, the ongoing rise in fossil fuel emissions—which climbed to an estimated $38.1 GtCO_2$ in 2025—threatens to overshadow these land-based gains.
Detailed Chronology of Global Land-Use Emissions
To understand the mechanics of this environmental shift, researchers track land-use dynamics across four distinct historical phases spanning the last six decades:
For nearly four decades following the mid-20th century, global net emissions from land-use change remained stubbornly flat, averaging approximately $6.6 GtCO_2$ per year. During this epoch, rapid tropical agricultural expansion across the Amazon Basin, Central Africa, and Southeast Asia drove high rates of primary forest clearance. These emissions offset the modest natural carbon uptake taking place in abandoned agricultural lands across North America and Western Europe.
2. The Turn-of-the-Century Inflection (2000–2014)
The late 1990s marked a structural turning point. Driven by international pressure, satellite-based monitoring, and domestic regulatory frameworks, rates of permanent deforestation began to slow, most notably in South America. Concurrently, large-scale ecological engineering projects—most prominently China’s nationwide forest restoration programs—began drawing down significant volumes of atmospheric carbon, initiating a downward slope in net global LULUCF emissions.
3. Accelerated Deceleration (2015–2024)
Over the decade leading into 2024, the fall in land-use emissions accelerated sharply. A major catalyst was the subsidence of extreme tropical peat fires following the severe 2015 El Niño event, alongside aggressive peatland rewetting programs in Indonesia. Between 2015 and 2024, average annual land-use emissions dropped to $5.0 GtCO_2$. Massive afforestation, active reforestation, and natural regeneration across temperate and tropical zones began compensating for a substantial fraction of ongoing land clearance.
4. Post-El Niño Stabilization (2024–2025)
Preliminary calculations indicate that land-use emissions contracted further to $4.1 GtCO_2$ in 2025. Scientists credit this drop to the transition out of El Niño conditions, which naturally suppressed the intense drought and uncontrolled fire activity that historically plagues drained peatlands and tropical forest margins during warm Pacific ocean phases.
Supporting Context & Metrics
Key Drivers: Deforestation Clearance vs. Forest Sequestration
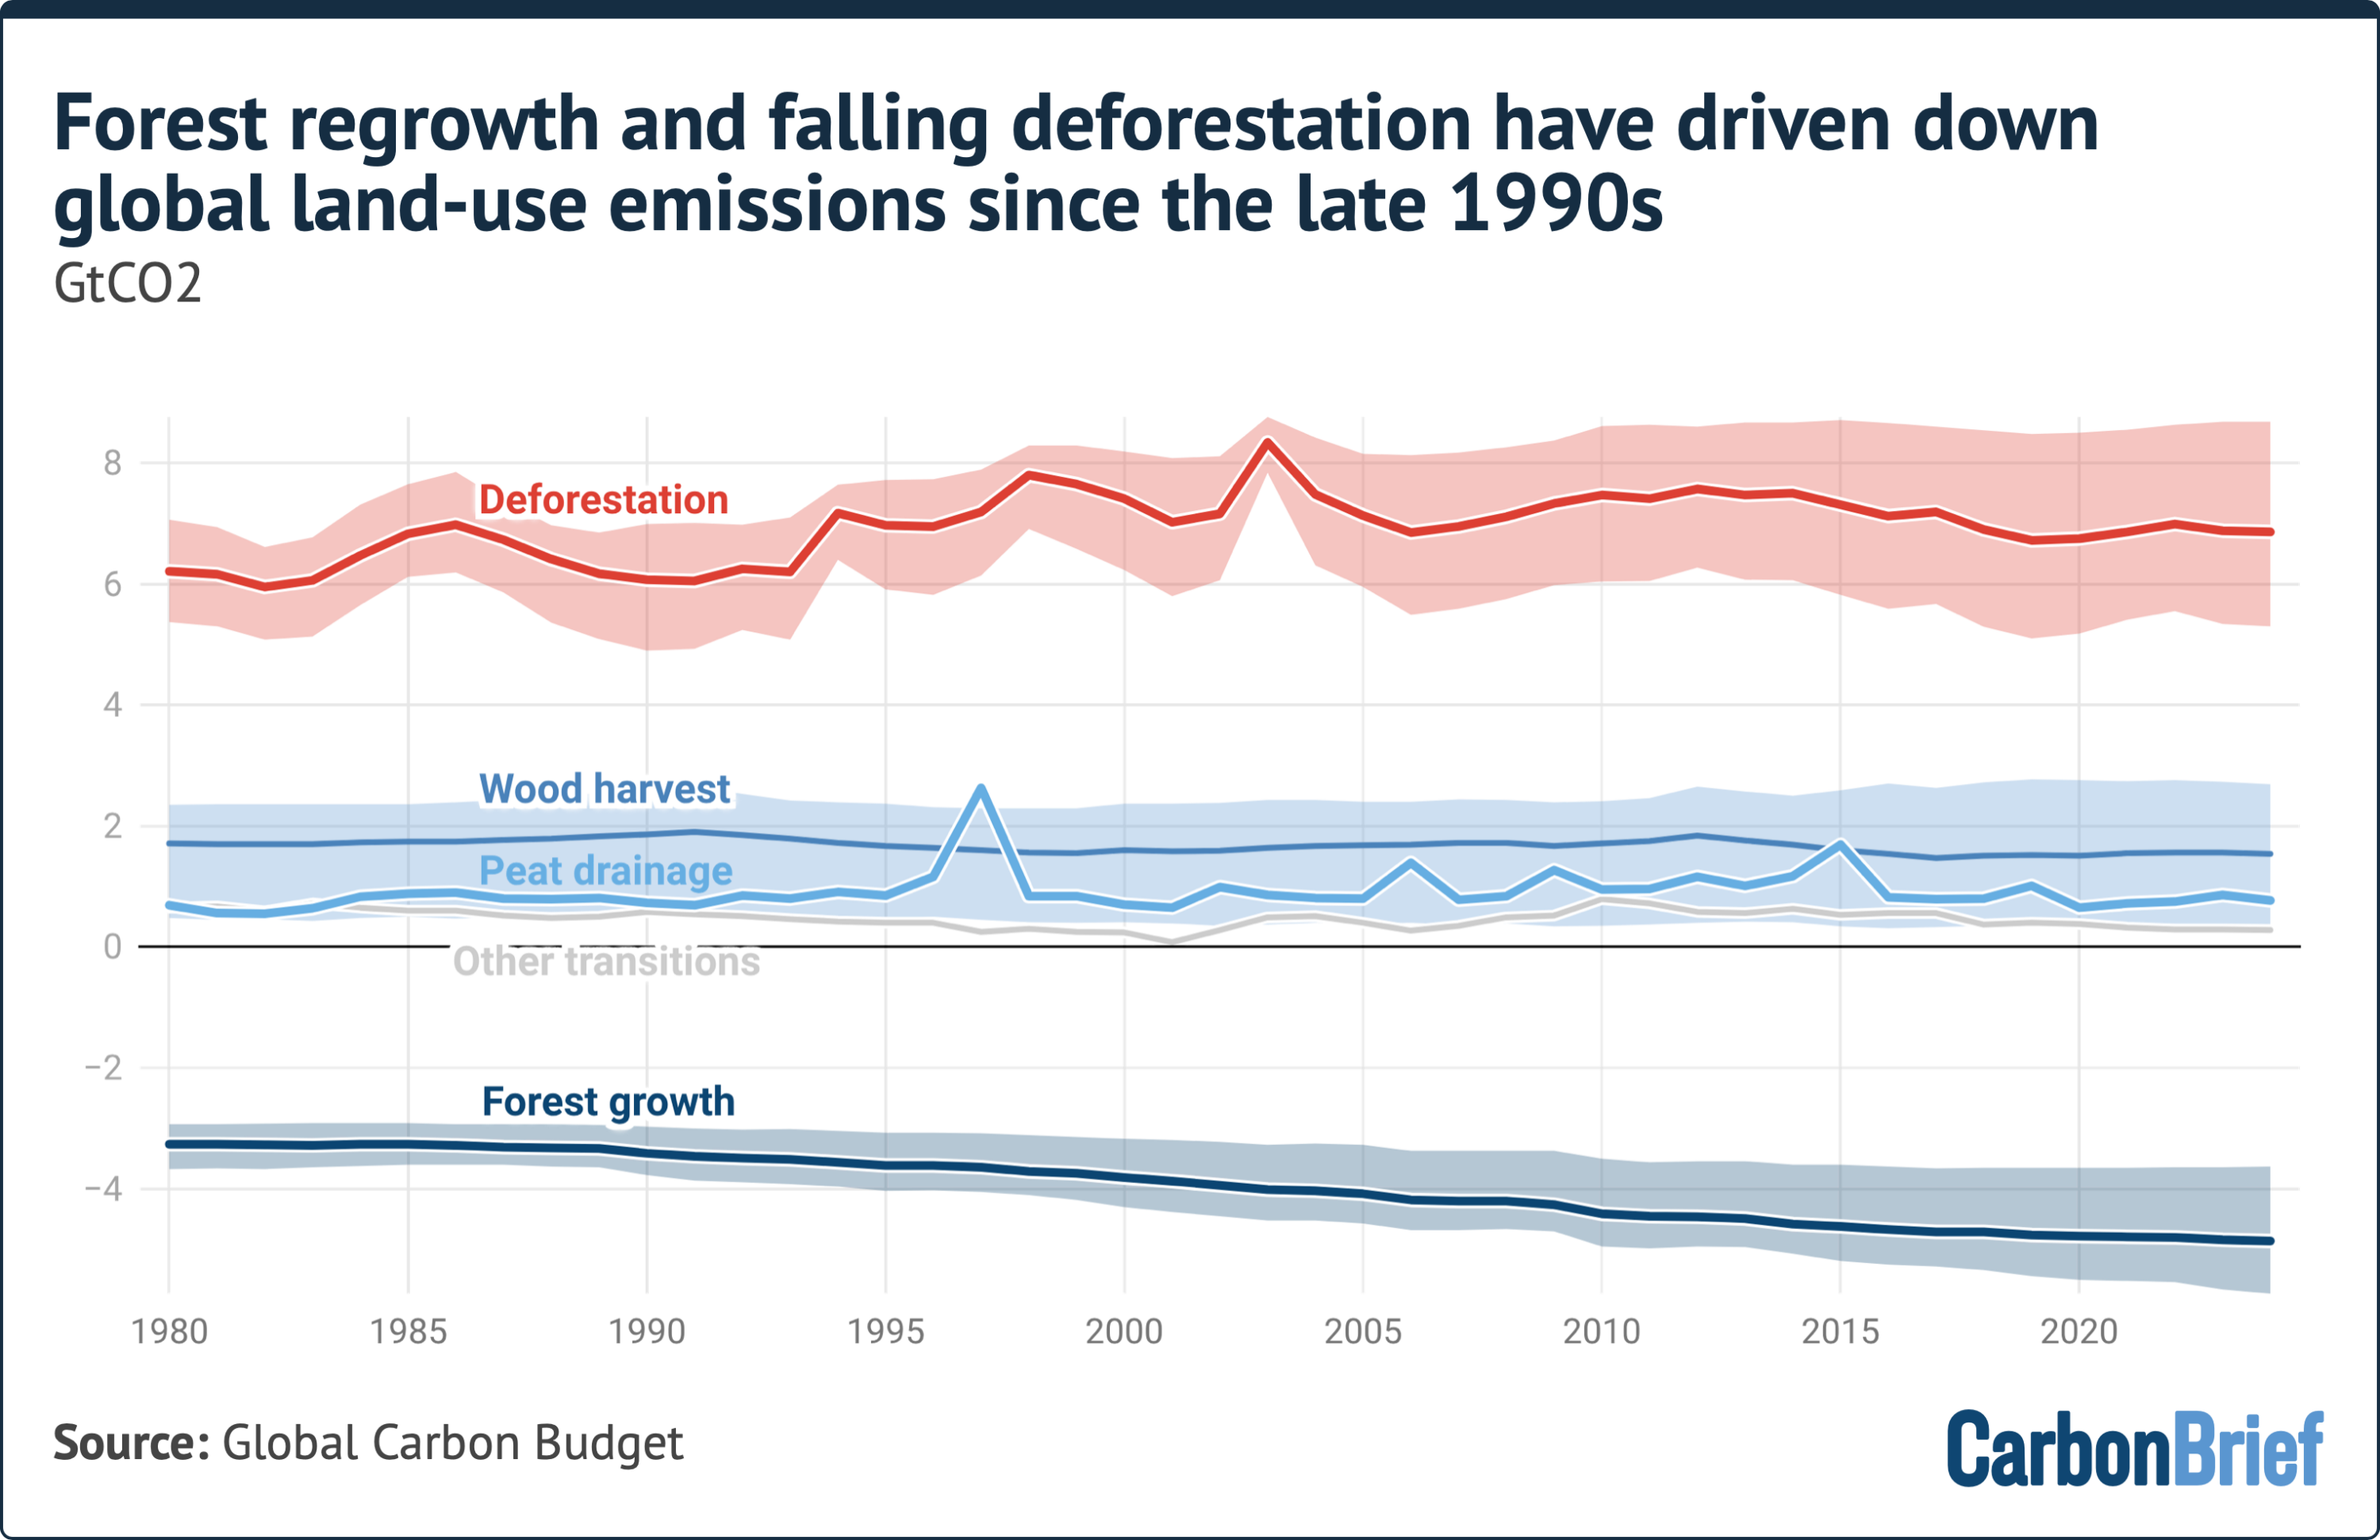
The net LULUCF emission figure is the balance between two massive opposing flux streams: gross emissions from land destruction and gross carbon uptake from plant growth.
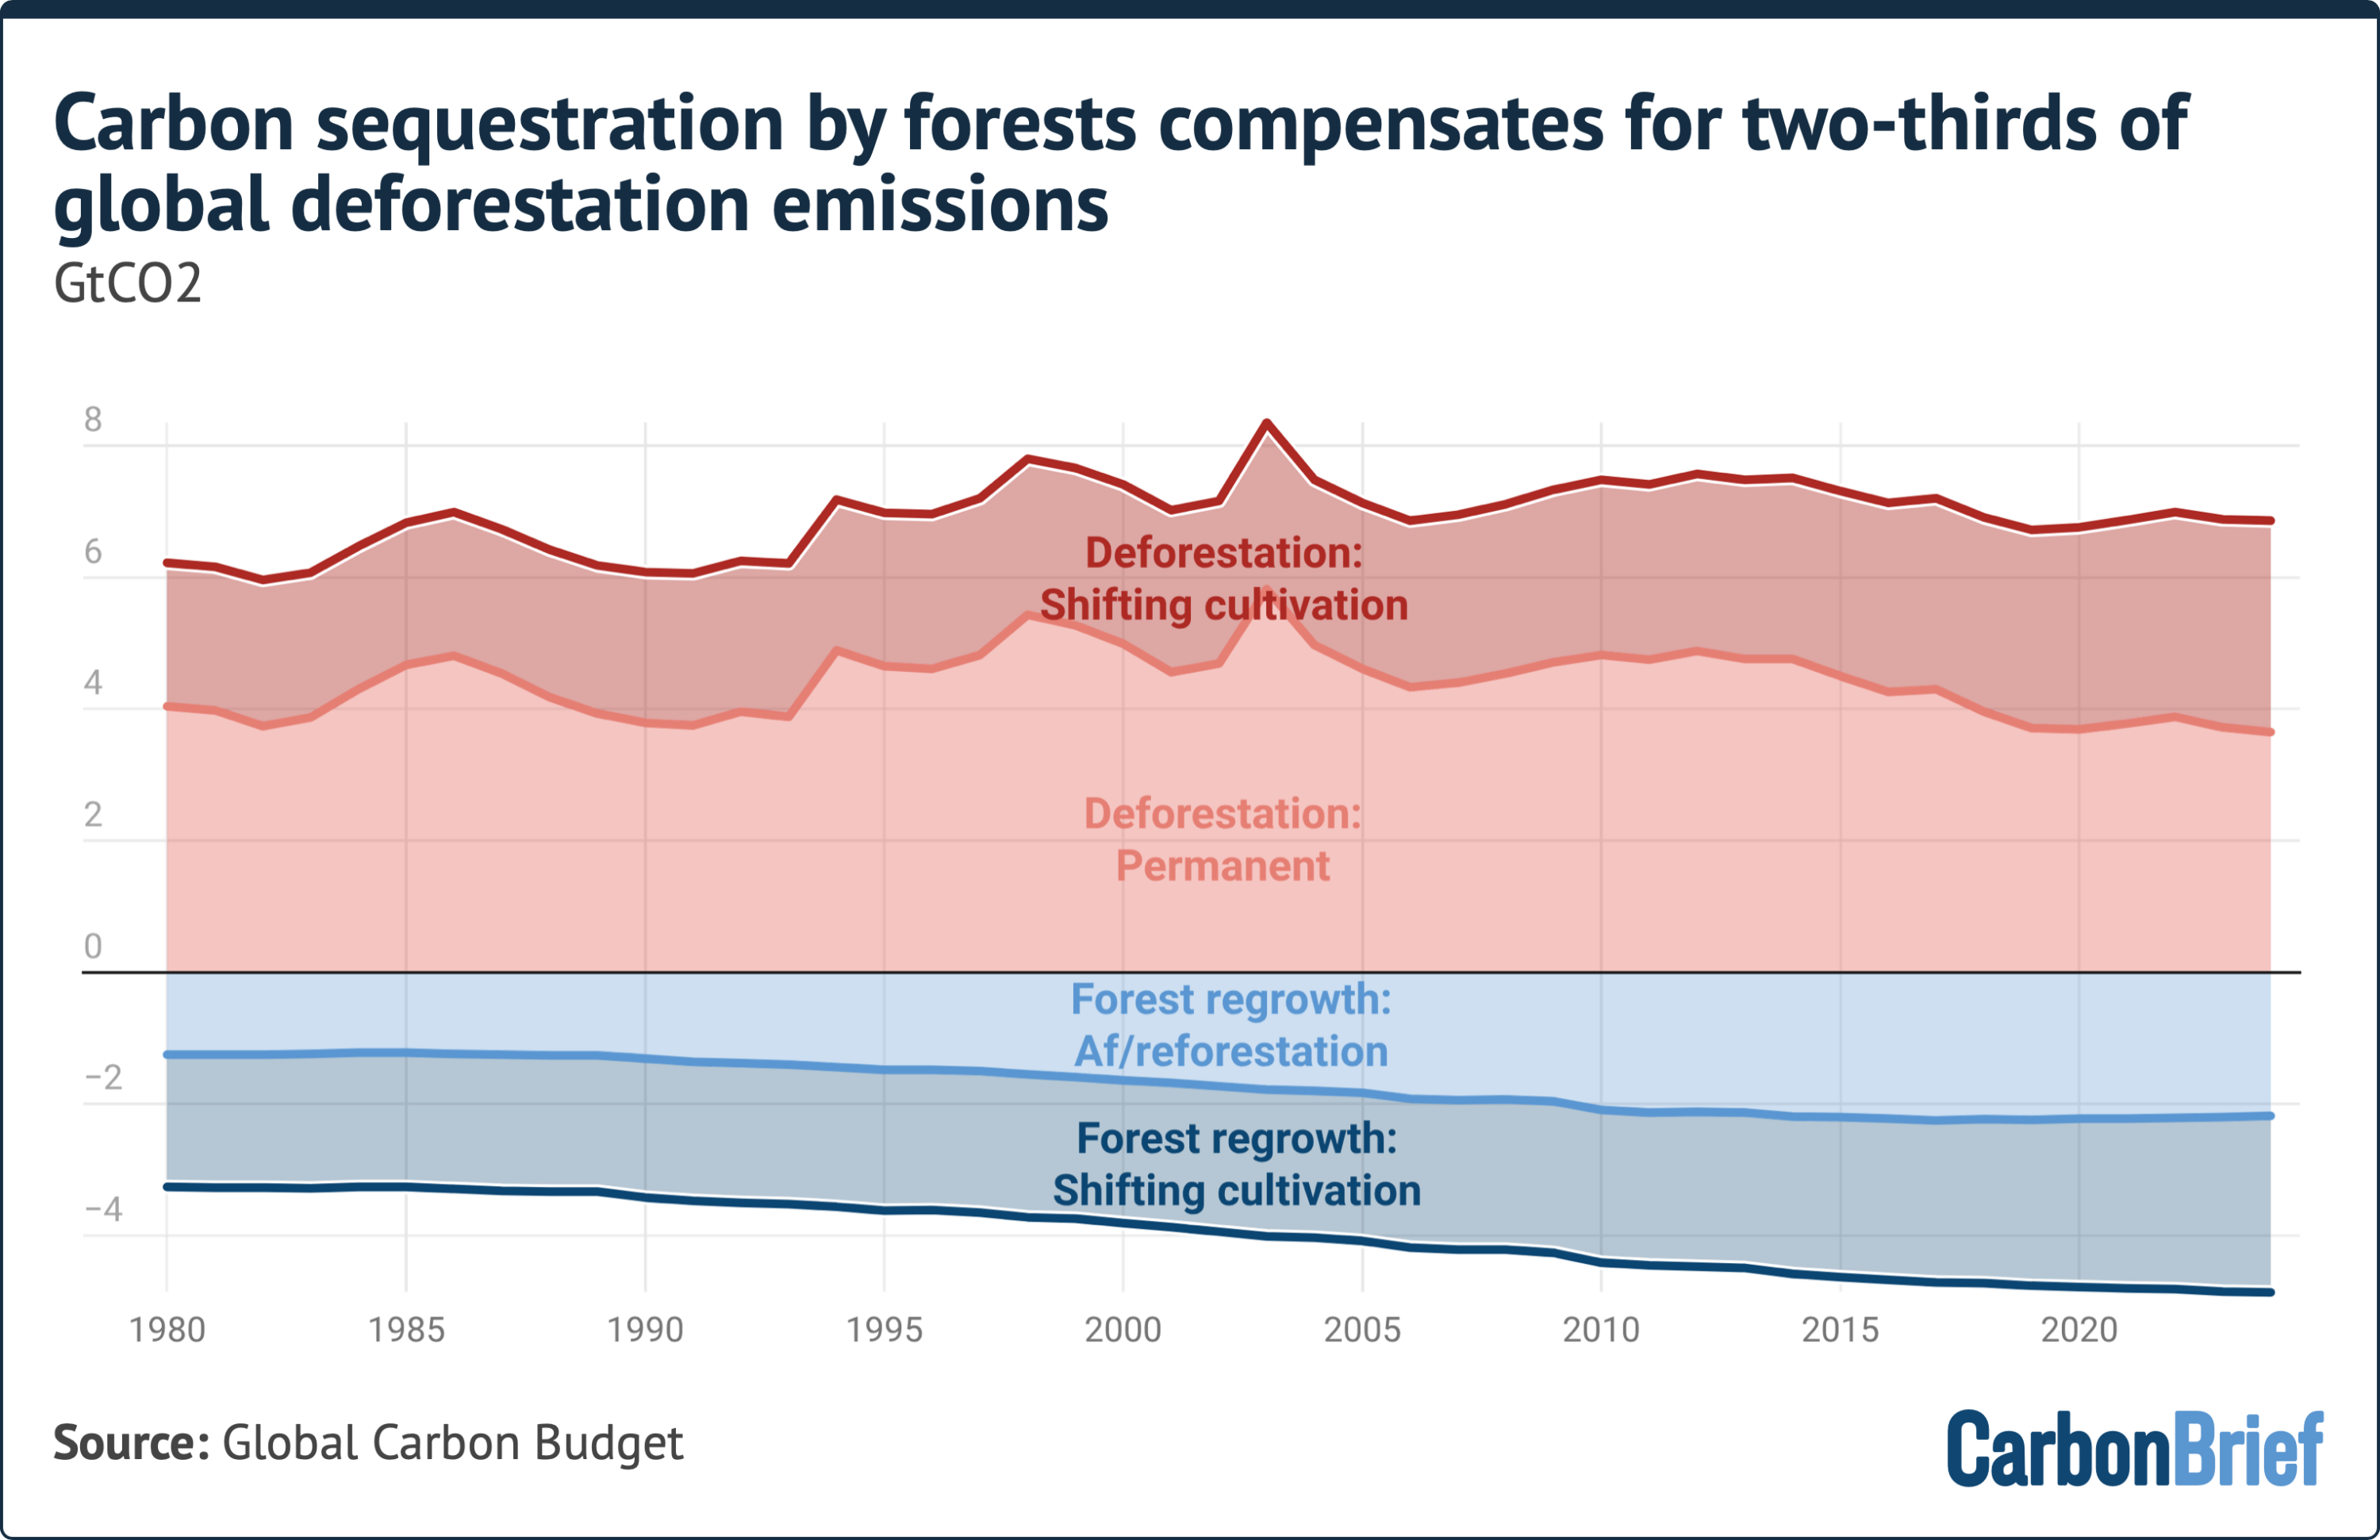
Between 2015 and 2024, gross global deforestation released an average of $6.96 GtCO_2$ annually into the atmosphere. However, global carbon uptake through forest growth offset more than two-thirds of those gross emissions, absorbing $4.76 GtCO_2$ per year.
Carbon uptake is split across two primary mechanisms:
Targeted Afforestation and Reforestation: Planted forests and managed restoration initiatives removed an average of $2.20 GtCO_2$ per year over the 2015–2024 period.
Shifting Cultivation Regrowth: Secondary forest recovery on fallow or abandoned agricultural land sequestered an additional $2.56 GtCO_2$ annually.
Regional Case Studies: Drivers of Net Shifts
The global drop in land-use emissions is concentrated within a select group of key geographic players. Over half (57%) of all global land-use emissions between 2015 and 2024 originated from just three nations: Brazil, Indonesia, and the Democratic Republic of the Congo (DRC). Changes in how these three nations—alongside major Northern Hemisphere economies—manage land account for the global net decline.
+-----------------------------------------------------------------------------------+
|                            REGIONAL LULUCF DYNAMICS                               |
+-------------------+:--------------------------------------------------------------+
| Country/Region    | Dominant Driver & Observed Trend                              |
+-------------------+:--------------------------------------------------------------+
| Brazil            | Net Decline: Amazon policy enforcement (PPCDAm, Soy           |
|                   | Moratorium) cut deforestation from 2000s peaks.               |
+-------------------+:--------------------------------------------------------------+
| Indonesia         | Net Decline: Unprecedented peatland rewetting and reduced     |
|                   | land-clearing fire activity post-2015.                        |
+-------------------+:--------------------------------------------------------------+
| China             | Net Carbon Sink: Aggressive nationwide reforestation and      |
|                   | land management policies initiated in the 1990s.             |
+-------------------+:--------------------------------------------------------------+
| US & EU           | Net Carbon Sinks: Mature forest expansion stemming from 19th/ |
|                   | 20th-century forest transition dynamics.                      |
+-------------------+:--------------------------------------------------------------+
| DRC               | Persistent High Emissions: Driven by smallholder agriculture, |
|                   | fuelwood harvesting, and demographic pressures.               |
+-------------------+:--------------------------------------------------------------+
Brazil: Policy Interventions and Governance Cycles
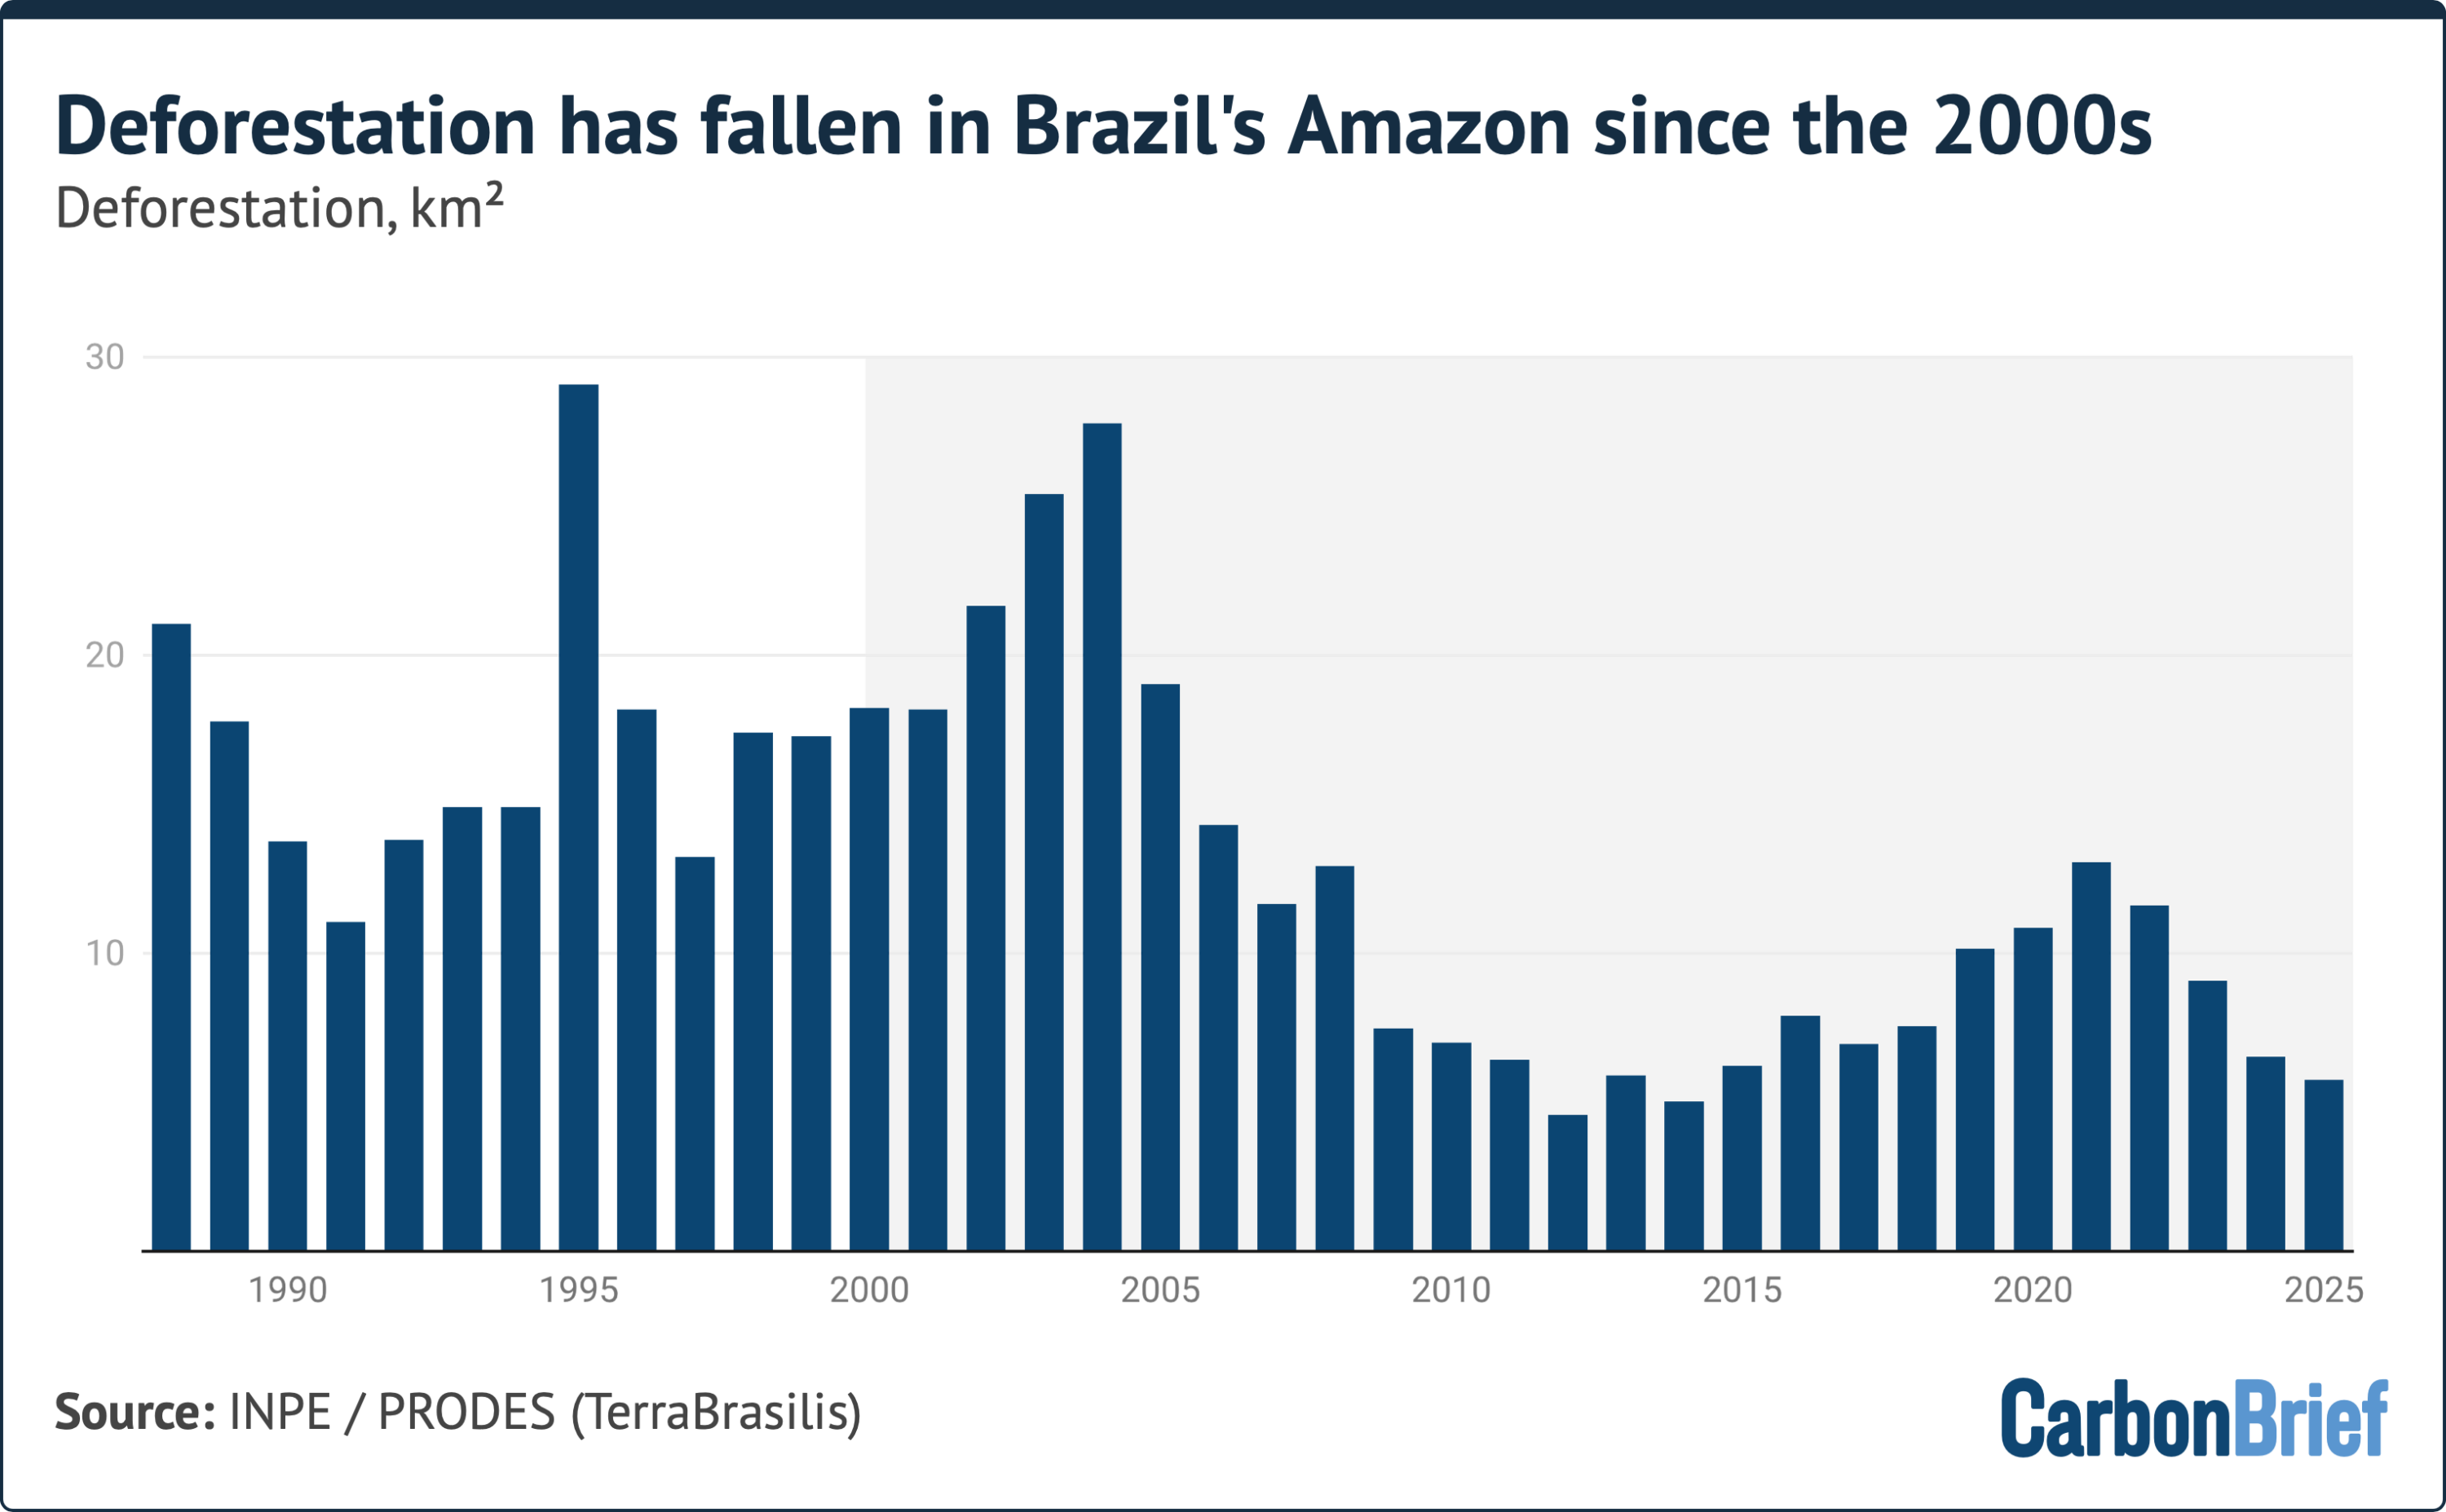
Brazil serves as the primary regional catalyst for the post-2000 drop in land-use emissions. Following a spike in Amazonian deforestation in the late 1990s and early 2000s, Brazil implemented targeted policy interventions, including the 2004 Action Plan for the Prevention and Control of Deforestation in the Legal Amazon (PPCDAm), the 2006 Soy Moratorium, and a widespread expansion of indigenous reserves and protected areas.
While enforcement fluctuated across political administrations—increasing under President Luiz Inácio Lula da Silva and weakening under Jair Bolsonaro—the structural baseline for Amazonian forest clearance remains substantially lower than its historical peak.
Indonesia: Peatland Hydrology and Fire Management
Indonesia represents the single largest contributor to the accelerated decline observed between 2015 and 2024. Following catastrophic fires in 2015 that released massive volumes of carbon from drained peat reserves, Jakarta instituted strict peatland protection policies. Indonesia has rewetted vast areas of degraded peatlands since 2017—exceeding the total area rewetted across Europe’s entire history. Rewetting returns drained, highly flammable organic soils to anoxic, waterlogged states, halting peat oxidation and preventing large-scale land-clearing fires.
China, the United States, and the EU: The Northern Sink Expansion
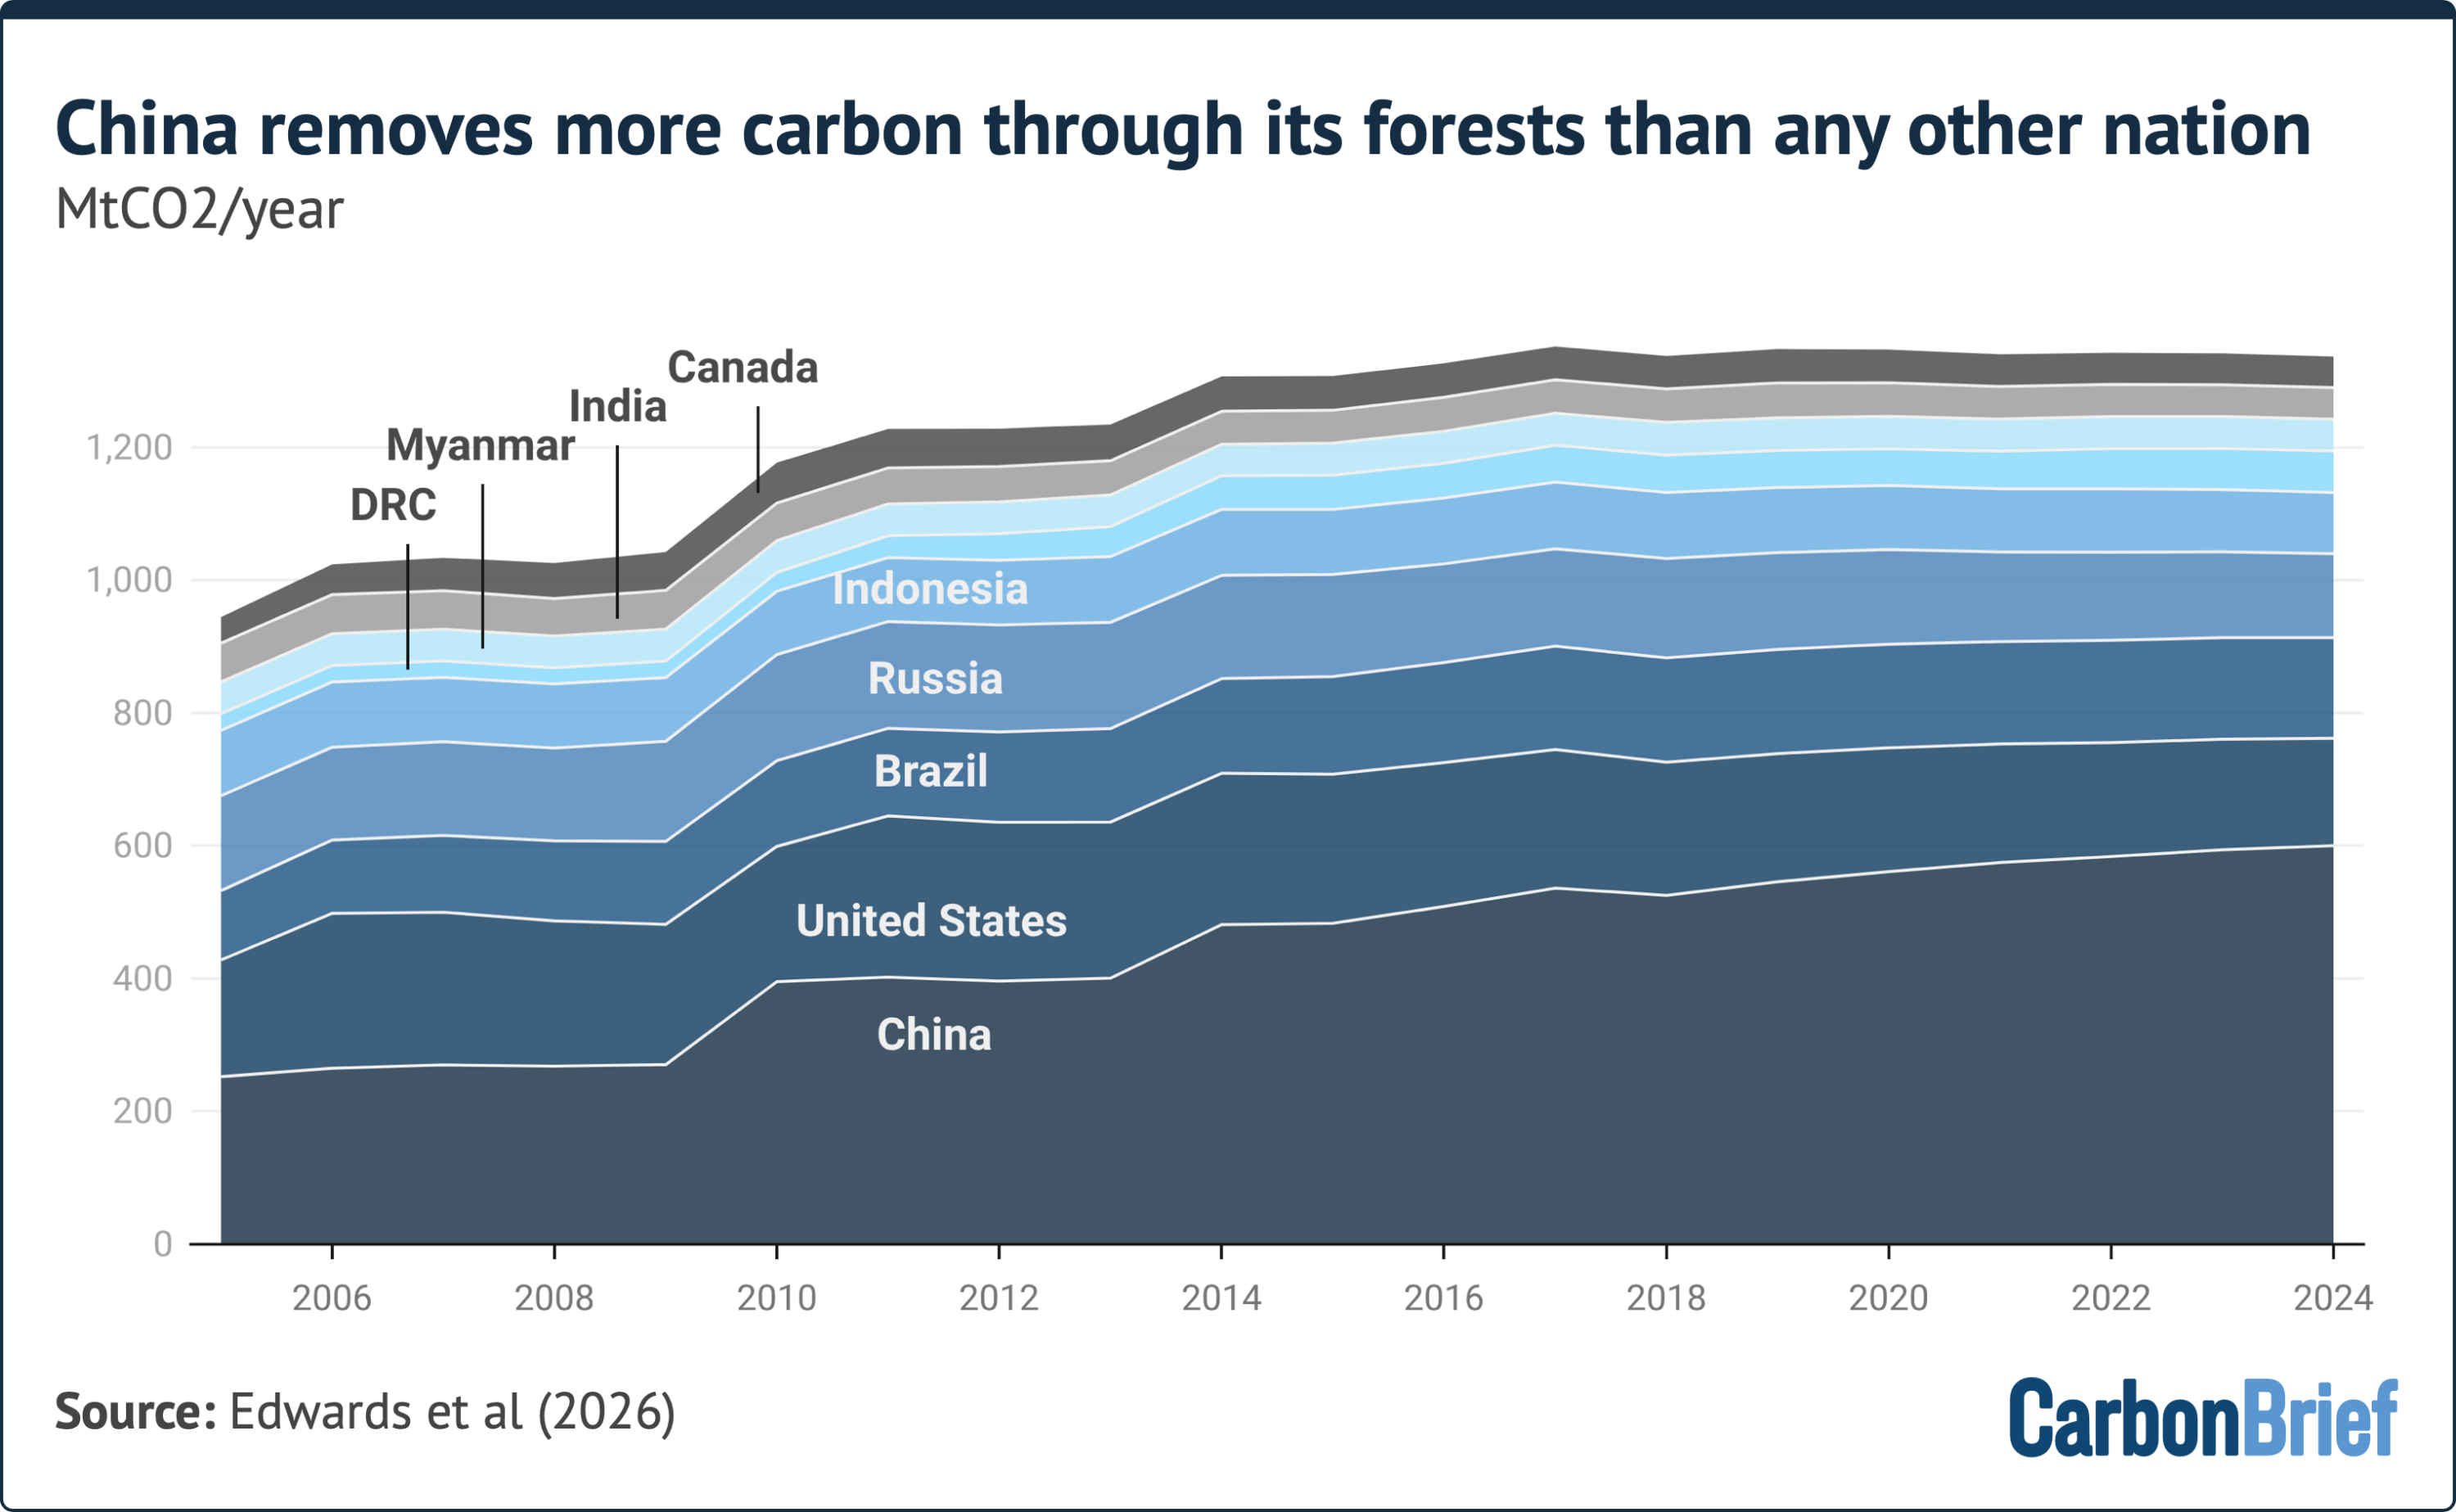
Led by China, major industrial powers have bolstered the global land sink. Driven by massive state-led programs like the Three-North Shelter Forest Project initiated in previous decades, China rehabilitated tens of millions of hectares of degraded soil. Consequently, China’s land base shifted from a net carbon source into one of the world’s largest net carbon sinks, removing hundreds of millions of tonnes of $CO_2$ annually. The United States and the European Union similarly sequestered high volumes of carbon ($1.1 GtCO_2$ per year combined with China over 2015–2024), benefiting from secondary forest regeneration on abandoned 19th- and 20th-century agricultural plots.
The DRC: The Outlier of Increasing Emissions
In contrast to trends in South America and Southeast Asia, land-use emissions in the Democratic Republic of the Congo have remained elevated. Unlike Brazil or Indonesia, where forest clearance is heavily tied to international commodity supply chains (such as soy, cattle, and palm oil), deforestation in the Congo Basin is driven largely by local demographic pressures, charcoal production, and smallholder subsistence farming. As a result, international supply-chain market bans have proven less effective at curbing tree cover loss in the DRC.
Methodological Framework and Model Uncertainty
Quantifying the exchange of carbon between terrestrial ecosystems and the atmosphere is subject to high computational complexity. The Global Carbon Budget determines global land-use flux by integrating and averaging results from three independent bookkeeping models:
BLUE (Bookkeeping of Land-Use Emissions)
OSCAR (Optimized Simple Climate and Carbon Cycle Model)
These models synthesize high-resolution satellite cover datasets, historical agricultural census records, and timber harvest statistics.
Because scientists cannot directly measure whether a specific parcel of forest is absorbing carbon due to anthropogenic management versus natural environmental drivers (such as $CO_2$ fertilization or climate warming), models isolate human activities from background environmental noise.
Due to variations in how these models account for shifting agricultural cycles, wood harvest turnover times, and soil organic carbon decay, the Global Carbon Budget assigns an uncertainty margin of $pm 2.6 GtCO_2$ per year to its 2015–2024 annual average figure of $5.0 GtCO_2$.
Furthermore, because direct country-level statistical reporting lags by several years, estimates for recent years rely partly on high-resolution proxy indicators—such as satellite active-fire detection and real-time tree canopy loss alerts—which carries a lower initial confidence rating until full statistical census processing concludes.
Official Statements
Leading carbon cycle scientists involved with the Global Carbon Budget project emphasize both the historical significance of the trend and the conditional nature of future projections.
Prof. Pierre Friedlingstein, Chair in Mathematical Modelling of Climate Systems at the University of Exeter and lead author of the Global Carbon Budget, noted that while long-term metrics are trending favorably, future land-use trajectories remain dependent on political stability:
"There is no indication of what might happen in the future, but land-use emission trends over the 21st century are going in the right direction. If you are optimistic, you hope the trend will not reverse and start increasing again. But we don’t know for sure. The assumption, given current land policies across the world, is that deforestation should continue to decline."
Reflecting on the geopolitical dynamics that dictated South America’s carbon trajectory, Friedlingstein added:
"The decline in land-use emissions since the 2000s was primarily driven by a decline in deforestation in Brazil… There was a bit of up and down—mainly due to politics and who was in charge in Brazil… But the long-term trend in Brazil is a decline in deforestation due to forest protection policies."
Prof. Julia Pongratz, Chair of Physical Geography and Land Use Systems at the University of Munich (LMU) and co-developer of the LUCE bookkeeping model, highlighted Indonesia’s structural contributions to the post-2015 emission drop:
"The largest contributor to an acceleration in the decline of global land-use emissions in the past decade has been Indonesia, which has rewetted more peatland area since 2017 alone than Europe in its entire history."
Addressing the divergence between export-driven deforestation and poverty-driven land clearance in Central Africa, Pongratz observed:
"Emissions in the DRC have increased, then stayed high in the last two decades. This is partly related to population growth and expanding smallholder and subsistence farming. The picture is different in Brazil and Indonesia, which are much more driven by export; international regulations aiming at curbing deforestation thus have larger effects in these countries."
Future Outlook & Strategic Imperatives
The quarter-century decline in land-use emissions demonstrates that deliberate environmental policy, supply-chain monitoring, and targeted ecosystem restoration can curtail anthropogenic emissions at a global scale. However, climate researchers and energy analysts emphasize that land-use improvements alone cannot solve the climate crisis while industrial energy systems continue to emit carbon at record levels.
                  THE GLOBAL CARBON BUDGET IMBALANCE
  ===================================================================
  [!] FOSSIL FUEL EMISSIONS (38.1 GtCO2/yr)
  =================================================================== >>> CONTINUING TO RISE

  [✓] NET LAND-USE EMISSIONS (4.1 GtCO2/yr)
  ==================== >>> FALLING (32% DROP SINCE 2000s)
Several critical risk factors could reverse or undermine these hard-won land-use gains:
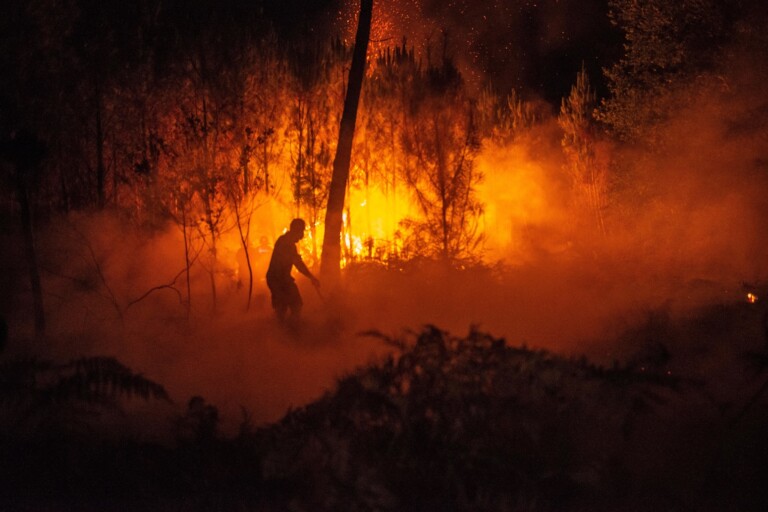
Climate-Driven Ecosystem Vulnerability: Rising global temperatures, prolonged tropical droughts, and intensifying wildfire regimes threaten to transform protected standing forests from carbon sinks into carbon sources. The buffering capacity of natural sinks is highly vulnerable to extreme warming events.
Political Inconsistency: Land-use policies are vulnerable to domestic political changes. Reversals in forest protection laws or enforcement funding in key rainforest nations could quickly offset years of reduced emissions.
The Fossil Fuel Disconnect: The reduction in land-use emissions to $4.1 GtCO_2$ per year is outweighed by fossil fuel and cement emissions reaching a record $38.1 GtCO_2$. The land sink cannot compensate indefinitely for unmitigated industrial carbon output.
To lock in long-term reductions in land-use emissions, international climate negotiations are increasingly turning toward structural financing mechanisms. At the UN Climate Change Conferences, proposals such as Brazil’s "Tropical Forest Forever" fund aim to provide sovereign financial incentives for developing nations to preserve standing tropical forests, shifting local economic incentives away from land clearance.
Ultimately, while the terrestrial biosphere’s carbon trajectory represents a major success for global environmental policy over the past 25 years, scientists stress that it must be matched by a rapid decarbonization of the global energy grid. Without steep reductions in fossil fuel combustion, the gains achieved through forest conservation and peatland restoration risk being overwhelmed by the broader impacts of climate change.