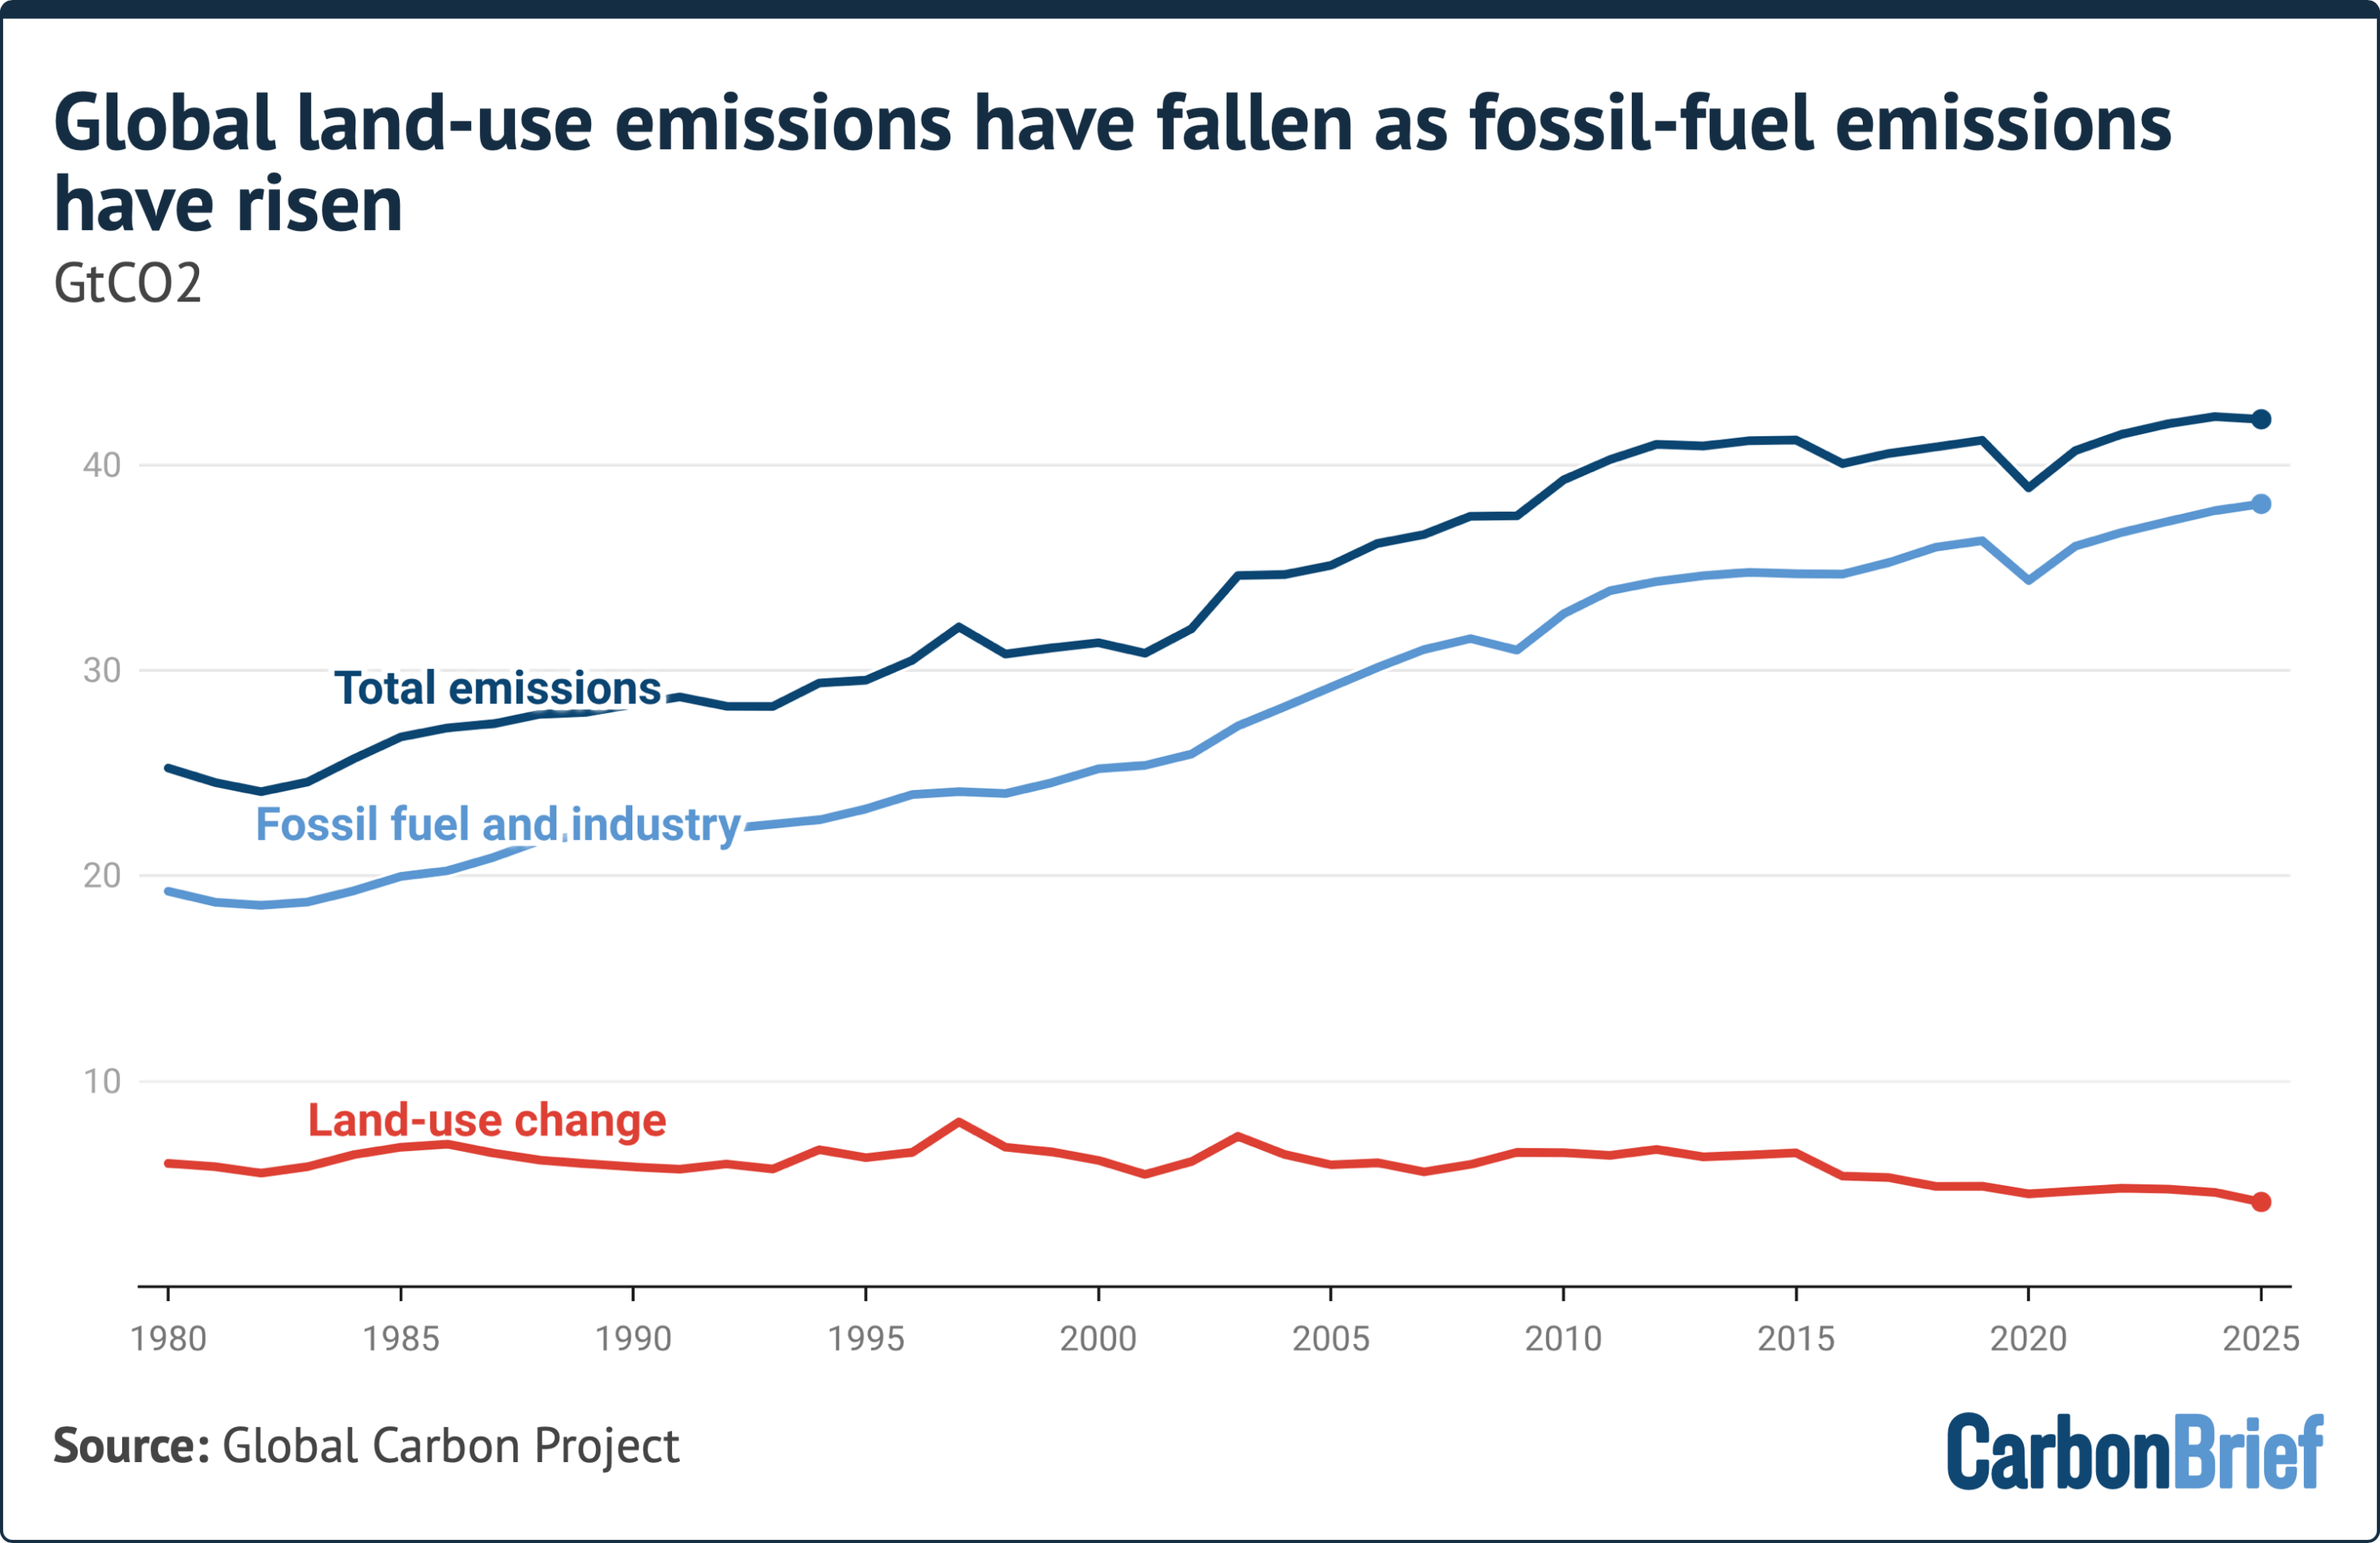
While global carbon emissions from fossil fuels and cement production continue their upward trajectory—reaching an all-time high of 38.1 billion tonnes of carbon dioxide ($textGtCO_2$) in 2025—a structural shift is unfolding in the biosphere. According to data formally published in Earth System Science Data by the Global Carbon Budget, greenhouse gas emissions derived from land-use, land-use change, and forestry (LULUCF) have experienced a sustained drop over the first quarter of the 21st century.
Preliminary figures indicate that net land-use emissions fell to approximately $4.1text GtCO_2$ in 2025. This represents a 32% drop compared to the annual average recorded during the 2000s, building upon an accelerating decline that gathered momentum after 2015. Over the 2015–2024 decade, annual land-use emissions averaged $5.0text GtCO_2$—down 23% from 1995–2004 averages and 19% lower than the 2005–2014 period.
Significant reductions in permanent tropical deforestation, most notably in Brazil;
Unprecedented peatland restoration and rewetting initiatives in Indonesia; and
Massive state-sponsored afforestation and reforestation projects across China, the United States, and the European Union.
However, this systemic downshift is accompanied by critical caveats. The Global Carbon Budget highlights an inherent analytical uncertainty range of $pm 2.6text GtCO_2$ per year for land-use figures—representing more than 50% of the net annual total. Furthermore, regional counter-trends, such as persistent forest loss in the Democratic Republic of the Congo (DRC), alongside climate-induced feedback risks, underscore the fragility of these gains.
Detailed Chronology
1. The Era of Stasis (1960–1999)
For nearly four decades following the mid-20th century, net global emissions from land-use change remained constant. Between 1960 and 1999, annual LULUCF emissions hovered around $6.6text GtCO_2$. During this era, rapid agricultural expansion, commercial logging, and tropical deforestation across South America, Southeast Asia, and Sub-Saharan Africa offset the natural carbon sequestration provided by temperate forest recovery in the Northern Hemisphere. In contrast, fossil fuel emissions during this same period expanded rapidly, rising from an average of $11text GtCO_2$ per year in the 1960s to over $24text GtCO_2$ by the late 1990s.
The late 1990s marked a departure from historical baselines. Driven by shifting international supply chains, remote-sensing monitoring, and domestic environmental governance, global land-use emissions began a statistically significant decline.
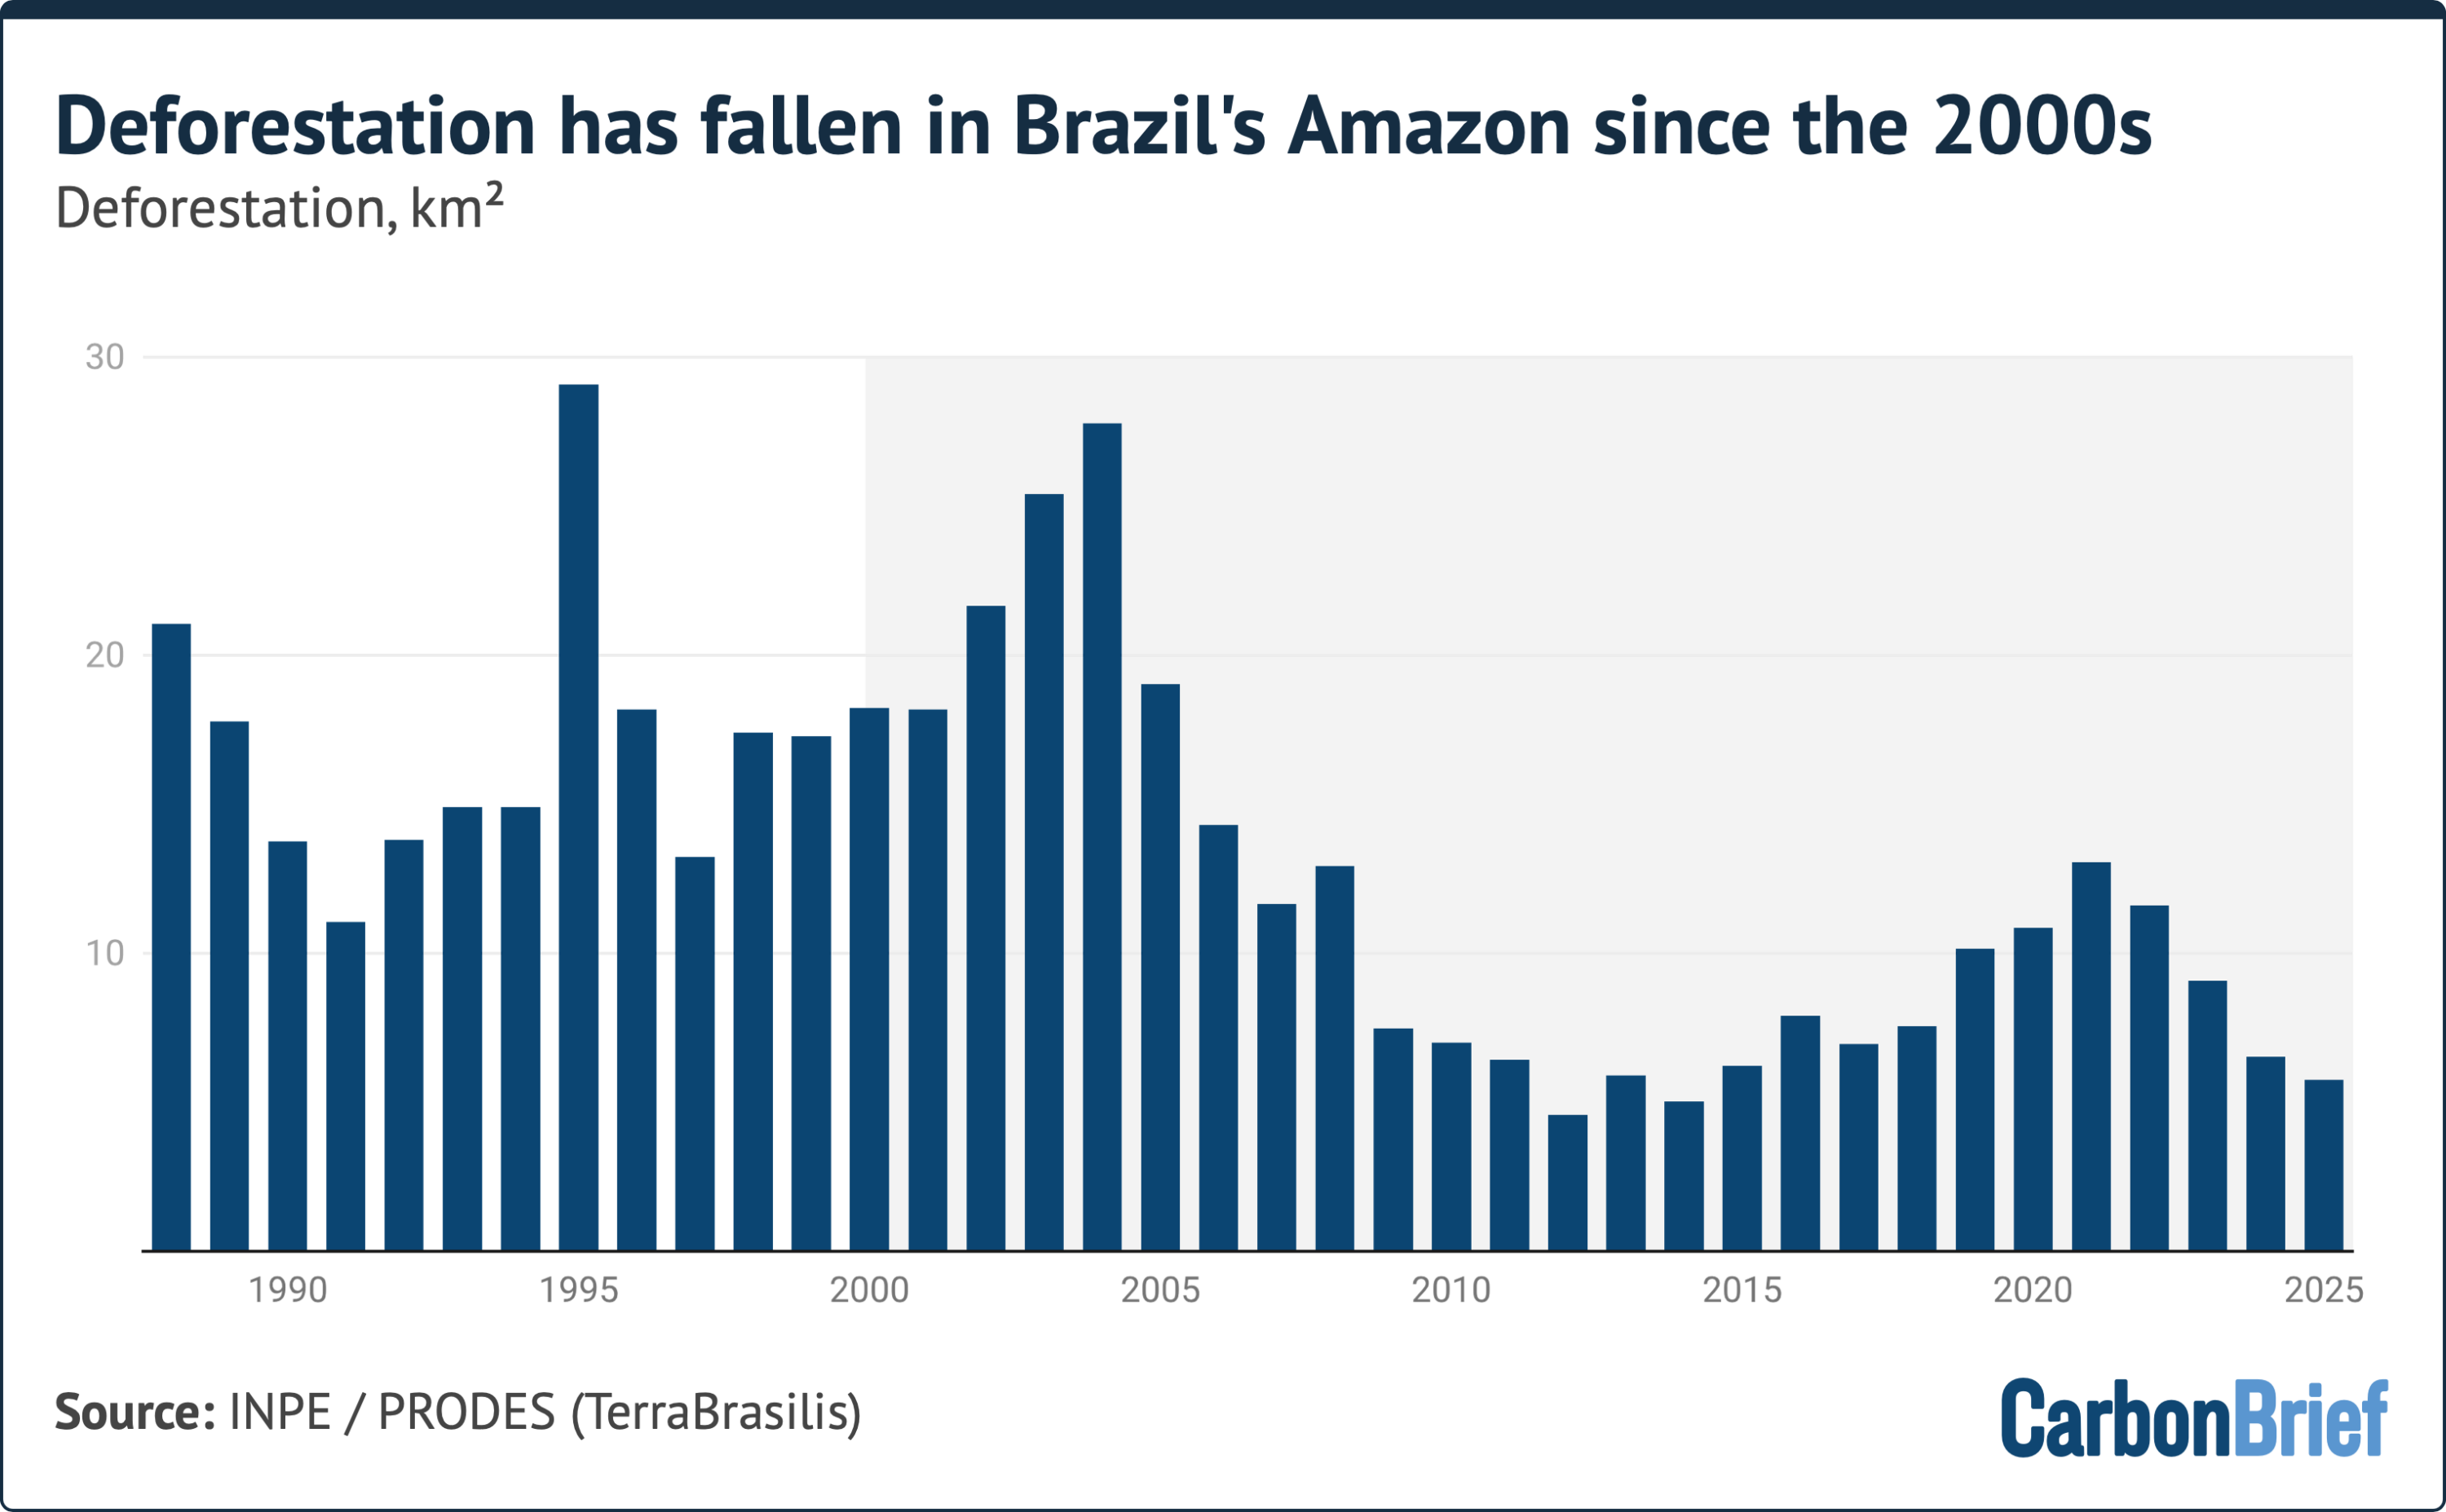
In Brazil, the implementation of the Action Plan for the Prevention and Control of Deforestation in the Legal Amazon (PPCDAm) in 2004, combined with the 2006 Soy Moratorium and an expansion of indigenous protected territories, curtailed tree cover loss in the Amazon basin. Over the 1995–2004 period, global land-use emissions averaged $6.5text GtCO_2$ annually, dropping to $6.2text GtCO_2$ over 2005–2014.
3. Accelerated Downward Trajectory (2015–2025)
The reduction in LULUCF emissions accelerated following a peak in tropical peatland fires during the 2015 El Niño event. Between 2015 and 2024, annual net land-use emissions averaged $5.0text GtCO_2$.
By 2025, preliminary modeling suggests net land-use emissions dropped further to $4.1text GtCO_2$. This drop was aided by the dissipation of El Niño weather patterns—which typically exacerbate dry conditions and uncontrolled burning in tropical peatlands—alongside sustained forest growth and falling permanent deforestation rates globally.
Supporting Context & Metrics
Dissecting the Carbon Fluxes: Deforestation vs. Sequestration
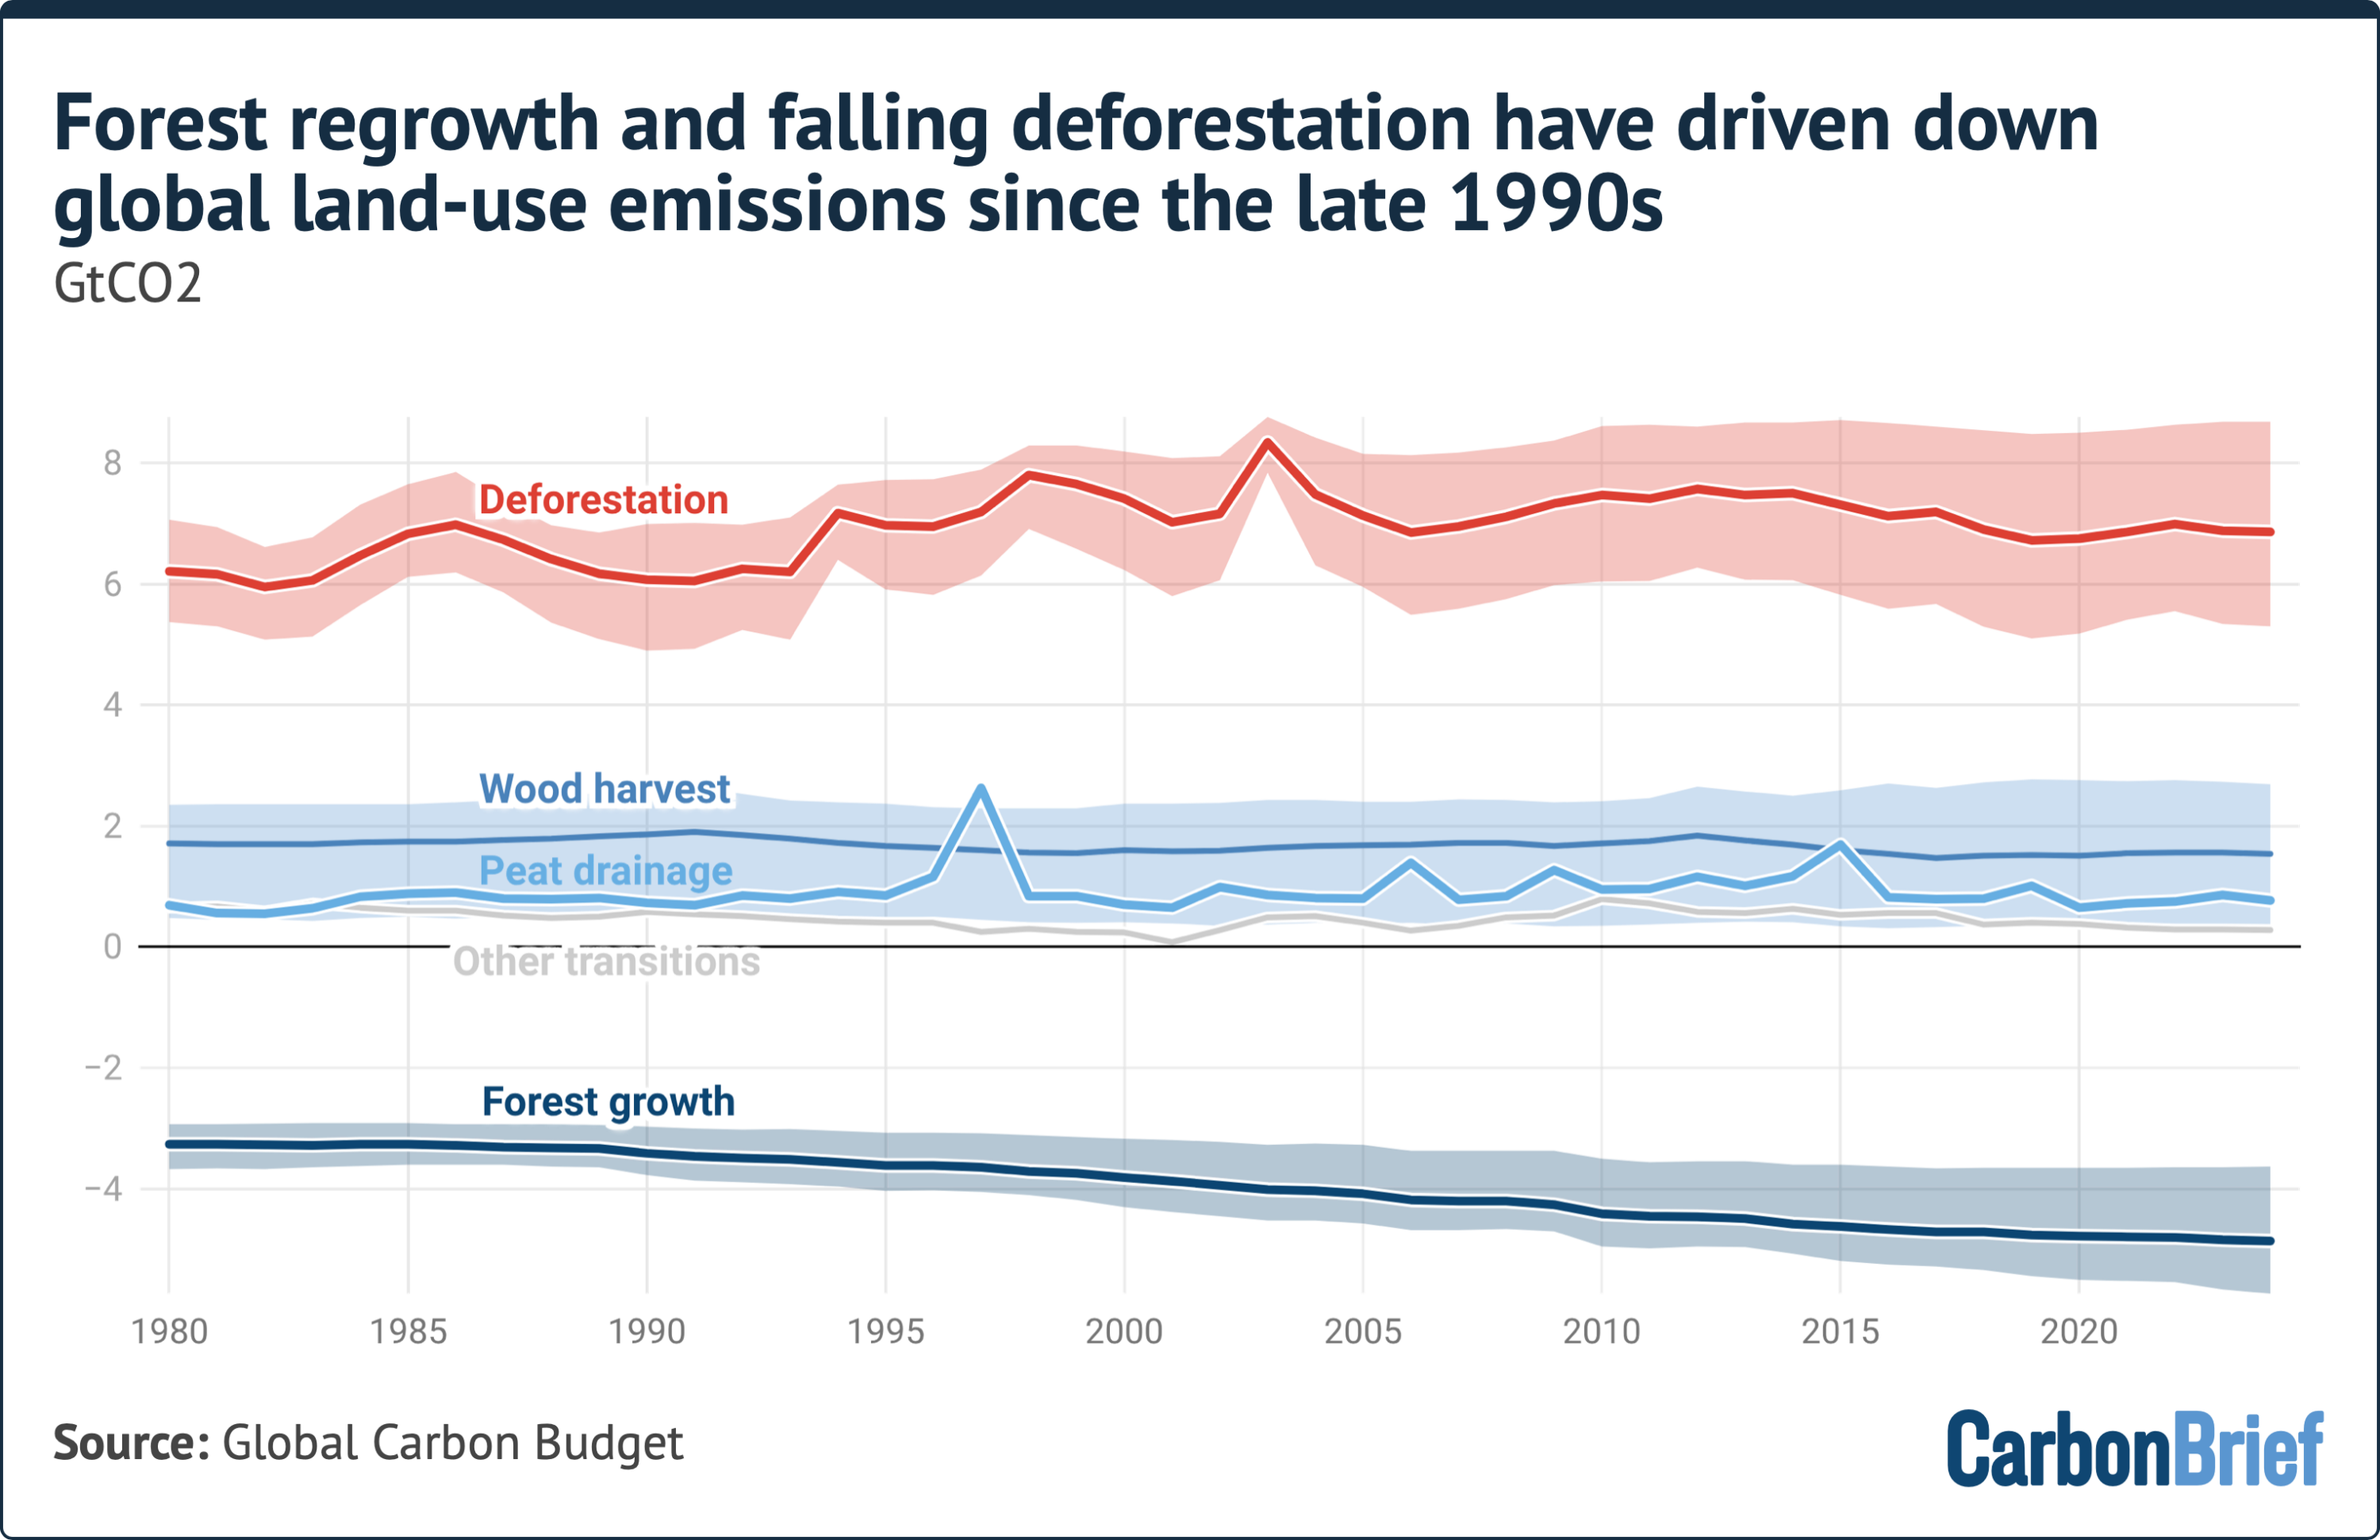
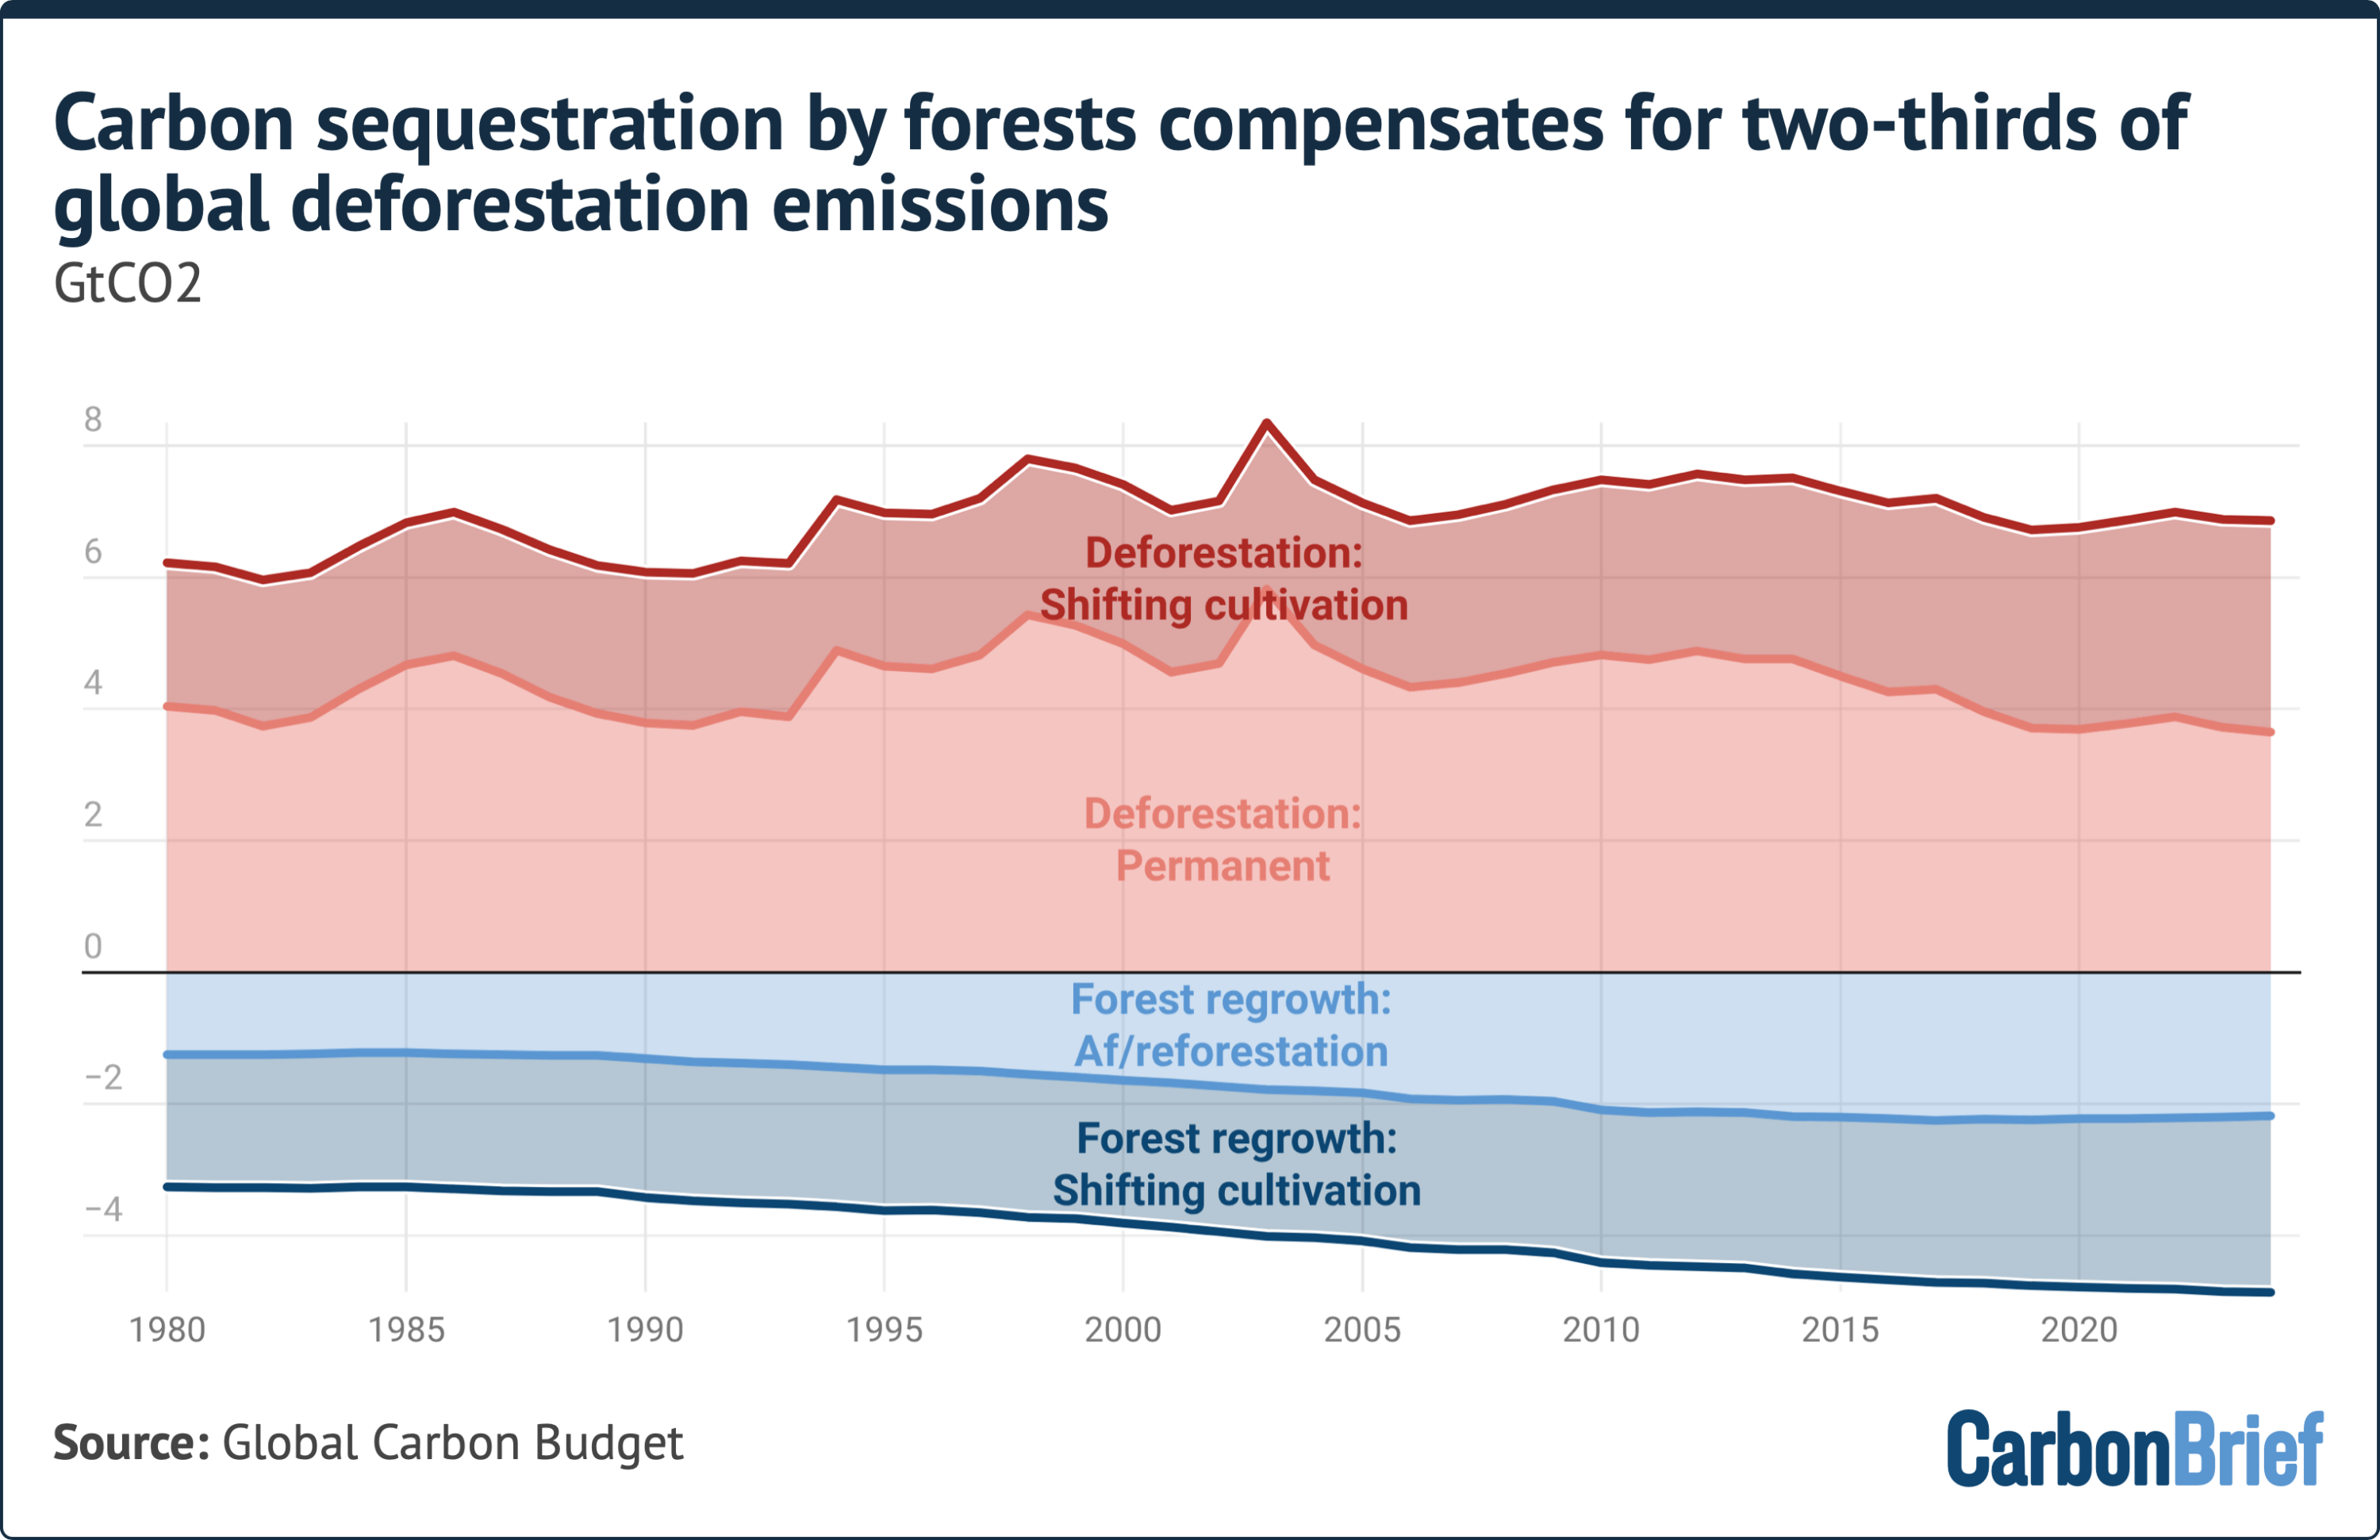
Calculating net land-use emissions requires balancing gross carbon releases against gross carbon sinks. The downward trend in net emissions reflects both reduced gross land clearing and increased sequestration from managed forest recovery.
Gross Deforestation Emissions: Between 2015 and 2024, deforestation released an average of $6.96text GtCO_2$ per year. This category is dominated by permanent deforestation—the irreversible conversion of forest ecosystems to agricultural land, infrastructure, or urban settlements—alongside temporary clearance cycles.
Gross Forest Sequestration: Over the same timeframe, forest growth sequestered $4.76text GtCO_2$ per year, counterbalancing roughly two-thirds (68%) of gross deforestation emissions.
Afforestation & Reforestation: Direct human interventions, including commercial forestry and national tree-planting initiatives, accounted for $2.20text GtCO_2$ of annual removals.
Secondary Regrowth: Forest recovery within rotational agriculture and shifting cultivation cycles drawn down an additional $2.56text GtCO_2$ annually.
Geographic Disparities: Successes vs. Vulnerabilities
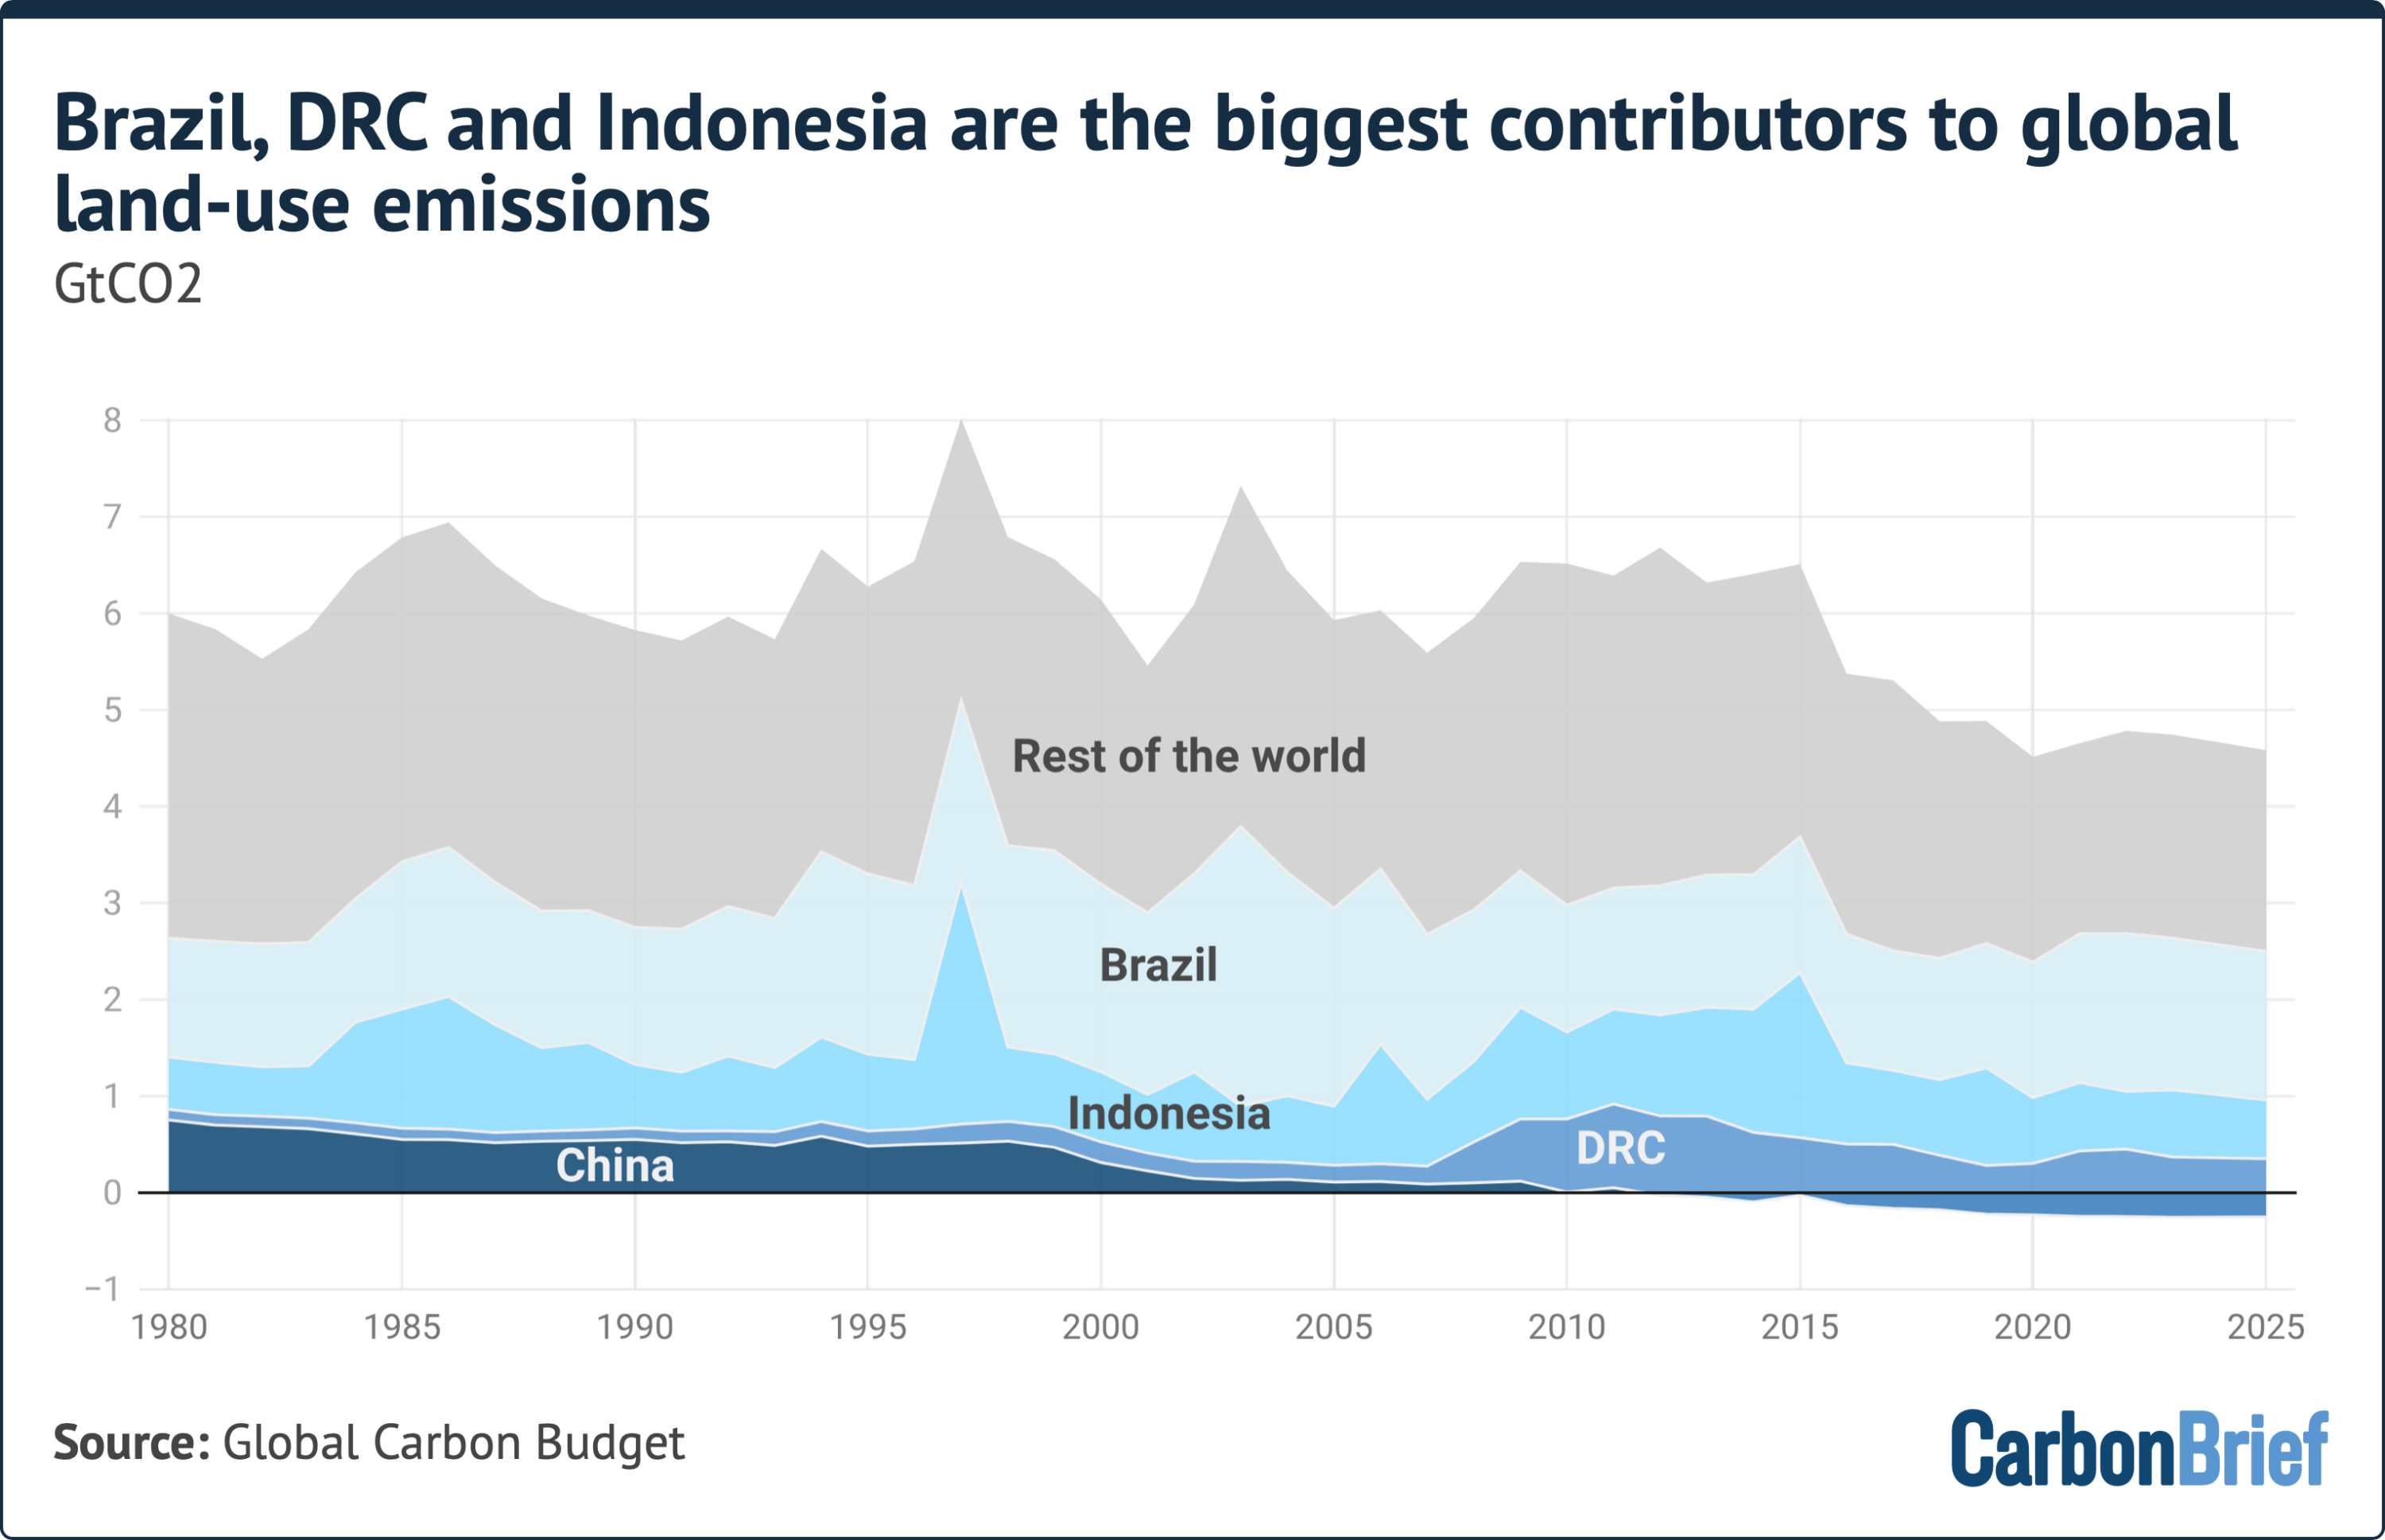
The global reduction in LULUCF emissions is geographically concentrated. Between 2015 and 2024, just three tropical nations—Brazil, the Democratic Republic of the Congo (DRC), and Indonesia—accounted for 57% of all global land-use emissions.
       LAND-USE EMISSIONS & REMOVALS BY KEY REGION (2015–2024)
  ┌───────────────────────────────────────────────────────────────┐
  │ Brazil     ████████████████─────────── (Declining overall)    │
  │ Indonesia  █████████────────────────── (Declining post-2017) │
  │ DRC        ████████████─────────────── (Increasing/High)     │
  │ China      ▓▓▓▓▓▓▓▓▓▓───────────────── (Net Sink / -CDR)     │
  │ US & EU    ▓▓▓▓▓▓▓▓─────────────────── (Net Sink / -CDR)     │
  └───────────────────────────────────────────────────────────────┘
  Key: ██ Gross Emitter  ▓▓ Net Carbon Removal (Sequestration)
Brazil: Policy-Driven Decline
Brazil has historically served as the single largest regional source of LULUCF emissions. However, long-term trends show a decline from peak 2000s deforestation levels. While deforestation rates fluctuate based on domestic political leadership—slowing under President Luiz Inácio Lula da Silva and surging under former President Jair Bolsonaro—enforcement of land-use regulations, real-time satellite tracking, and supply-chain restrictions have pushed Brazilian emissions downward over a multi-decade horizon.
Indonesia: Peatland Rewetting Transformation
Indonesia’s trajectory shifted after catastrophic peat fires in 2015 released massive carbon volumes. In response, Jakarta established dedicated peatland restoration authorities. Since 2017, Indonesia has rewetted a larger area of degraded peatlands than Europe has restored throughout its history. Restoring natural water table levels prevents organic peat decomposition and drastically reduces the incidence of runaway drainage fires, accelerating the global drop in land-use emissions over the past decade.
China, the US, and the EU: The Northern Sink
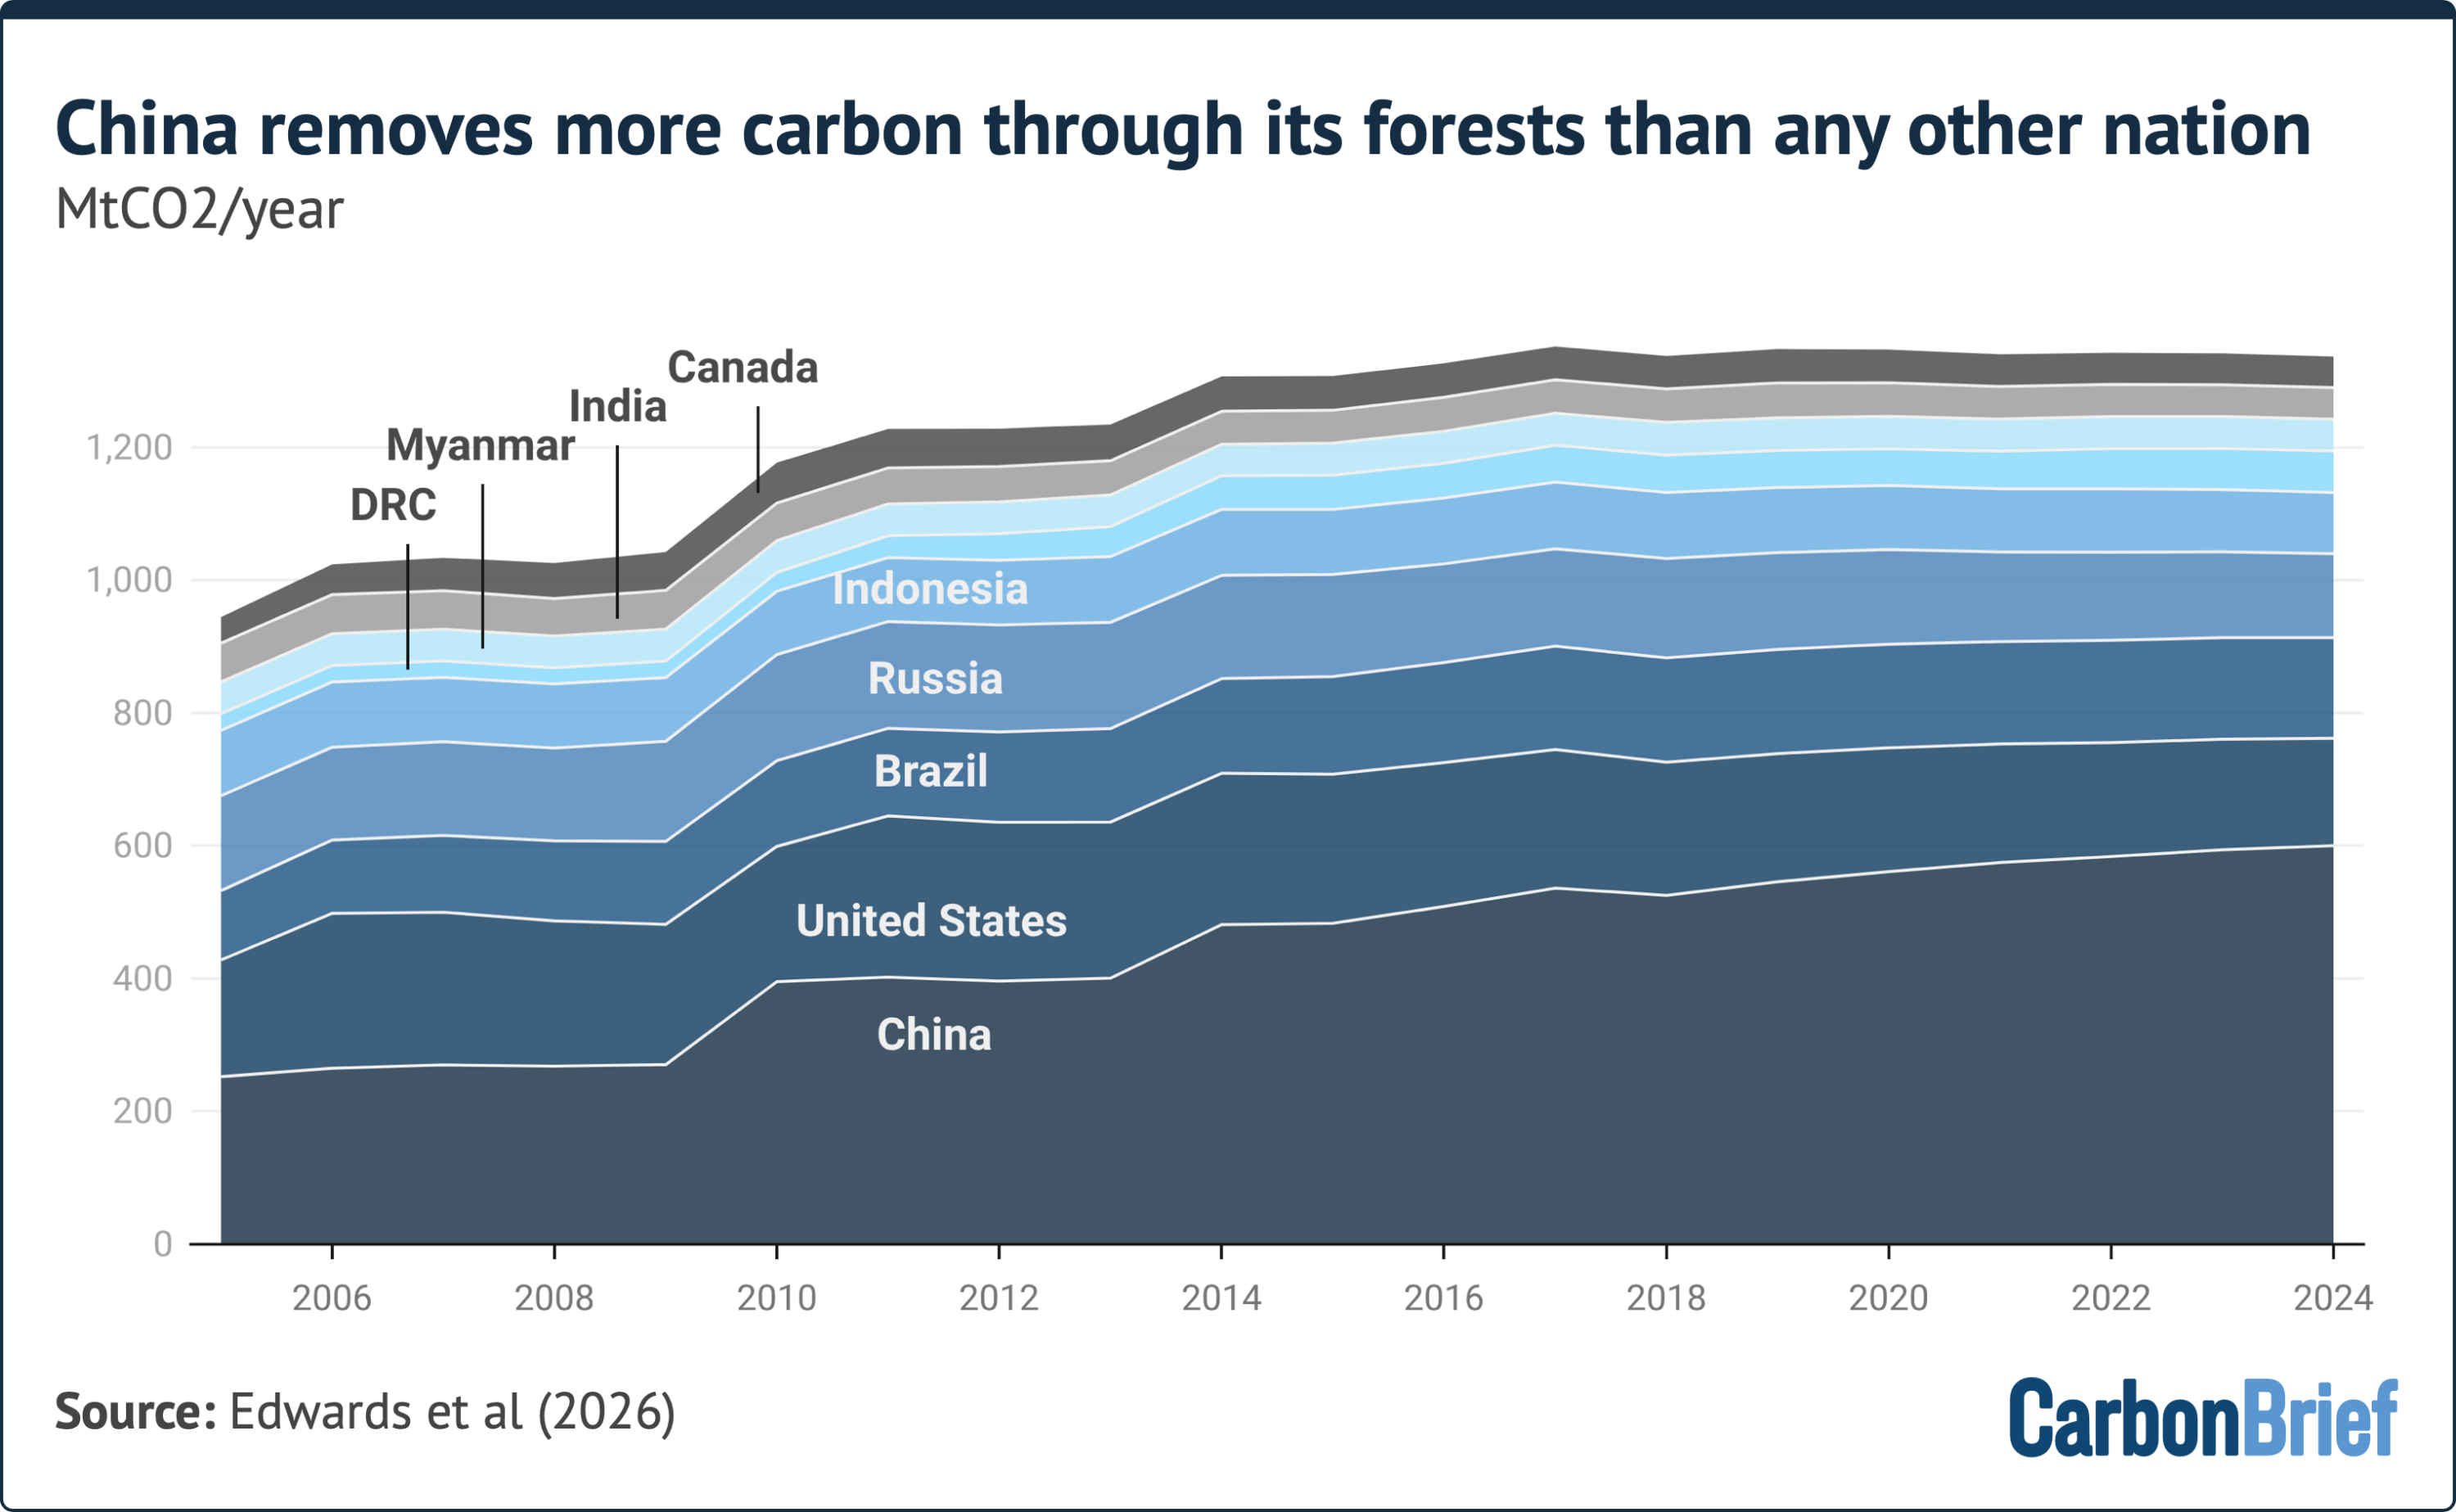
Carbon dioxide removal (CDR) through forest expansion is heavily concentrated in Northern Hemisphere economies. China, the US, and the European Union collectively sequestered $1.1text GtCO_2$ per year through afforestation and forest management between 2015 and 2024. China’s extensive ecological engineering programs—such as the Three-North Shelter Forest Program launched in late 20th century—rehabilitated tens of millions of hectares, transitioning the country’s landscape from a net carbon source into a significant terrestrial sink.
The DRC Exception
In contrast to Brazil and Indonesia, land-use emissions in the Democratic Republic of the Congo have risen and remained high over the past two decades. Driven by population growth, fuel dependency, and subsistence agriculture, forest clearing in the Congo Basin operates independently of international commodity supply chains. Consequently, Western trade mandates and corporate zero-deforestation commitments have demonstrated limited efficacy in altering the DRC’s emission trends.
Scientific Modeling & Quantifying Uncertainty
Quantifying net carbon exchanges across the world’s land surface involves technical challenges. The Global Carbon Budget relies on an ensemble average derived from three bookkeeping models: BLUE (Bookkeeping of Land-Use Emissions), OSCAR (One-Step Carbon Cycle Climate Model), and LUCE (Land Use Change Emissions).
                      BOOKKEEPING MODEL ENSEMBLE
              ┌────────────────────────────────────────┐
              │          Global Carbon Budget          │
              └───────────────────┬────────────────────┘
                                  │
         ┌────────────────────────┼────────────────────────┐
         ▼                        ▼                        ▼
  ┌─────────────┐          ┌─────────────┐          ┌─────────────┐
  │ BLUE Model  │          │ OSCAR Model │          │ LUCE Model  │
  └─────────────┘          └─────────────┘          └─────────────┘
         │                        │                        │
         └────────────────────────┼────────────────────────┘
                                  ▼
               Average Annual LULUCF: 5.0 GtCO2/yr
               Uncertainty Margin:    ±2.6 GtCO2/yr
Direct atmospheric sensors can measure net $textCO_2$ concentration changes, but cannot inherently separate human-driven land management from natural ecosystem fluxes (e.g., climate-induced drought or spontaneous wildfire). Bookkeeping models isolate human activities by integrating satellite imagery with national forestry statistics.
Model uncertainties arise from several sources:
Discrepancies in Shifting Cultivation: Models differ in how they calculate carbon release and recovery cycles during short-term agricultural rotation.
Time Asymmetry: Deforestation releases carbon almost instantaneously via fire and biomass decomposition, whereas forest regrowth sequesters carbon slowly over decades.
Data Latency: Comprehensive empirical land-use statistics typically lag by two to three years. Consequently, figures for recent years (such as 2024 and 2025) rely on short-term proxies, tropical fire activity monitoring, and satellite deforestation alerts, yielding lower confidence levels.
Official Statements
Addressing the findings of the Global Carbon Budget, leading climate scientists emphasize both the significance of the 21st-century trajectory and the uncertainties surrounding its future continuation.
Prof. Pierre Friedlingstein, Director of the Global Carbon Budget Office and Chair in Mathematical Modelling of Climate Systems at the University of Exeter, noted the long-term trend while urging caution regarding future predictions:
"The long-term trend in Brazil is a decline in deforestation due to forest protection policies… If you are optimistic, you hope the trend will not reverse and start increasing again. But we don’t know for sure. The assumption, given current land policies across the world, is that deforestation should continue to decline."
Prof. Julia Pongratz, Chair of Physical Geography and Land Use Systems at the University of Munich and contributor to the LUCE model, highlighted the distinct operational mechanisms separating Southeast Asia, South America, and Central Africa:
"Brazil is the single most important contributor to the early-2000s global land-use change emissions peak and subsequent decline… Indonesia has rewetted more peatland area since 2017 alone than Europe in its entire history.
Emissions in the DRC have increased, then stayed high in the last two decades. This is partly related to population growth and expanding smallholder and subsistence farming. The picture is different in Brazil and Indonesia, which are much more driven by export; international regulations aiming at curbing deforestation thus have larger effects in these countries."
Writing in an analytical review, climate scientists Dr. Zeke Hausfather and Prof. Pierre Friedlingstein placed the land-use figures in context against broader decarbonization efforts, noting that by 2025:
"Land-use emissions had decreased by around 32% compared to their average in the 2000s."
Future Outlook
The sustained downturn in land-use emissions offers a structural win for climate mitigation, showing that targeted policy frameworks, market-driven supply chain interventions, and ecological restoration can alter global emission trajectories. However, maintaining this trend poses distinct geopolitical and environmental challenges.
                  FUTURE EMISSION DRIVERS & RISKS
  ┌─────────────────────────────────┬─────────────────────────────────┐
  │        OPPORTUNITIES            │             RISKS               │
  ├─────────────────────────────────┼─────────────────────────────────┤
  │ • Tropical Forest Forever Fund  │ • Climate Feedbacks & Drought   │
  │ • EU Deforestation Rules (EUDR) │ • Reversals in Political Will   │
  │ • Expanding Peat Rewetting      │ • DRC Subsistence Clearance     │
  └─────────────────────────────────┴─────────────────────────────────┘
Policy and Financial Instruments
International climate diplomacy is increasingly turning toward direct economic incentives to keep tropical forests intact. Initiatives such as Brazil’s proposed "Tropical Forest Forever Fund" (TFFF)—targeted for momentum around international climate summits—seek to provide sovereign compensation for verified forest conservation.
Concurrently, trade policies are tightening. Regulations like the European Union Deforestation Regulation (EUDR) aim to block commodities linked to post-2020 forest clearance from high-income markets, exerting demand-side pressure on commercial producers in South America and Southeast Asia.
Climate Feedbacks and Reversal Vulnerabilities
The long-term permanence of land carbon sinks remains vulnerable to escalating climate impacts. Rising global mean temperatures increase the frequency and severity of tropical droughts, forest dieback, and wildland fires.
As demonstrated during strong El Niño cycles, acute heat and prolonged dry spells can temporarily turn managed carbon sinks into major carbon sources by drying out standing vegetation and peat beds.
While the reduction in land-use emissions down to $4.1text GtCO_2$ helps temper net atmospheric carbon accumulation, experts emphasize that land sink optimization cannot offset continued fossil fuel growth. Achieving global climate stabilization goals will require maintaining the downward trajectory of land-use emissions while simultaneously achieving rapid reductions in fossil fuel combustion.