Executive Overview
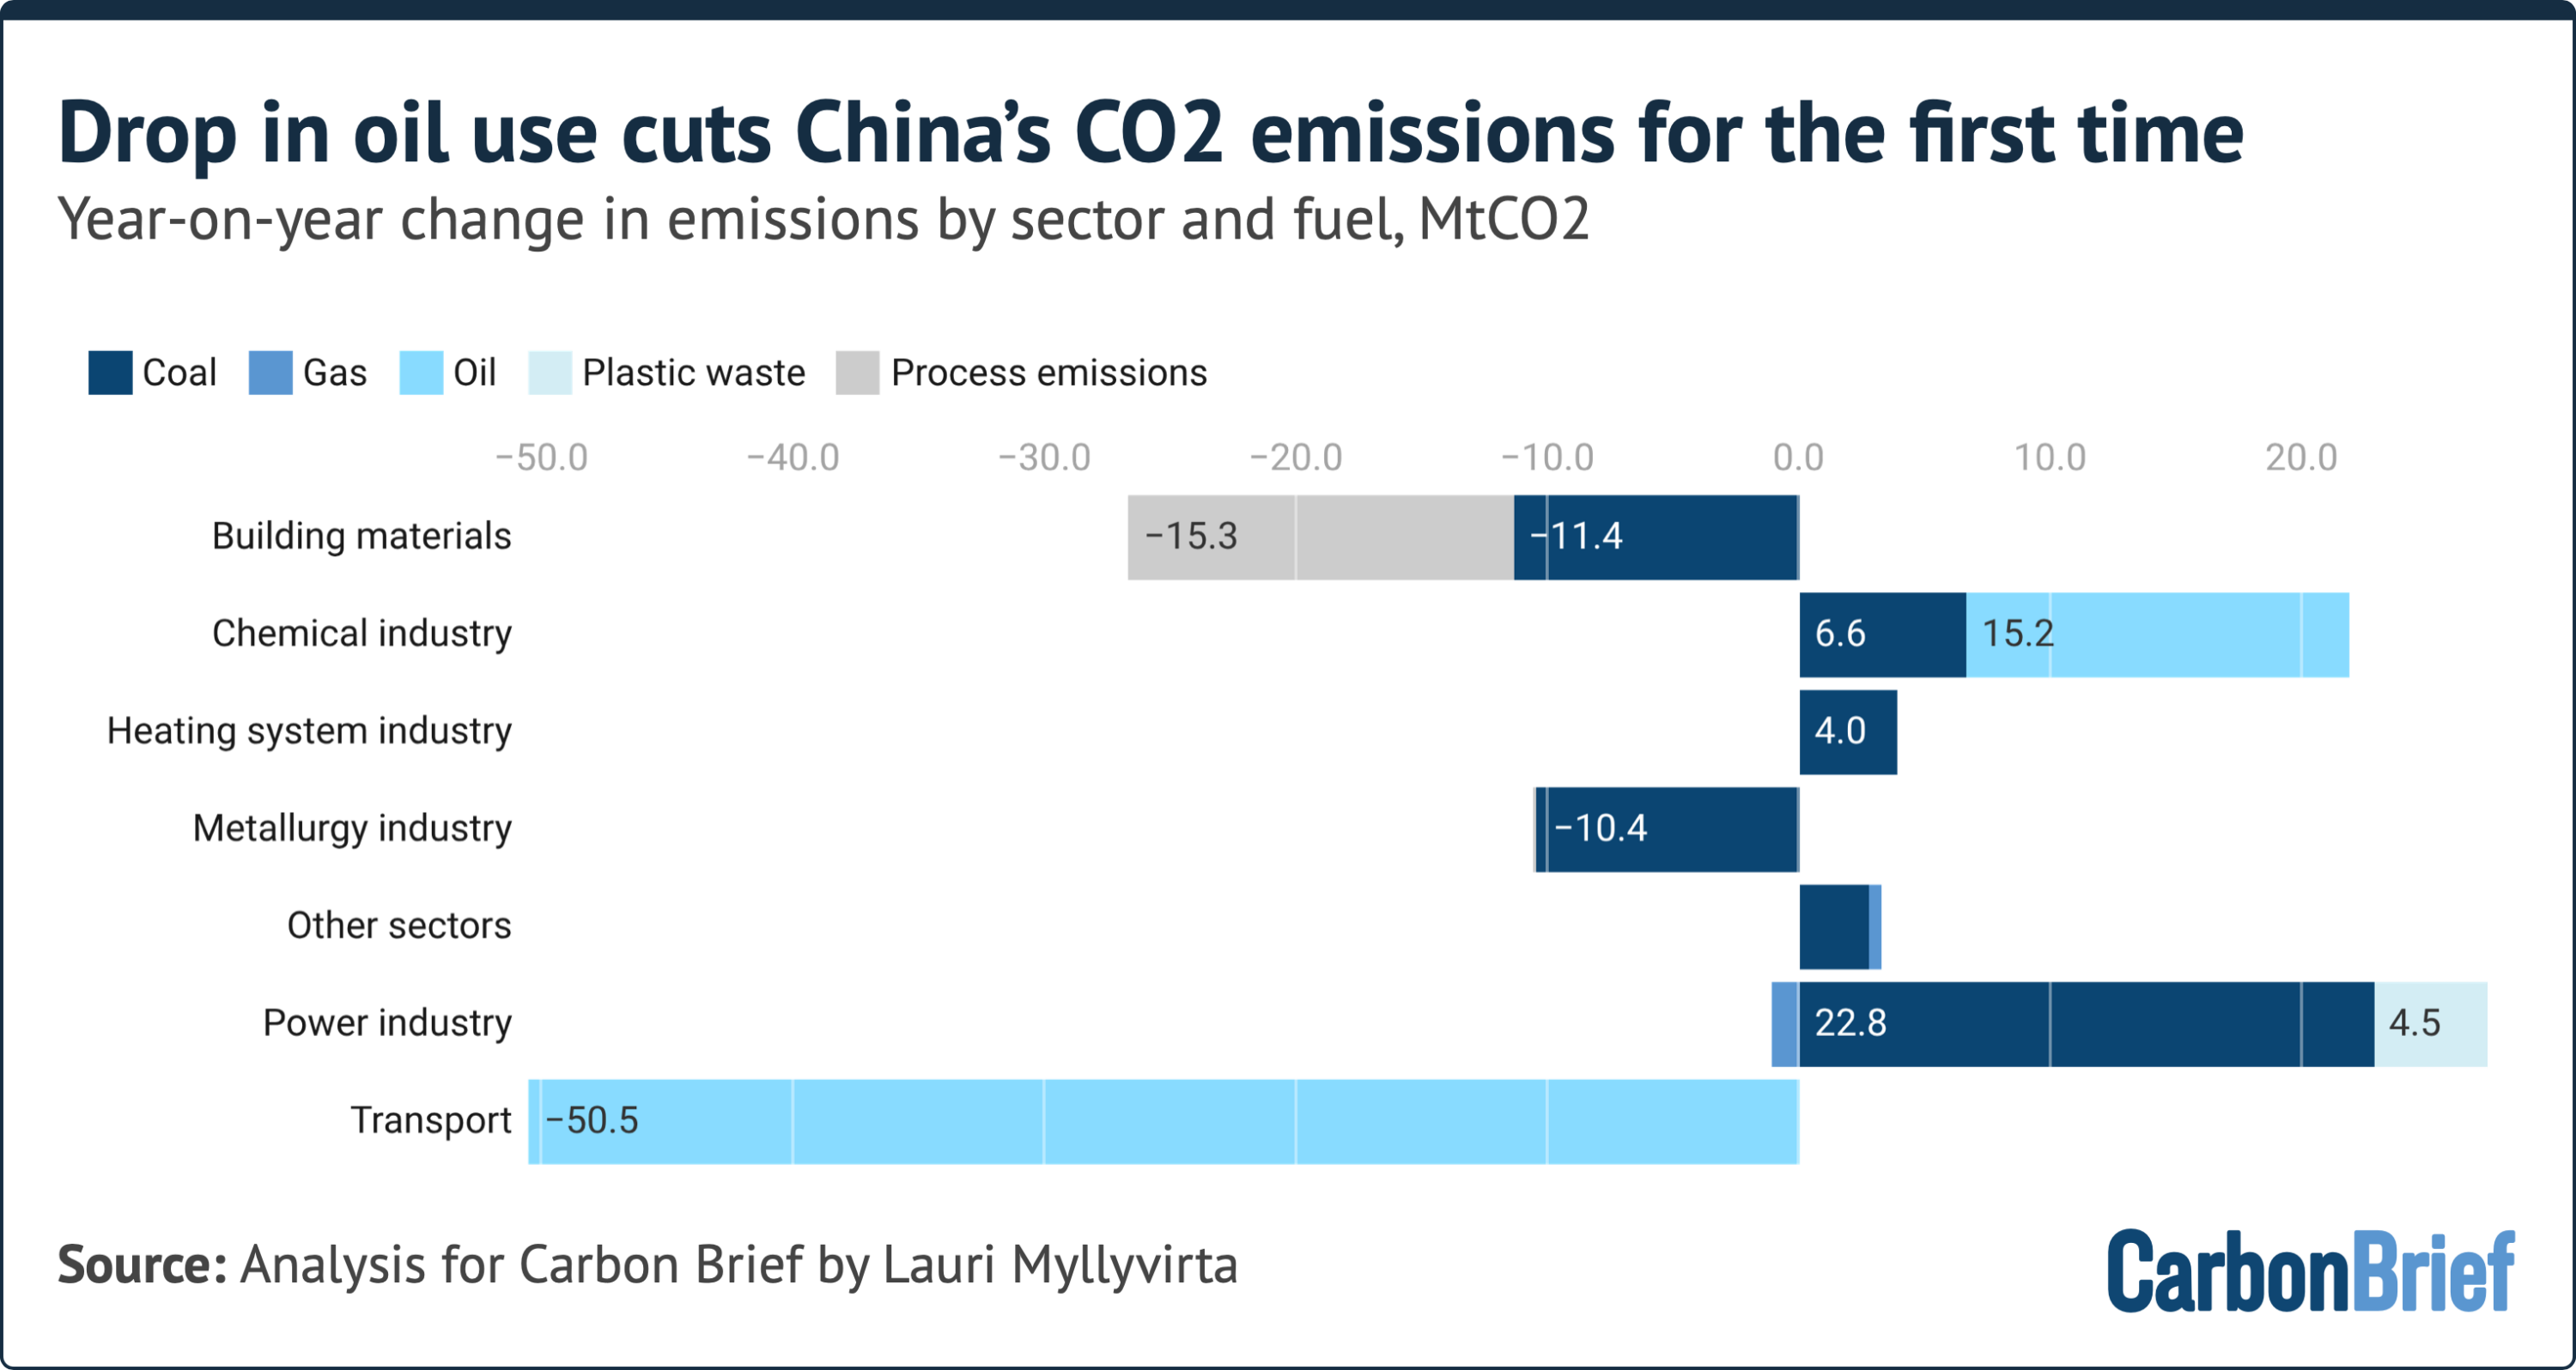
In an unprecedented shift for the world’s largest emitter, China’s carbon dioxide ($CO_2$) emissions declined by 1% in the second quarter of 2026. Data compiled by Lauri Myllyvirta, lead analyst at the Centre for Research on Energy and Clean Air (CREA), reveals that this drop was overwhelmingly driven by a dramatic collapse in domestic oil consumption—marking the first time in modern history that oil, rather than coal, served as the primary catalyst for a national reduction in emissions.
The catalyst for this contraction was the geopolitical upheaval surrounding the Strait of Hormuz crisis, which disrupted Middle Eastern crude supplies and sent global energy prices surging. China’s total oil consumption plummeted by 9% year-on-year in the second quarter, with transport fuel demand collapsing by 16%.
While coal usage in the power sector rebounded by 2.4% due to ongoing structural rigidities in the national power grid, the sharp retreat in petroleum consumption was large enough to pull total national emissions downward. Following a 2% uptick in the first quarter of 2026 caused by widespread solar and wind curtailment, the second-quarter drop leaves China’s first-half emissions only marginally higher year-on-year—and strictly below the historic peak recorded between 2023 and 2024.
This analytical milestone underlines a profound transformation in China’s energy security posture. Accelerated structural electrification—most visibly demonstrated by the rapid adoption of electric vehicles (EVs) and high-speed rail—has provided Beijing with a functional buffer against external oil shocks. Yet, as government planners unveil a raft of 15th Five-Year Plan documents, the national carbon trajectory remains a tense contest between rapid clean-energy expansion and institutional bottlenecks in the power grid.
Detailed Chronology: From Middle East Crisis to Domestic Oil Shock
2026 Emissions & Energy Timeline (China)
│
├── Q1 2026: CO2 rises +2% YoY ── Wasted wind/solar curtailment spikes
│
├── Q2 2026: Strait of Hormuz Crisis ── Global oil supply disrupted
│   ├── Crude Oil Imports drop -32%
│   ├── Transport Fuel Demand drops -16%
│   └── Overall Domestic Oil Consumption drops -9%
│
├── Q2 2026: EV & Clean Infrastructure Acceleration
│   ├── Electric Heavy Truck Sales climb +77% YoY (June share >45%)
│   ├── EV Charging Volumes rise +60% YoY
│   └── Hydropower Output rebounds +9%
│
└── Mid-2026: Policy & Five-Year Plan Rollouts
    ├── 15th Five-Year Plans released across energy, coal, & climate
    └── CO2 overall drops -1% YoY in Q2 (First oil-driven decline)
The second quarter of 2026 opened against the backdrop of severe maritime and geopolitical disruptions in the Middle East. As conflict impacted shipping through the Strait of Hormuz, global crude deliveries were abruptly restricted. China, the world’s largest crude importer, felt the immediate brunt of the supply shock.
The Import Collapse and Stockpile Dynamics
Official customs releases reveal that China cut its crude oil imports by a massive 32% year-on-year in the second quarter of 2026. Processing volumes at domestic refineries contracted by 11%, forcing major state-owned operators such as Sinopec to draw down refined product inventories, with Sinopec reporting a 9% decline in total fuel sales over the first half of the year.
For global energy markets, the critical question was how China managed a 32% drop in crude imports without triggering widespread economic paralysis. Industry data from the National Bureau of Statistics (NBS) provides the answer:
- Consumption Cutbacks (40%): Genuine reductions in domestic oil demand absorbed approximately 40% of the import shortfall.
- Strategic Stockpile Drawdown (60%): The remaining 60% of the import gap was bridged by tapping into China’s extensive strategic crude reserves, shifting the country from an aggressive inventory-building posture to active reserve utilization.
From First-Quarter Surge to Second-Quarter Decline
This oil shock directly reversed the carbon trend set earlier in the year. In the first quarter of 2026, China’s $CO_2$ emissions had increased by 2% year-on-year, driven primarily by renewable generation curtailment—where operational wind and solar assets were disconnected from an inflexible grid, forcing utilities to burn coal to meet demand.
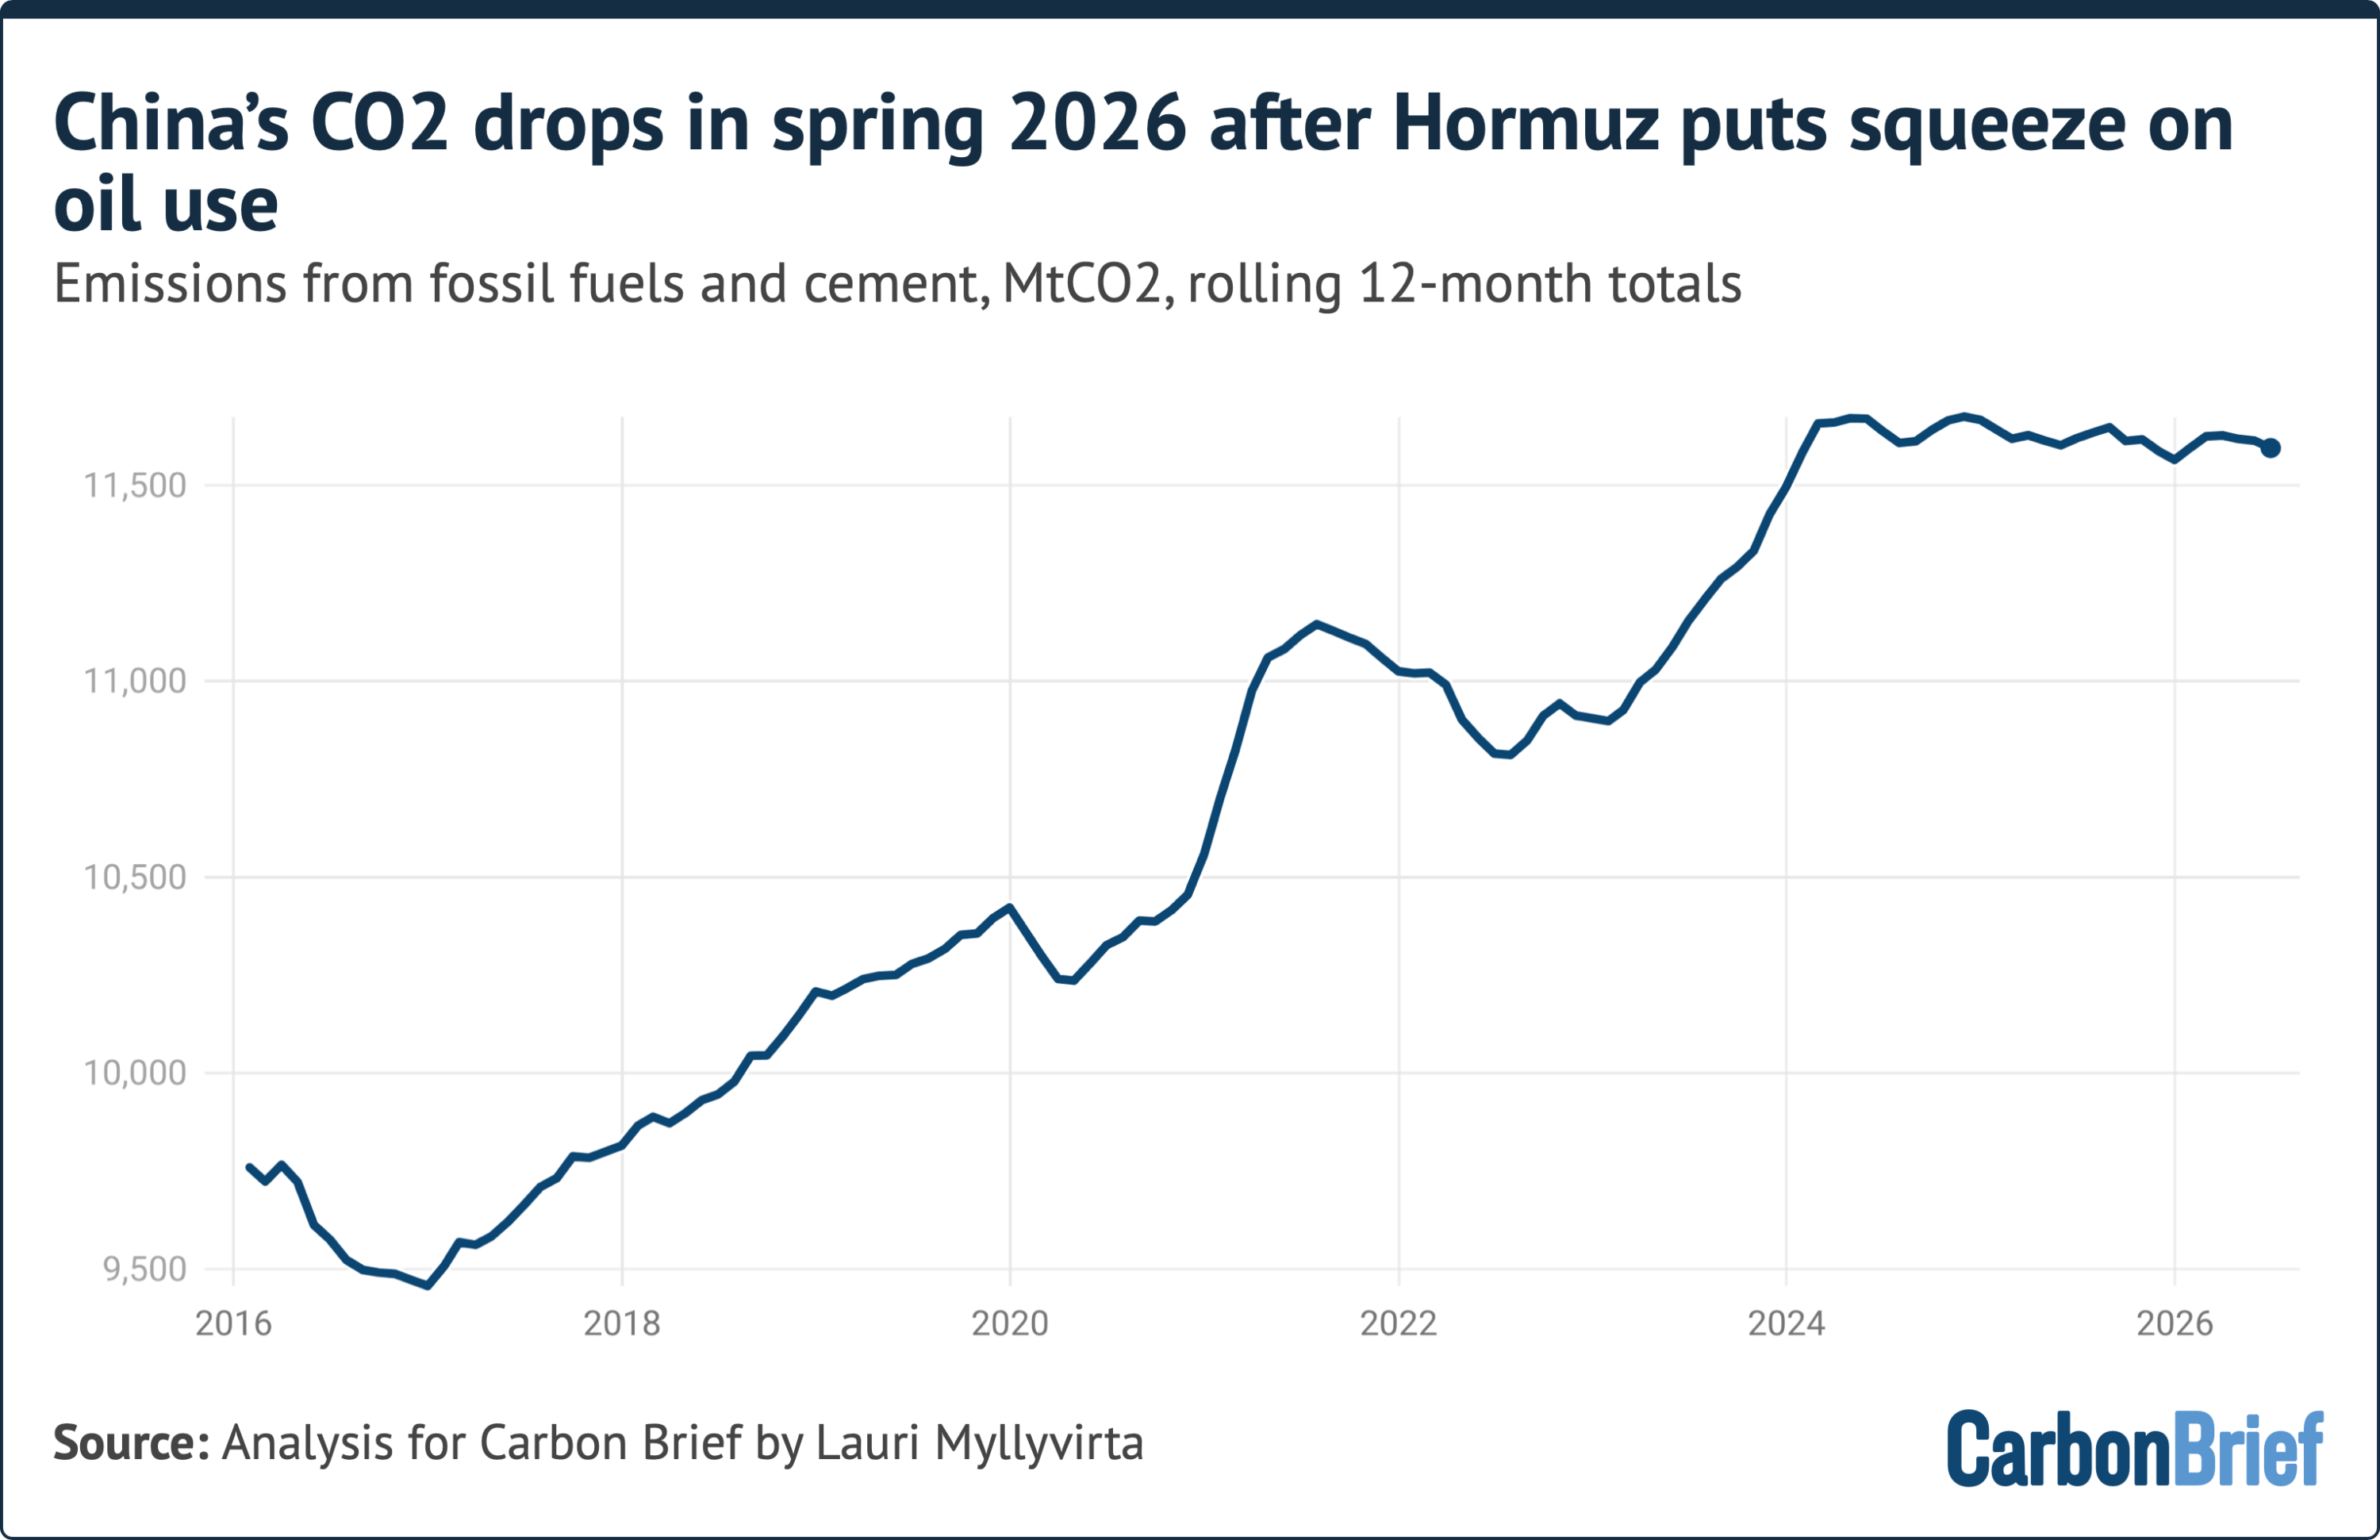
By the second quarter, however, the 9% overall contraction in oil usage overwhelmed modest gains in power-sector coal burning. Consequently, total quarterly emissions dropped by 1% year-on-year, reinforcing a broader two-year plateau in China’s fossil fuel and cement emissions that has persisted since peak levels in March 2024.
Supporting Context & Metrics: Sectoral Deep Dive
Q2 2026 Sectoral Performance Highlights
┌──────────────────────────────────┬──────────────────────────────────┐
│ Indicator / Sector               │ Q2 2026 Year-on-Year Change      │
├──────────────────────────────────┼──────────────────────────────────┤
│ National $CO_2$ Emissions         │ ▼ 1.0%                           │
│ Total Oil Consumption            │ ▼ 9.0%                           │
│ Transport Oil Demand             │ ▼ 16.0%                          │
│ Crude Oil Imports                │ ▼ 32.0%                          │
│ Cement Output                    │ ▼ 9.0%                           │
│ Crude Steel Production           │ ▼ 1.0%                           │
│ EV Charging Volume               │ ▲ 60.0%                          │
│ Electric Heavy-Truck Sales       │ ▲ 77.0%                          │
│ Power Sector Coal Generation     │ ▲ 2.4%                           │
│ Hydropower Output                │ ▲ 9.0%                           │
└──────────────────────────────────┴──────────────────────────────────┘
A detailed breakdown across industrial, transportation, and power-generation sectors highlights divergent dynamics behind China’s changing carbon footprint.
Transport and the Electric Vehicle Displacement Boom
The steep decline in transport oil demand (-16% for petrol, diesel, and jet fuel) was not caused by a contraction in mobility. Transport logistics data shows that cross-regional passenger travel actually rose 0.1% year-on-year in Q2, urban transit passenger trips grew 2.9%, and commercial freight tonnage expanded 2.4%. The sole transportation sub-sector to experience a drop was commercial air travel, which fell 7% across May and June, though aviation accounts for a small fraction of China’s total fuel mix.
Instead, high pump prices accelerated a structural shift toward electrification across commercial and private fleets:
- Heavy-Duty Commercial Vehicles: Electric heavy-truck sales surged by 77% year-on-year during the second quarter. By June 2026, electric models captured over 45% of the total new heavy-truck market.
- Fleet Expansion & Utilization: China added 12.1 million new energy vehicles (NEVs) over the preceding 12 months (including 8.1 million pure battery-electric models), pushing the total operational fleet up 33% year-on-year.
- Charging Infrastructure Demand: Public EV charging volumes skyrocketed by 60% in Q2. Drivers of plug-in hybrid electric vehicles (PHEVs) overwhelmingly opted for grid power over expensive petrol, while commercial taxi fleets rapidly converted to electric models to maintain profit margins.
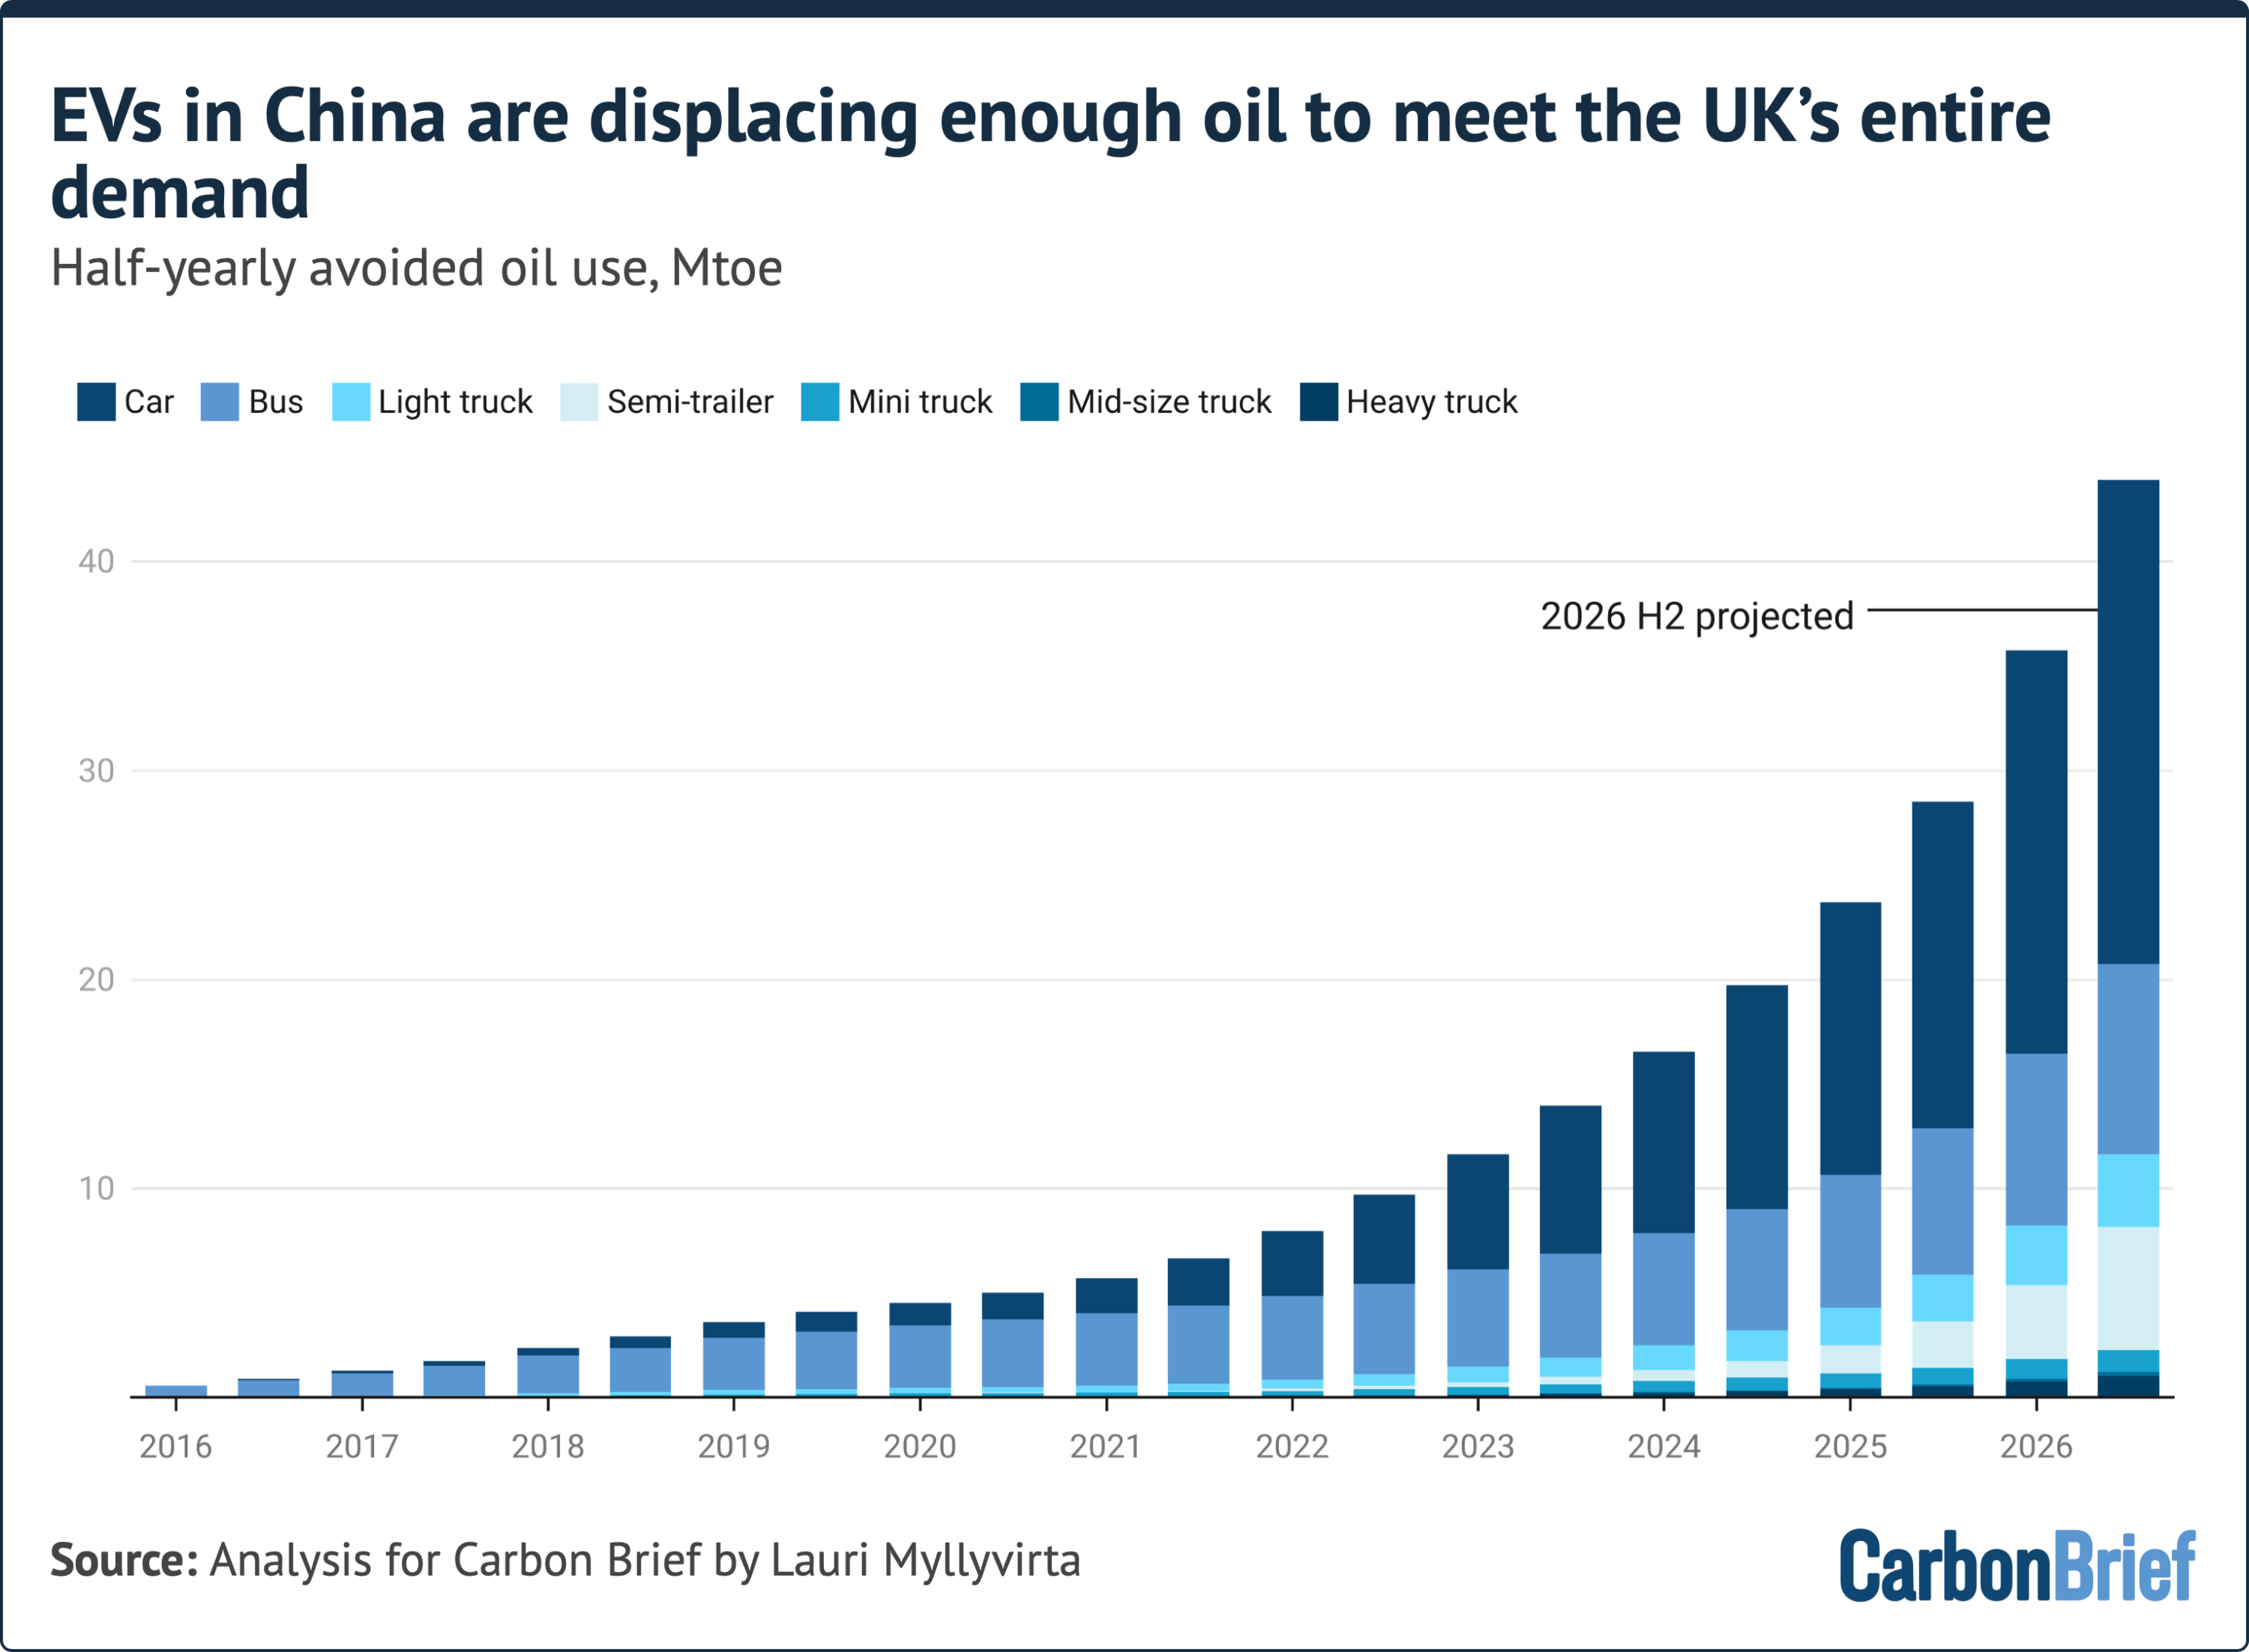
Half-Yearly Avoided Oil Use from EVs in China
   36 Mtoe
   ┌───────┐
   │       │   (Exceeds the total 6-month oil consumption of the UK)
   │       │
   └───────┘
   H1 2026
In total, EV usage displaced an estimated 19 million tonnes of oil equivalent (Mtoe) in Q2 2026 alone—a 50% increase in displaced volume compared to Q2 2025. Across the entire first half of 2026, avoided oil consumption reached 36 Mtoe, a volume that exceeds the total primary oil demand of the United Kingdom over a comparable six-month period. Taking power-grid emissions into account, EV adoption eliminated roughly 35 million tonnes of $CO_2$ ($MtCO_2$) in Q2, equal to 1.3% of China’s total quarterly emissions.
Industrial Contraction and Coal-Chemical Limits
Beyond transportation, industrial activity contributed to the emissions drop:
- Real Estate & Construction: Cement production fell 9% year-on-year in Q2, deepening from an 8% decline in Q1. Crude steel output slipped 1%, while pig-iron production contracted by 3%.
- Coal-to-Chemicals: Although high global oil prices enhanced the relative profitability of coal-based chemical synthesis, domestic producers were unable to expand output. Facilities had already been operating near maximum technical capacity prior to the crude shock. Meanwhile, oil-based chemical production maintained moderate growth, with primary ethylene output expanding 17%.
- Industrial Heating: Coal use for industrial heat continued to rise modestly, highlighting persistent challenges in decarbonizing high-temperature industrial process energy despite national directives for zero-carbon industrial parks.
The Power Sector Paradox: Renewable Growth vs. Grid Curtailment
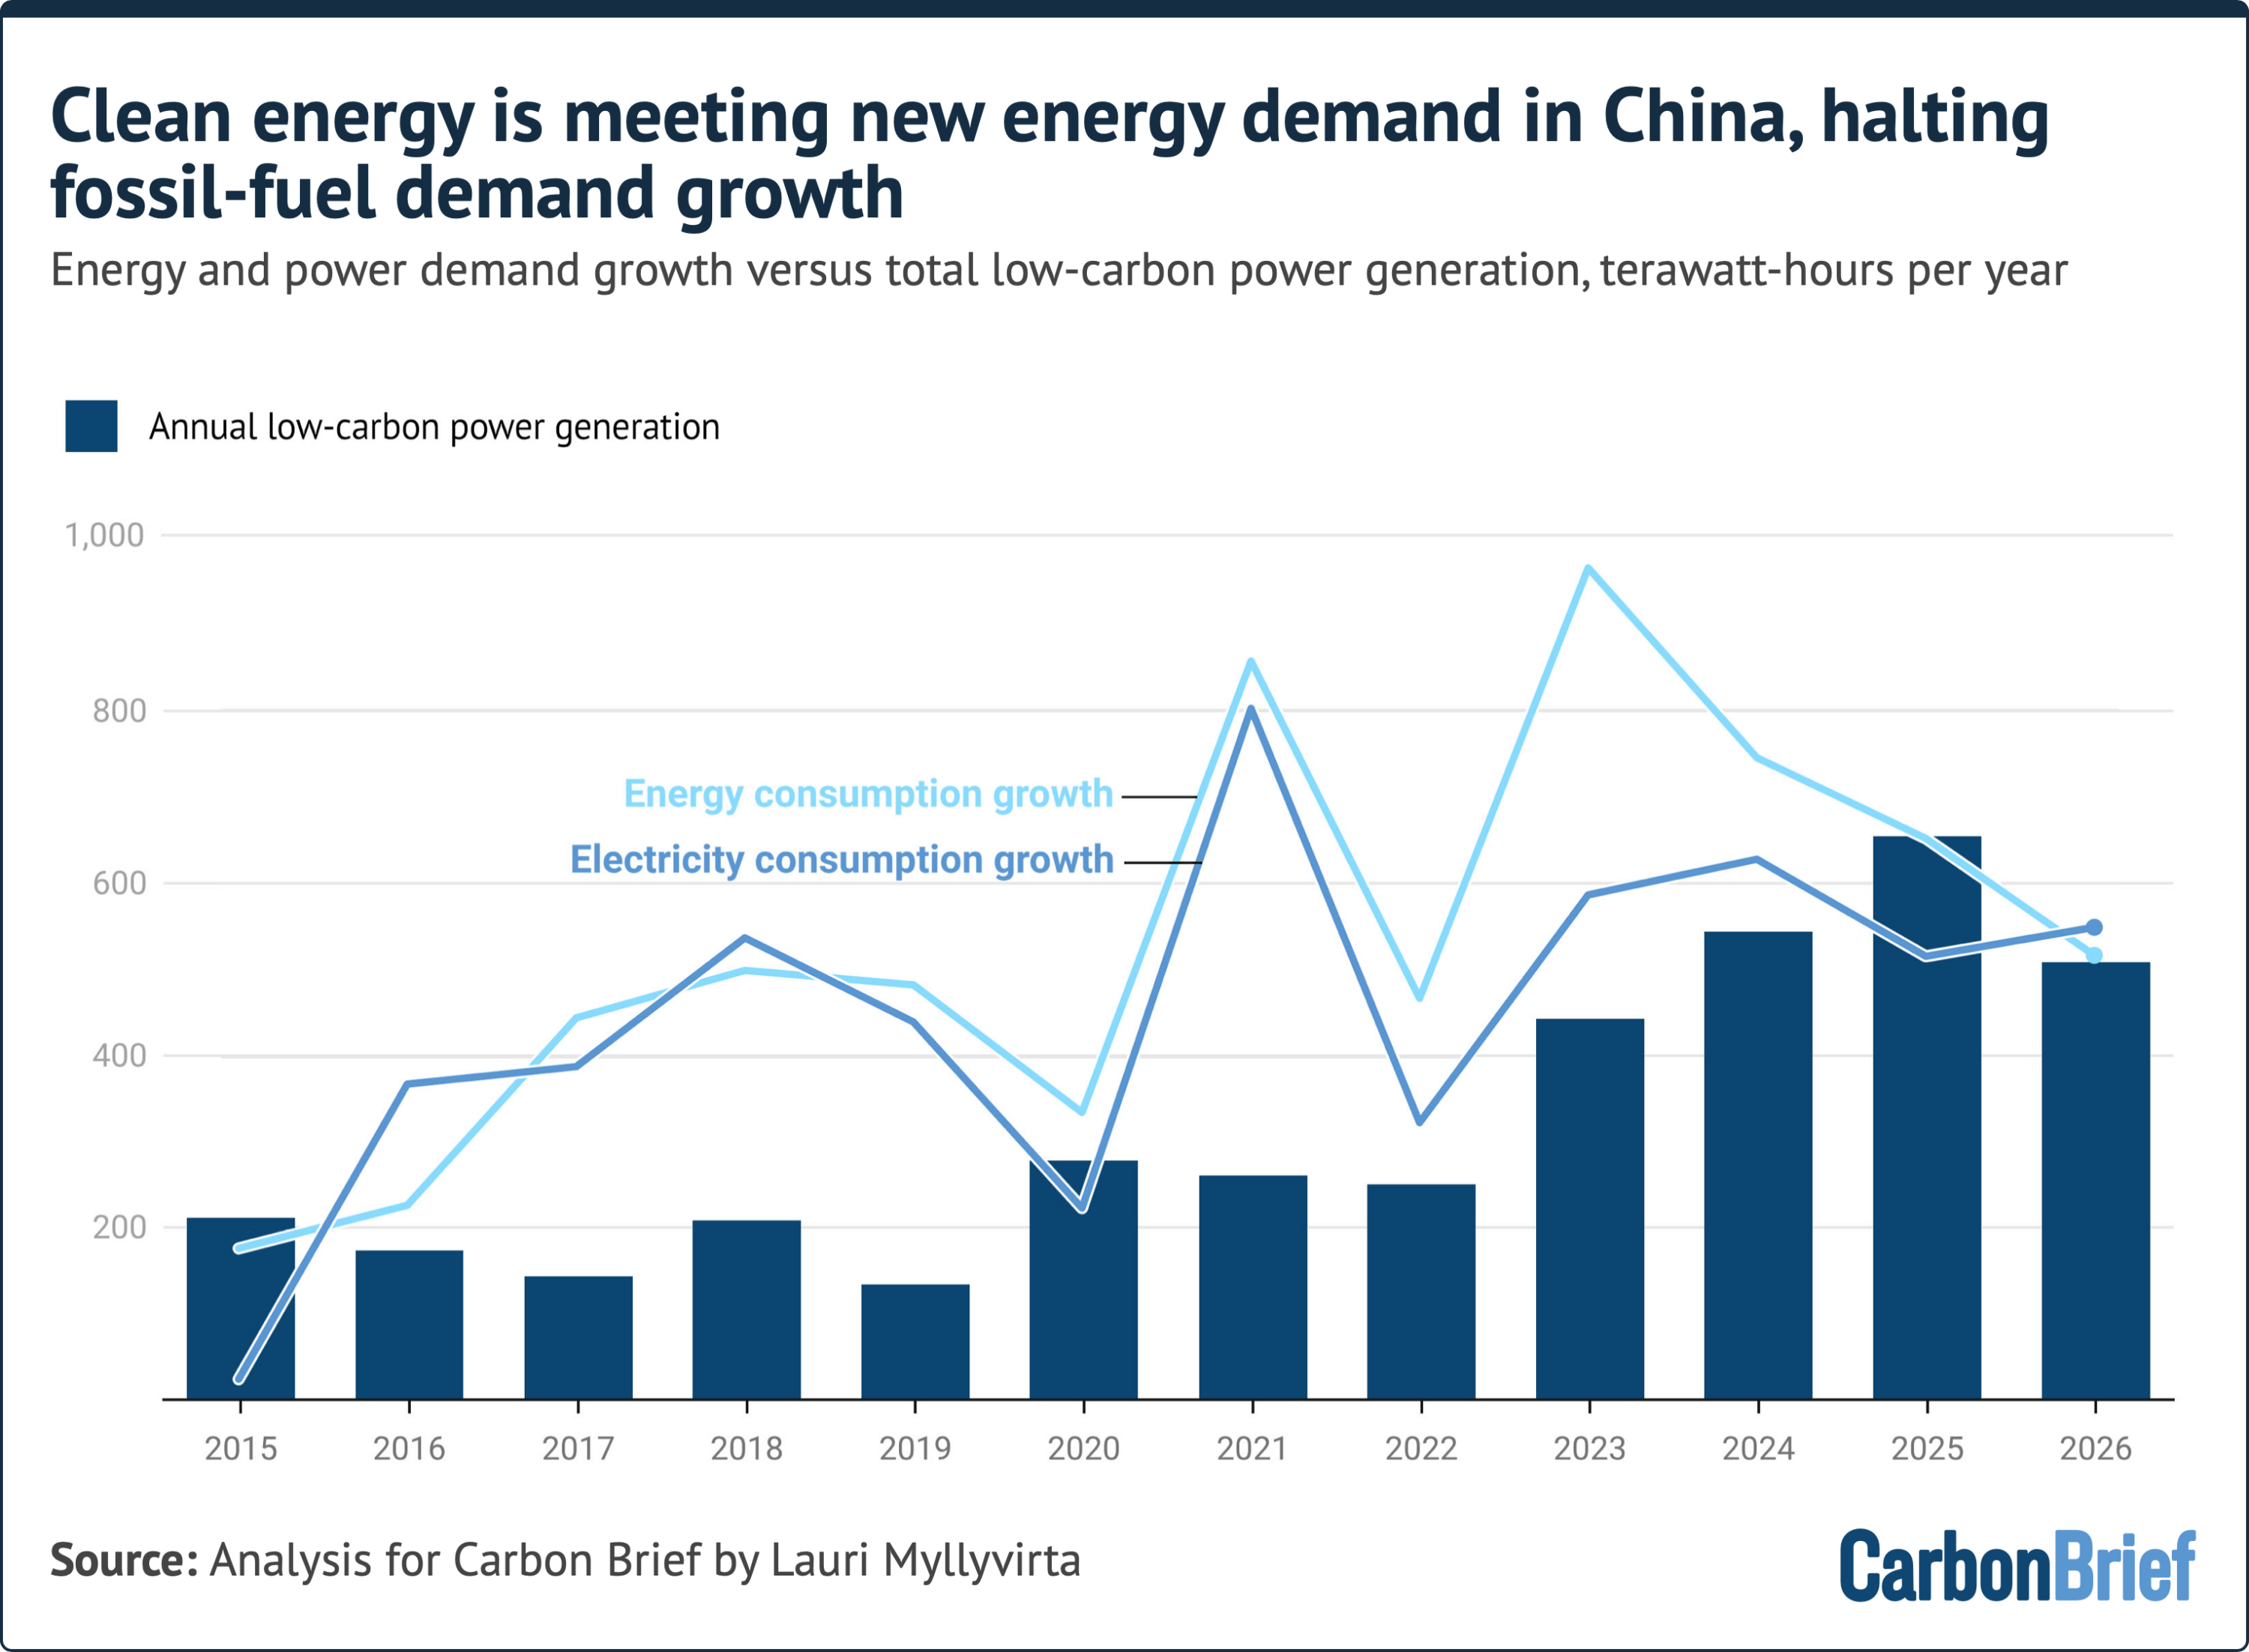
In contrast to transportation and heavy industry, power-sector emissions climbed 3.0% across the first half of 2026. Coal-fired generation grew 2.4% in Q2, while gas-fired generation fell 1.2%.
This increase in thermal generation occurred despite strong structural additions to clean generation:
- Hydropower: Rebounded by 9% year-on-year in Q2 due to improved rainfall.
- Nuclear: Output rose 2%, supported by new reactor approvals.
- Wind & Solar: Added substantial new capacity, with wind commissioning rates exceeding all previous years except for 2025, and solar installations remaining consistent with 2023’s record-setting trajectory (>200 GW annually).
- Demand Moderation: Electricity demand growth slowed from 5.9% in Q2 2025 to 5.2% in Q2 2026.
Why Coal Power Rose Despite Clean Energy Growth:
1. Rigid Long-Term Power Purchase Contracts
2. Pre-Scheduled Inter-Provincial Transmission Lines
3. Fixed Capacity Payments to Coal Generators
4. Suboptimal Wind Conditions in key northern basins
5. Wasted Generation (Curtailment) driven by market design flaws
The underlying cause of rising coal power generation was grid inflexibility. Power purchase agreements in China remain heavily structured around fixed monthly or annual operational targets for coal plants. Furthermore, inter-provincial power lines operate on rigid transmission schedules rather than real-time spot market pricing.
This institutional structure was further strained by the commissioning of 30 GW of new coal-fired capacity in the first half of 2026—the highest rate of coal plant additions since 2016. Consequently, grid operators frequently curtailed variable wind and solar output to accommodate base-load coal contracts, wasting clean electricity that could have otherwise displaced thermal generation.
Official Statements & Policy Landscape: Decoding the 15th Five-Year Plans
The second quarter of 2026 coincided with an intense drafting and publication phase for government agencies setting policy for the 15th Five-Year Plan period (2026–2030). Documents released by the National Development and Reform Commission (NDRC), the National Energy Administration (NEA), and the Ministry of Ecology and Environment (MEE) reveal subtle shifts in China’s official climate policy framework.
Revising Coal Targets: From "Gradual Reduction" to "Plateauing"
A notable policy recalibration concerns coal consumption. In 2021, President Xi Jinping committed that China would "gradually reduce coal consumption during the 15th Five-Year period." However, recent sectoral plans specify that national coal consumption will "enter a plateau" between 2026 and 2030.
The new directives instruct authorities to focus on "reasonably controlling coal-power capacity and generation." While this language signals a higher administrative bar for approving new greenfield coal projects—and suggests potential phase-outs of older, inefficient plants—it confronts a massive pipeline of 204 GW of coal capacity currently under construction across various provinces.
Relaxing Curtailment Rules
To manage the integration of massive renewable installations, the NEA’s updated Power System Five-Year Plan adjusted national curtailment thresholds:
- Historical Baseline: National regulations strictly capped renewable curtailment at 5%.
- 2024 Revision: The cap was relaxed to 10% for resource-rich western provinces.
- 2026 Policy: The new framework allows curtailment limits to rise up to 15% in designated provinces, while maintaining 5% to 10% caps elsewhere.
While this change officially reflects the operational realities of massive wind and solar additions in remote areas like Qinghai and Tibet, analysts warn that higher allowable curtailment rates could increase total wasted clean energy unless regional grid interconnectivity improves rapidly.
Electrification & Fleet Transformation Targets (15th Five-Year Plan)
┌──────────────────────────────────────────┬──────────┬────────────────┐
│ Target Metric                            │ 2025     │ 2030 Target    │
├──────────────────────────────────────────┼──────────┼────────────────┤
│ Electricity Share of Final Energy Use    │ 30.0%    │ 35.0%          │
│ EV Share of Total Vehicle Fleet          │ 12.0%    │ 30.0%          │
│ Commercial Fleet Electrification Share   │ Baseline │ 25.0%          │
└──────────────────────────────────────────┴──────────┴────────────────┘
Broadening System Reliability Beyond Coal
In a notable structural departure, the Renewable Energy Five-Year Plan redefines grid stability. Historically, coal power was framed as the sole reliable option for baseload security. The new policy framework explicitly distributes grid balancing responsibilities across a broader suite of technologies:
- Battery Storage: 17 GW of battery storage was installed in H1 2026, bringing total national capacity to 153 GW.
- Virtual Power Plants (VPPs) & Demand Response: Regulatory support has been expanded for aggregator software that coordinates decentralized battery, EV, and industrial loads during peak demand windows.
- Nuclear & Conventional Hydro Acceleration: The government approved eight new commercial nuclear reactors in July 2026, including small modular reactors (SMRs) such as Linglong One, while targeting 6 GW of major conventional hydro additions for 2026.
Future Outlook: Structural Tipping Points & The Race for Decarbonization
China’s emissions trajectory is increasingly defined by a race between slowing overall energy demand growth and the integration speed of clean-energy infrastructure.
Key Drivers Shaping China's Emissions Trajectory

   DOWNWARD PRESSURES (Decarbonization)        UPWARD PRESSURES (Emissions Growth)
   ├── Structural EV & Heavy-Truck Shift       ├── Coal-Power Additions (204 GW Pipeline)
   ├── Real Estate & Cement Contraction        ├── Rigidity in Grid Spot Markets
   ├── Unprecedented Clean Capacity Addition    ├── Relaxed Curtailment Limits (Up to 15%)
   └── Electrification Target (35% by 2030)    └── Industrial Coal Heating Demand
Is China Past Its Absolute Peak?
Despite a 2% uptick in Q1 2026, the 1% contraction in Q2 demonstrates that structural shifts in transportation, combined with a sustained real-estate slowdown, possess enough power to offset power-sector emissions growth. If total energy demand growth remains moderate (between 3% and 5% annually), clean capacity additions are now large enough to supply 100% of new electricity demand.
Furthermore, the geopolitical energy shock of 2026 has reinforced Beijing’s strategic commitment to rapid electrification. Displacing imported petroleum with domestically generated clean electricity is no longer viewed solely as a decarbonization goal, but as an urgent national security imperative.
Key Variables to Watch
- Power Market Reform: Whether regional spot markets can replace rigid long-term coal contracts, allowing clean power to dispatch freely without artificial curtailment.
- Coal Construction Pipeline: How strictly regulators enforce "reasonable control" over the 204 GW of coal capacity currently under construction.
- Electrification Pace: Whether EV market penetration in heavy commercial transport maintains its steep momentum, locking in permanent reductions in refined oil consumption.
If grid integration reforms successfully reduce renewable curtailment and wind conditions return to historical averages, China’s total $CO_2$ emissions could resume a sustained multi-year decline—confirming that the plateau established between 2023 and 2024 represented the absolute structural peak of the country’s carbon footprint.
Methodology & Data Sources
This analysis synthesizes official macroeconomic, industrial, and energy sector datasets:
- Emissions Estimates: Derived using National Bureau of Statistics (NBS) fuel calorific values, updated IPCC default factors, and greenhouse gas inventory standards from China’s national filings.
- Power Sector Calculations: Monthly electricity production estimated by combining China Electricity Council (CEC) installation figures, utilization hours via the Wind Financial Terminal, and NBS thermal generation reports. Coal heat-rate calibrations applied to circumvent historical raw coal reporting discrepancies.
- Oil & Transport Fuel Analytics: Overall crude intake and sectoral fuel splits compiled from NBS quarterly energy releases, Sinopec corporate disclosures, China Customs trade manifests, and CAAM vehicle sales records.
- EV Oil Displacement: Quantified by tracking powertrain-specific sales (BEVs vs. PHEVs), operational fleet mileage estimates from the International Council on Clean Transportation (ICCT), and NEA national charging infrastructure TWh figures.