Executive Overview
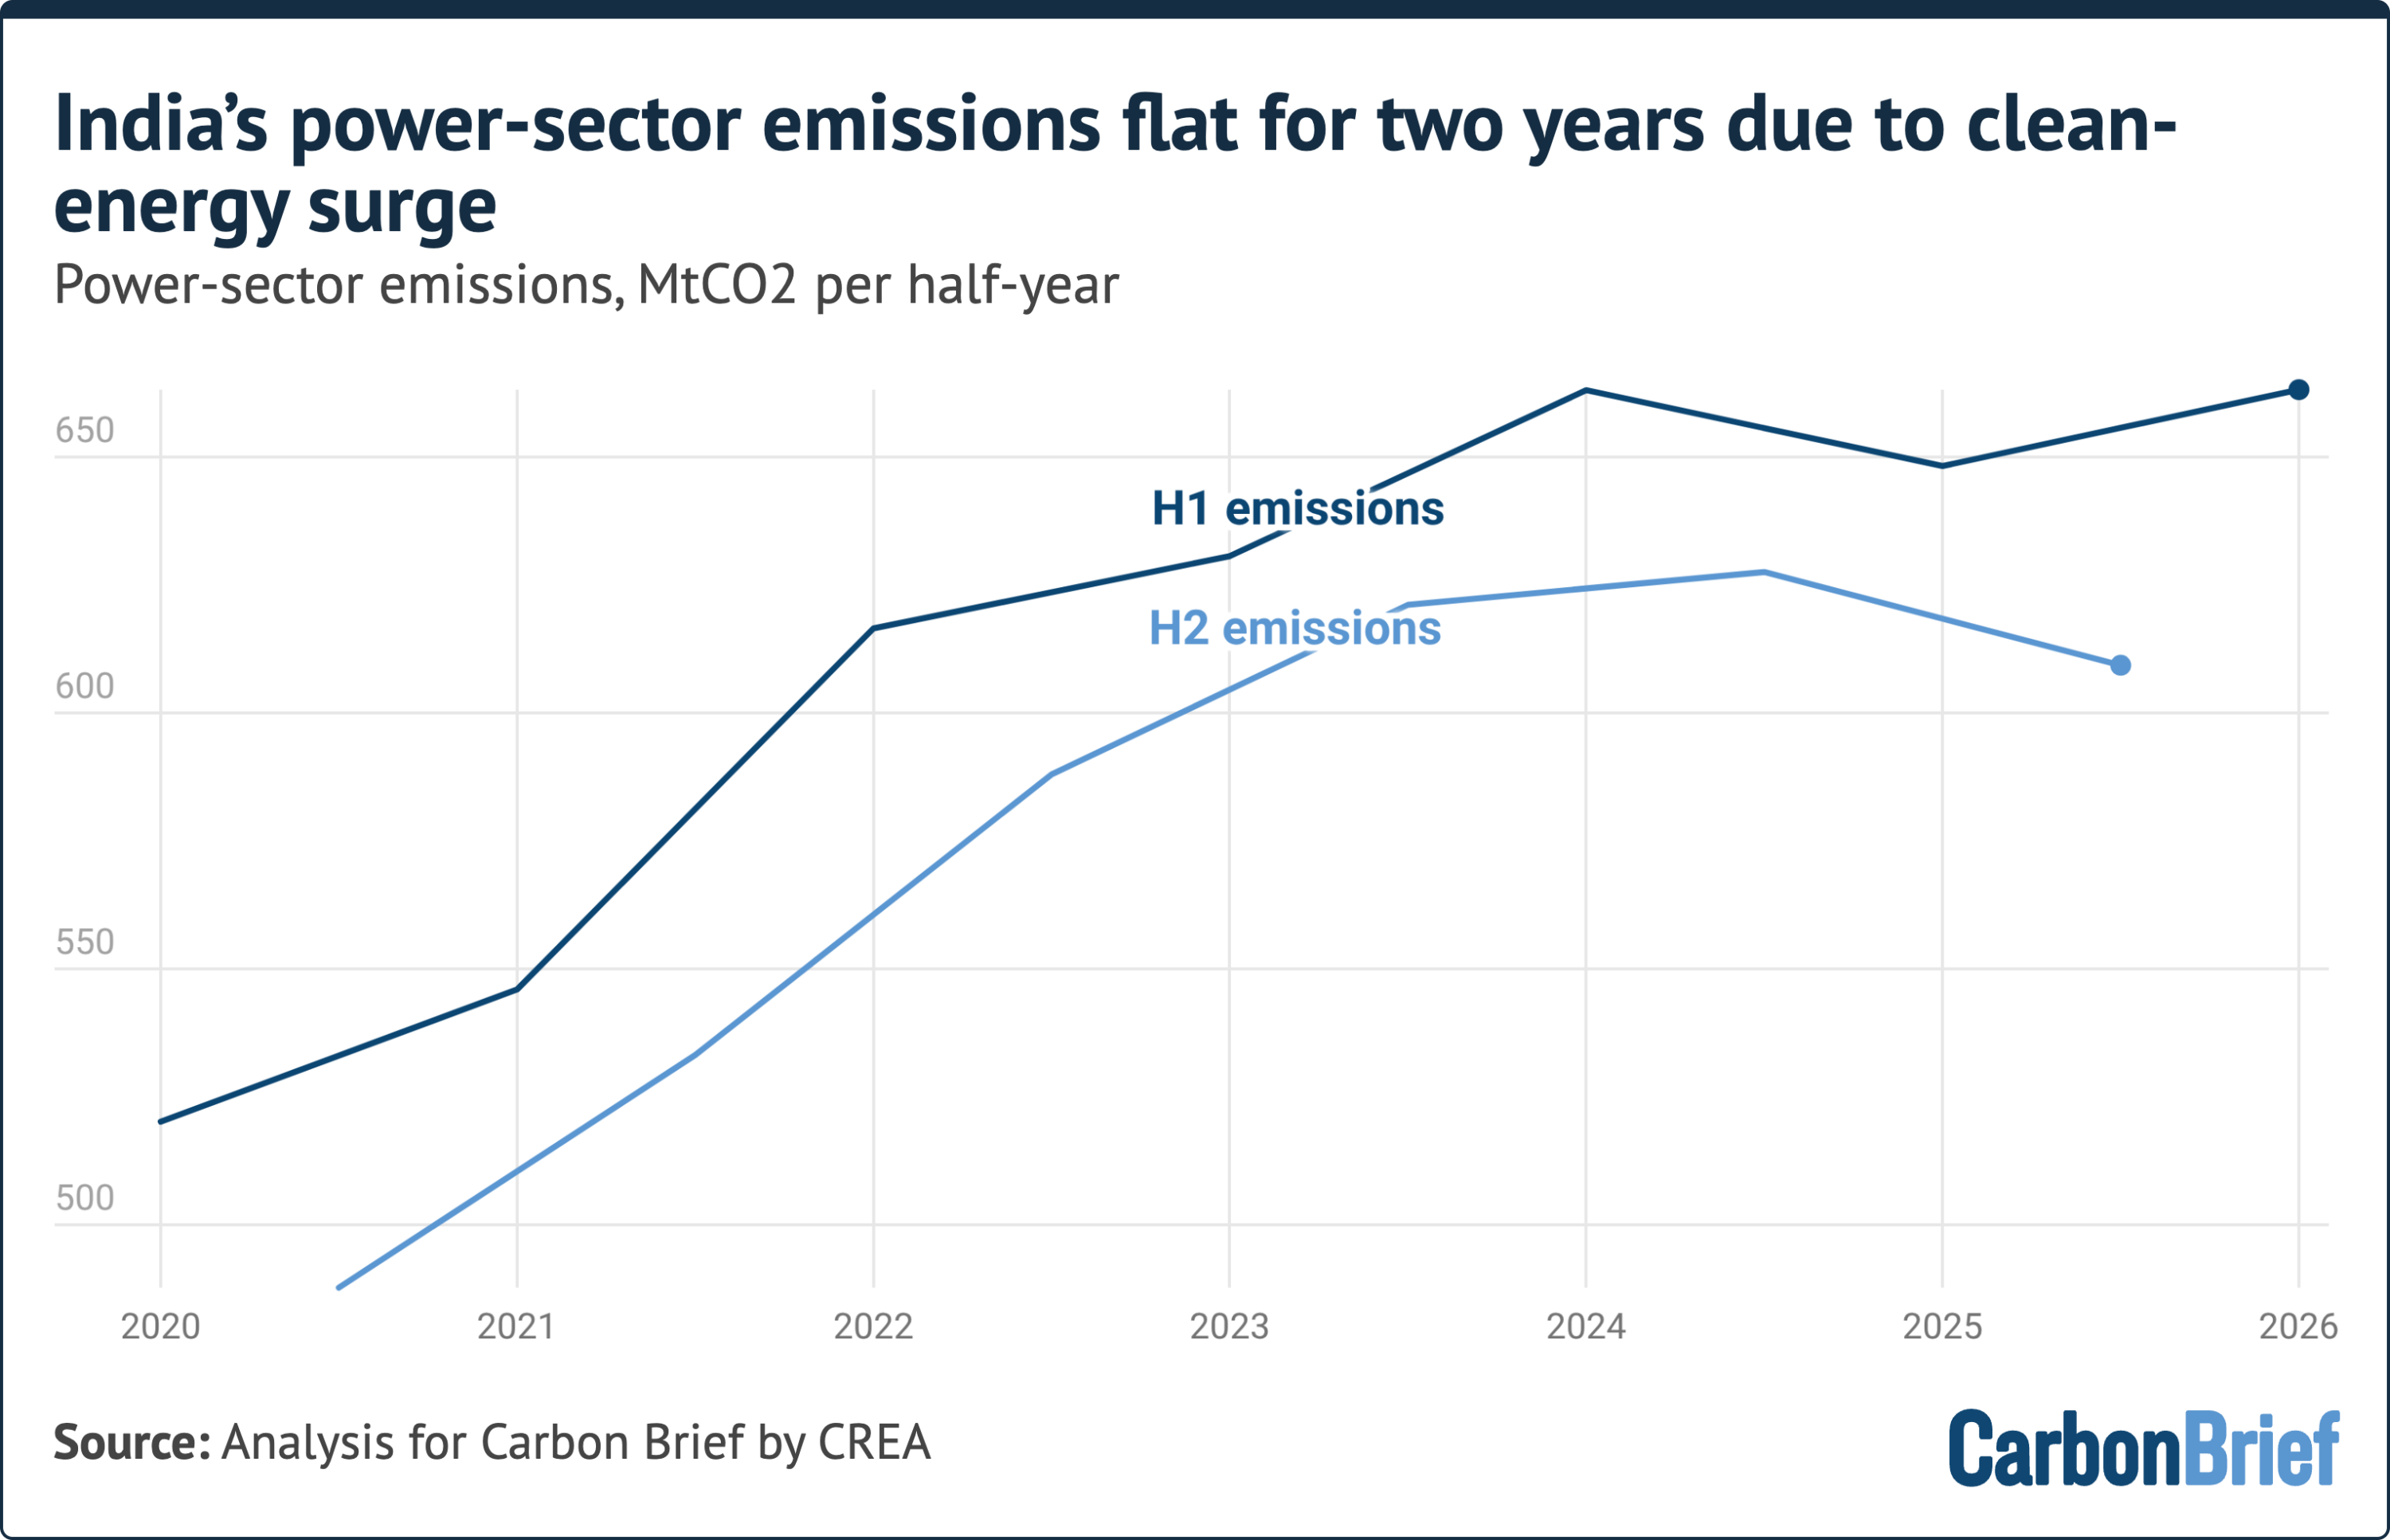
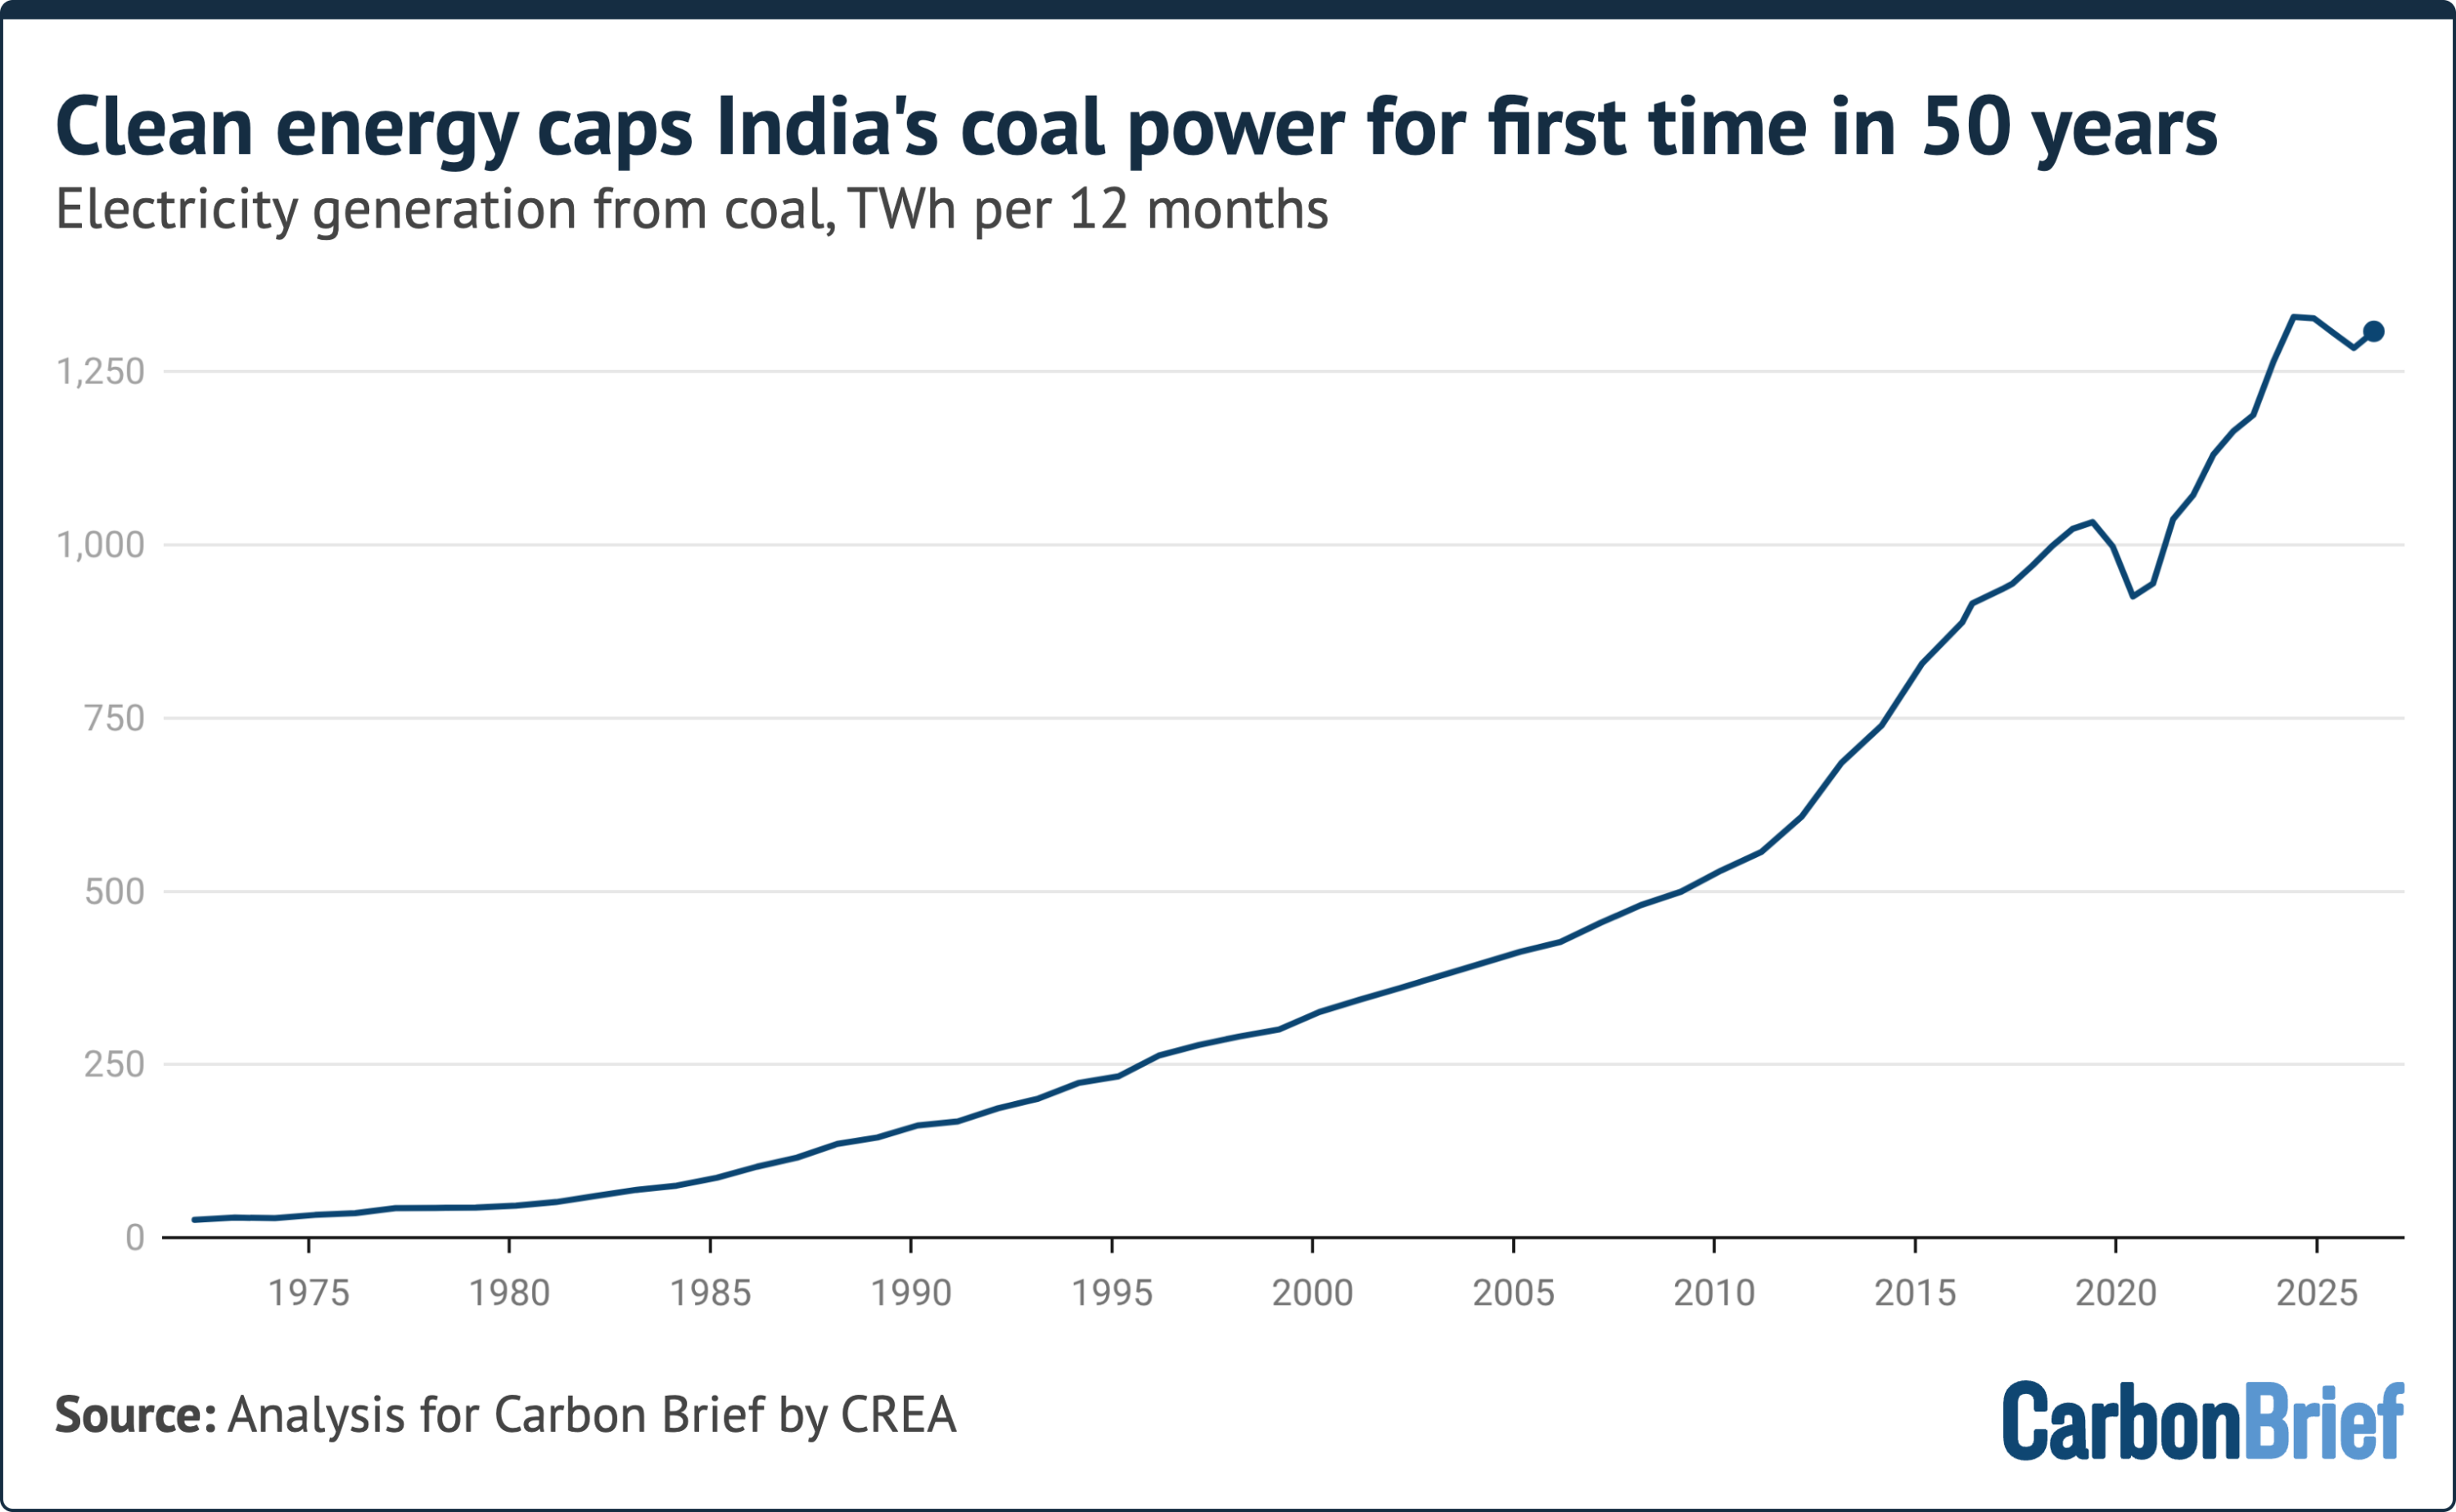
An authoritative analysis of India’s energy sector in the first half of 2026 reveals a historic milestone: for the first time in more than half a century, coal-fired power generation experienced zero growth over a two-year period (H1 2024 to H1 2026). Driven by an unprecedented surge in solar, wind, hydro, and nuclear capacity, clean energy sources completely satisfied India’s growing electricity demand. Consequently, carbon dioxide ($CO_2$) emissions from the power sector have effectively flatlined over this timeframe.
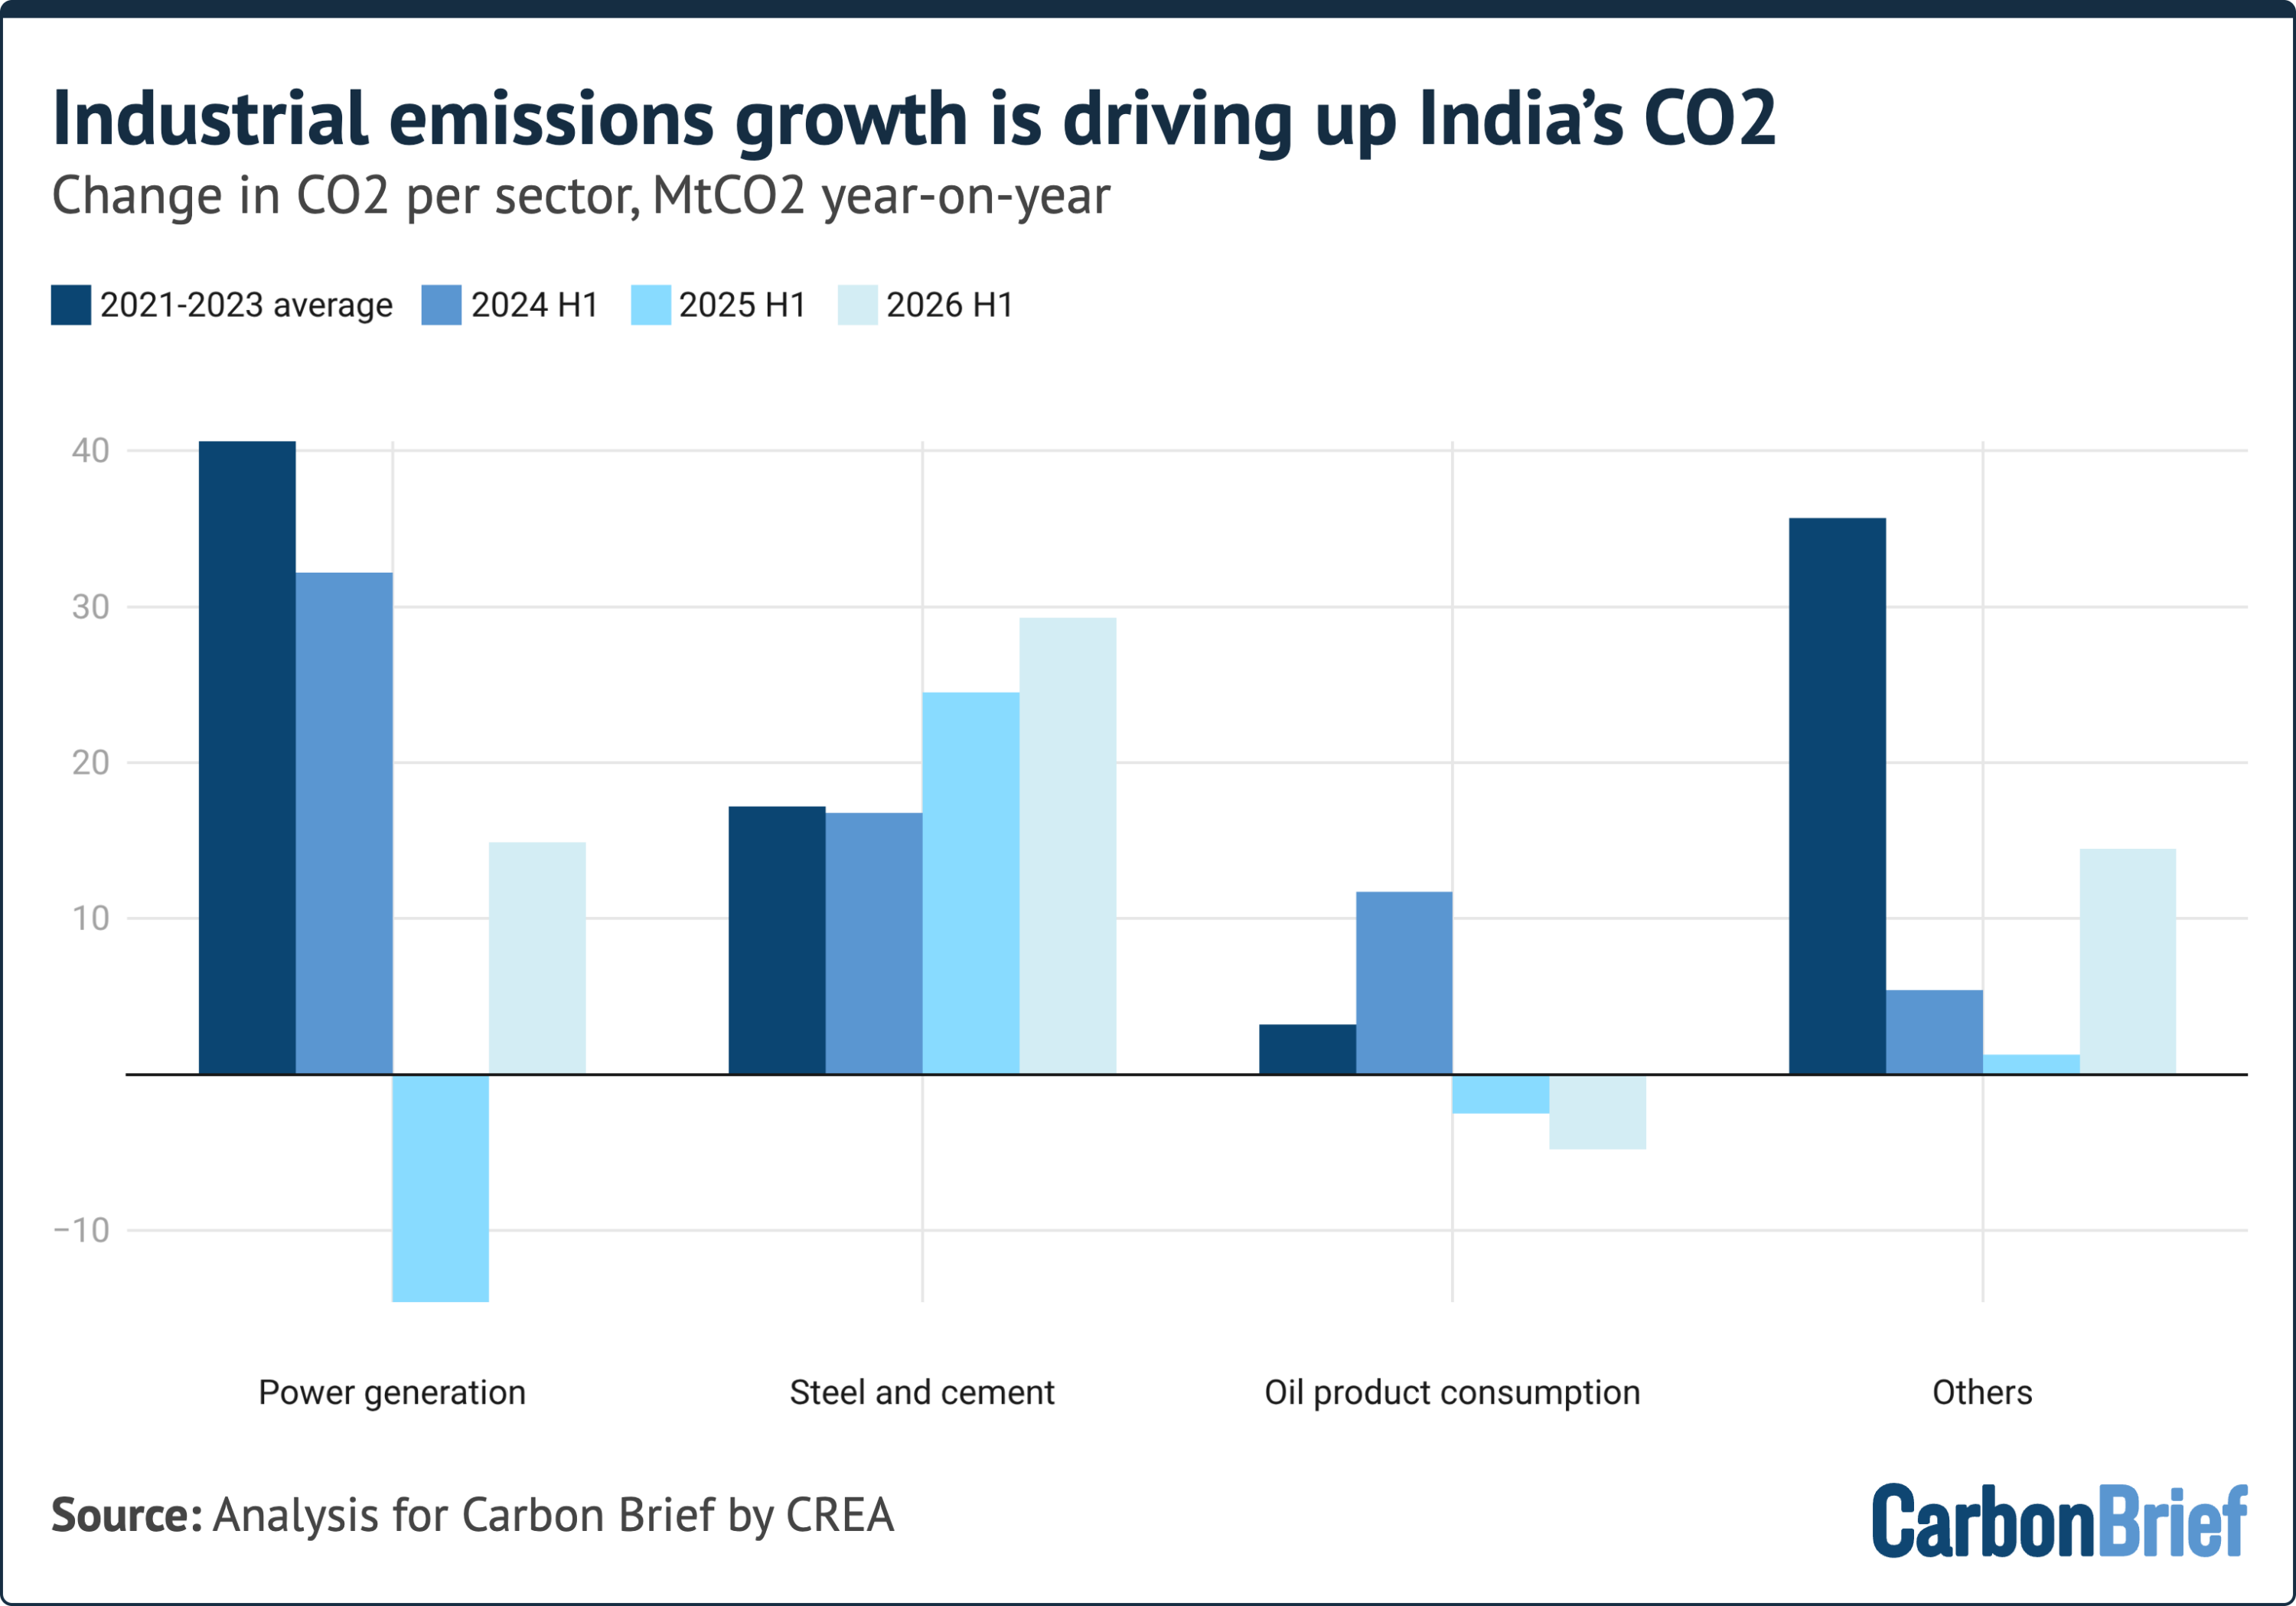
However, this breakthrough in electricity generation has not translated into an absolute drop in national emissions. A comprehensive report published by Carbon Brief, based on research from the Centre for Research on Energy and Clean Air (CREA), shows that India’s overall $CO_2$ emissions grew by 3.7% year-on-year in the first half of 2026. This increase was propelled primarily by rapid expansions in heavy industry—specifically steel and cement manufacturing—as well as temporary fuel-switching triggered by global geopolitical disruptions in the Strait of Hormuz.
While the power sector has established a functional ceiling on fossil energy consumption, India’s total carbon footprint remains constrained by structural dependencies in industrial manufacturing. With industrial electrification rates remaining among the lowest in the G20, direct burning of fossil fuels in heavy manufacturing continues to decouple economic output from power grid decarbonization, highlighting a critical challenge in India’s broader climate strategy.
Detailed Chronology: The H1 2024 to H1 2026 Energy Landscape
The period from early 2024 through mid-2026 marks a significant structural pivot in India’s energy balance sheet. Historically, economic expansion and increased consumer cooling demand resulted in proportional spikes in coal power generation. However, over the past 24 months, India added non-fossil capacity at a pace that restructured grid dynamics.
       HISTORIC 2-YEAR ELECTRICITY GENERATION BALANCE (H1 2024 vs. H1 2026)
  +-------------------------------------------------------------------------+
  | Electricity Demand Growth:                     +63 TWh (+7.0%)          |
  +-------------------------------------------------------------------------+
  | Clean Energy Generation Added:                  +70 TWh                 |
  |   ├── Solar Power:                             +44 TWh                  |
  |   ├── Wind Power:                              +13 TWh                  |
  |   ├── Hydroelectric Power:                     +8 TWh                   |
  |   └── Nuclear Power:                           +7 TWh                   |
  +-------------------------------------------------------------------------+
  | Coal Power Output Net Change:                   0 TWh (0.0% Growth)     |
  +-------------------------------------------------------------------------+
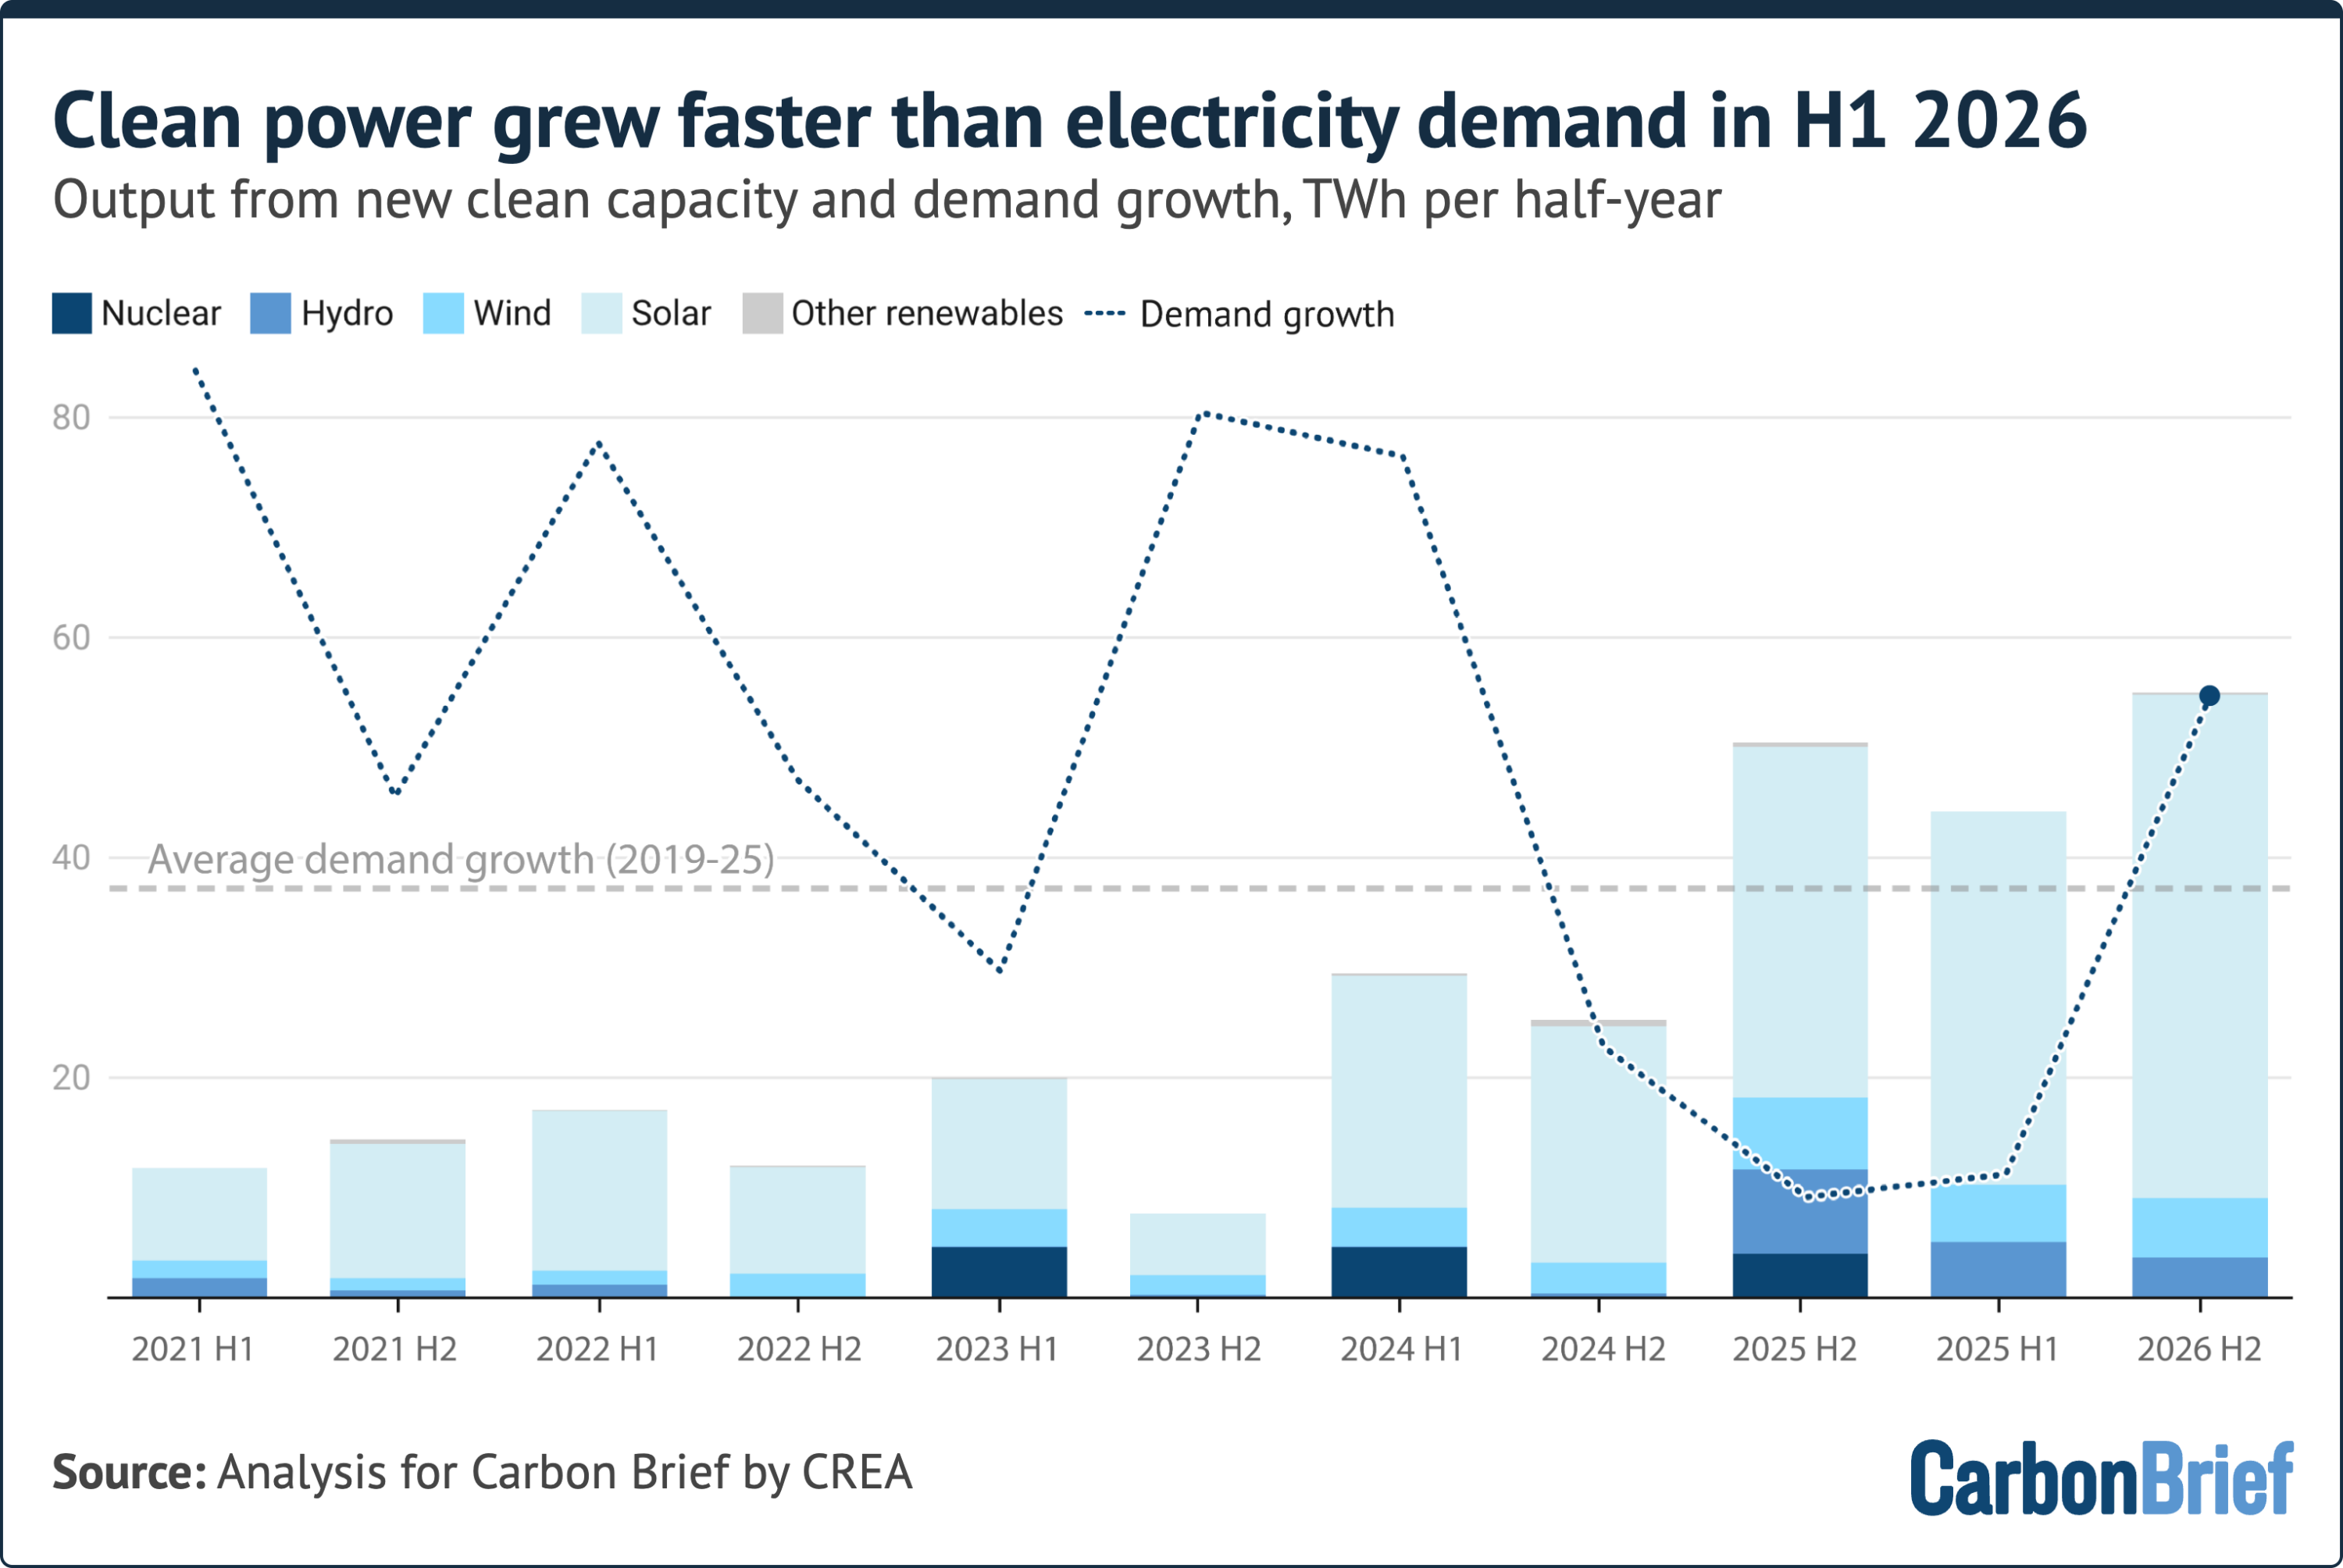
Between H1 2024 and H1 2026, total national electricity demand expanded by 7%, adding 63 terawatt-hours (TWh) of consumption—an increment equivalent to the entire annual power output of nations such as Singapore or Switzerland. Unprecedented addition of clean capacity met 100% of this demand:
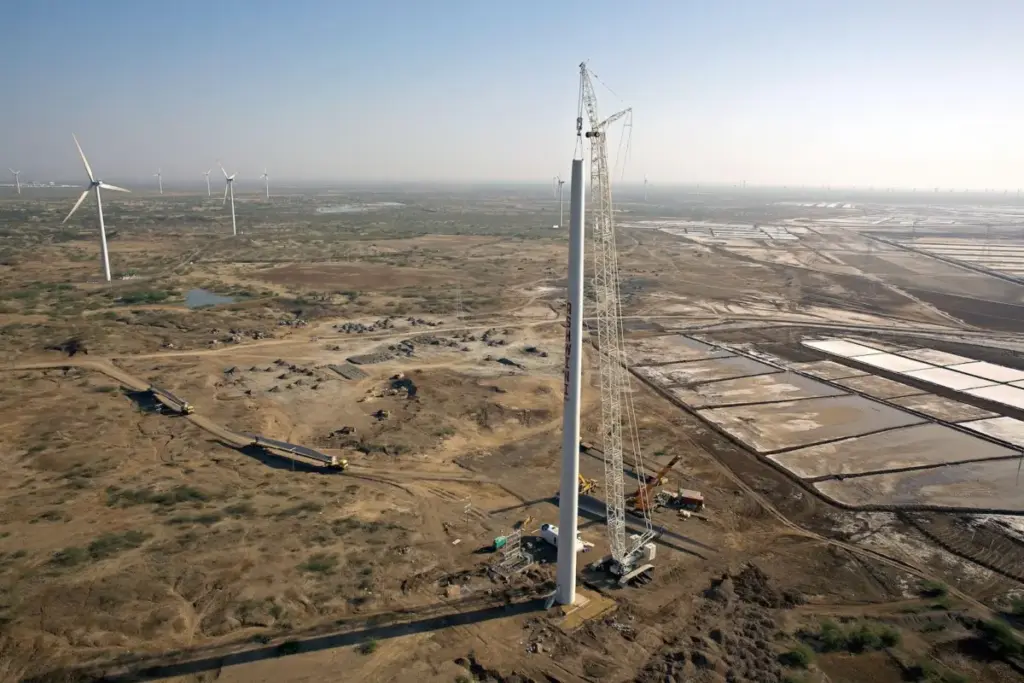
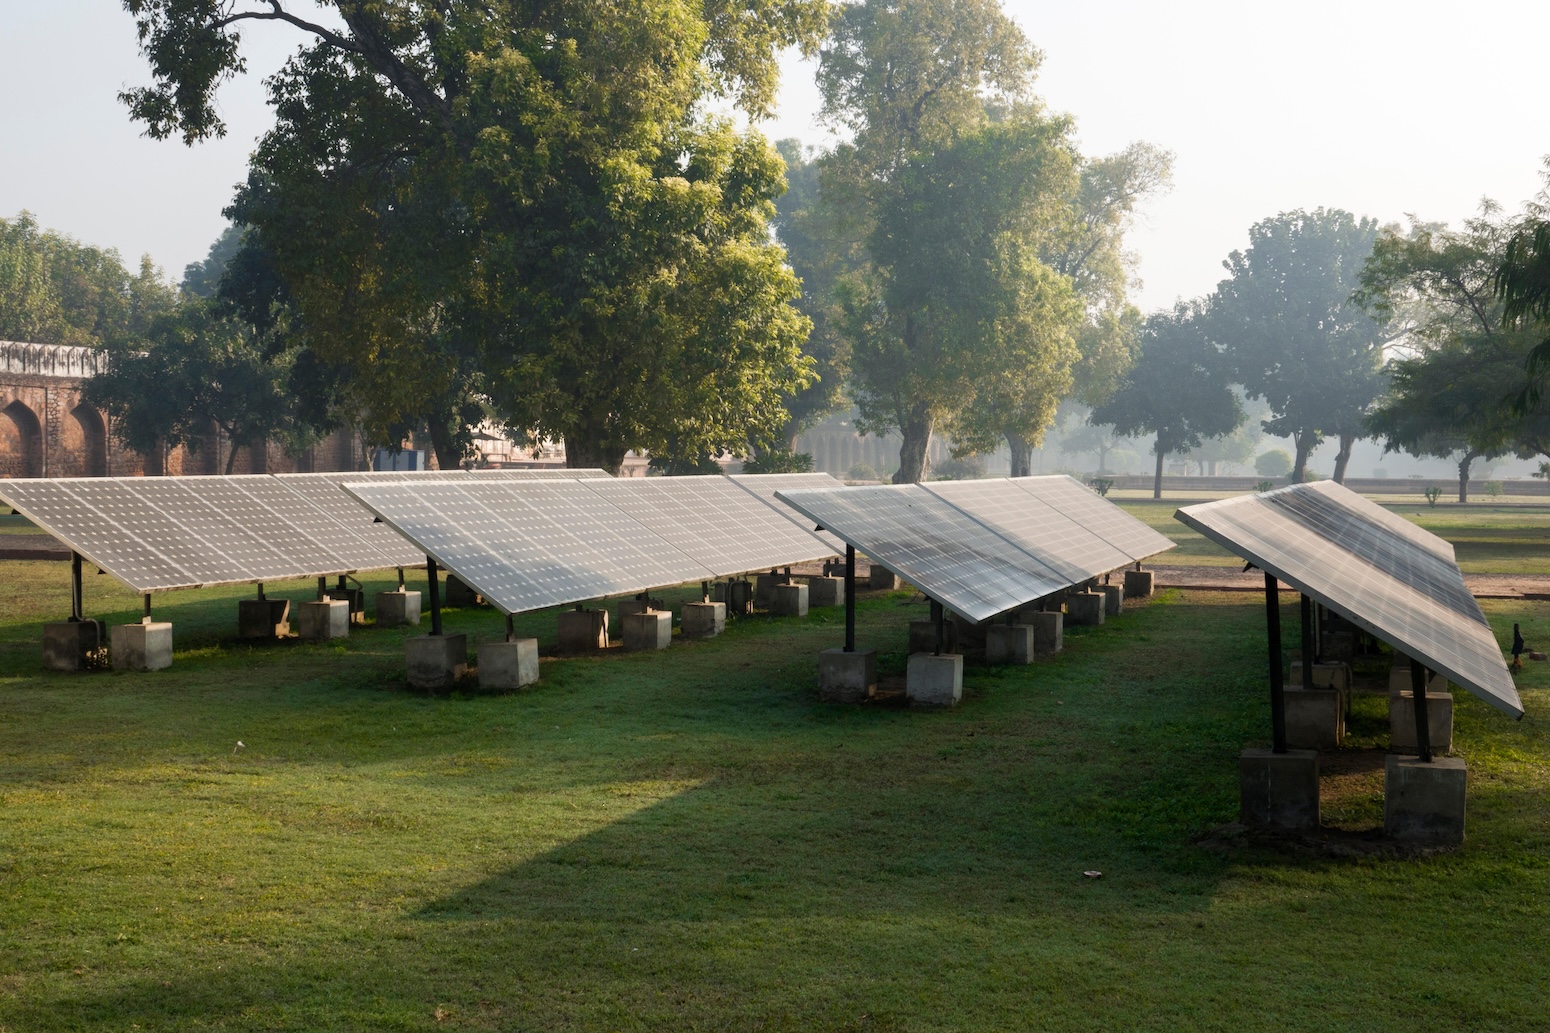
- Solar Generation: Expanded by 44 TWh, backed by 77 gigawatts (GW) of new installed capacity.
- Wind Power: Contributed an additional 13 TWh via 11 GW of new capacity.
- Hydroelectric Power: Recovered from previous drought cycles to add 8 TWh (supported by 5 GW of new capacity).
- Nuclear Energy: Increased by 7 TWh following the addition of 0.6 GW of generation assets.
In total, non-fossil sources supplied 70 TWh of incremental electricity, outpacing net demand growth and displacing the need for expansion in thermal coal generation.
This transformation occurred despite adverse climate events. In early 2026, an intensified El Niño phenomenon delayed the arrival of the Indian monsoon and induced extended regional heatwaves. The resulting surge in domestic air conditioning and agricultural pumping pushed system loads toward historic peaks, yet clean energy capacity repeatedly absorbed the demand spikes.
Supporting Context & Metrics: Sectoral and Regional Breakdown
1. Power Generation and State-Level Trajectories
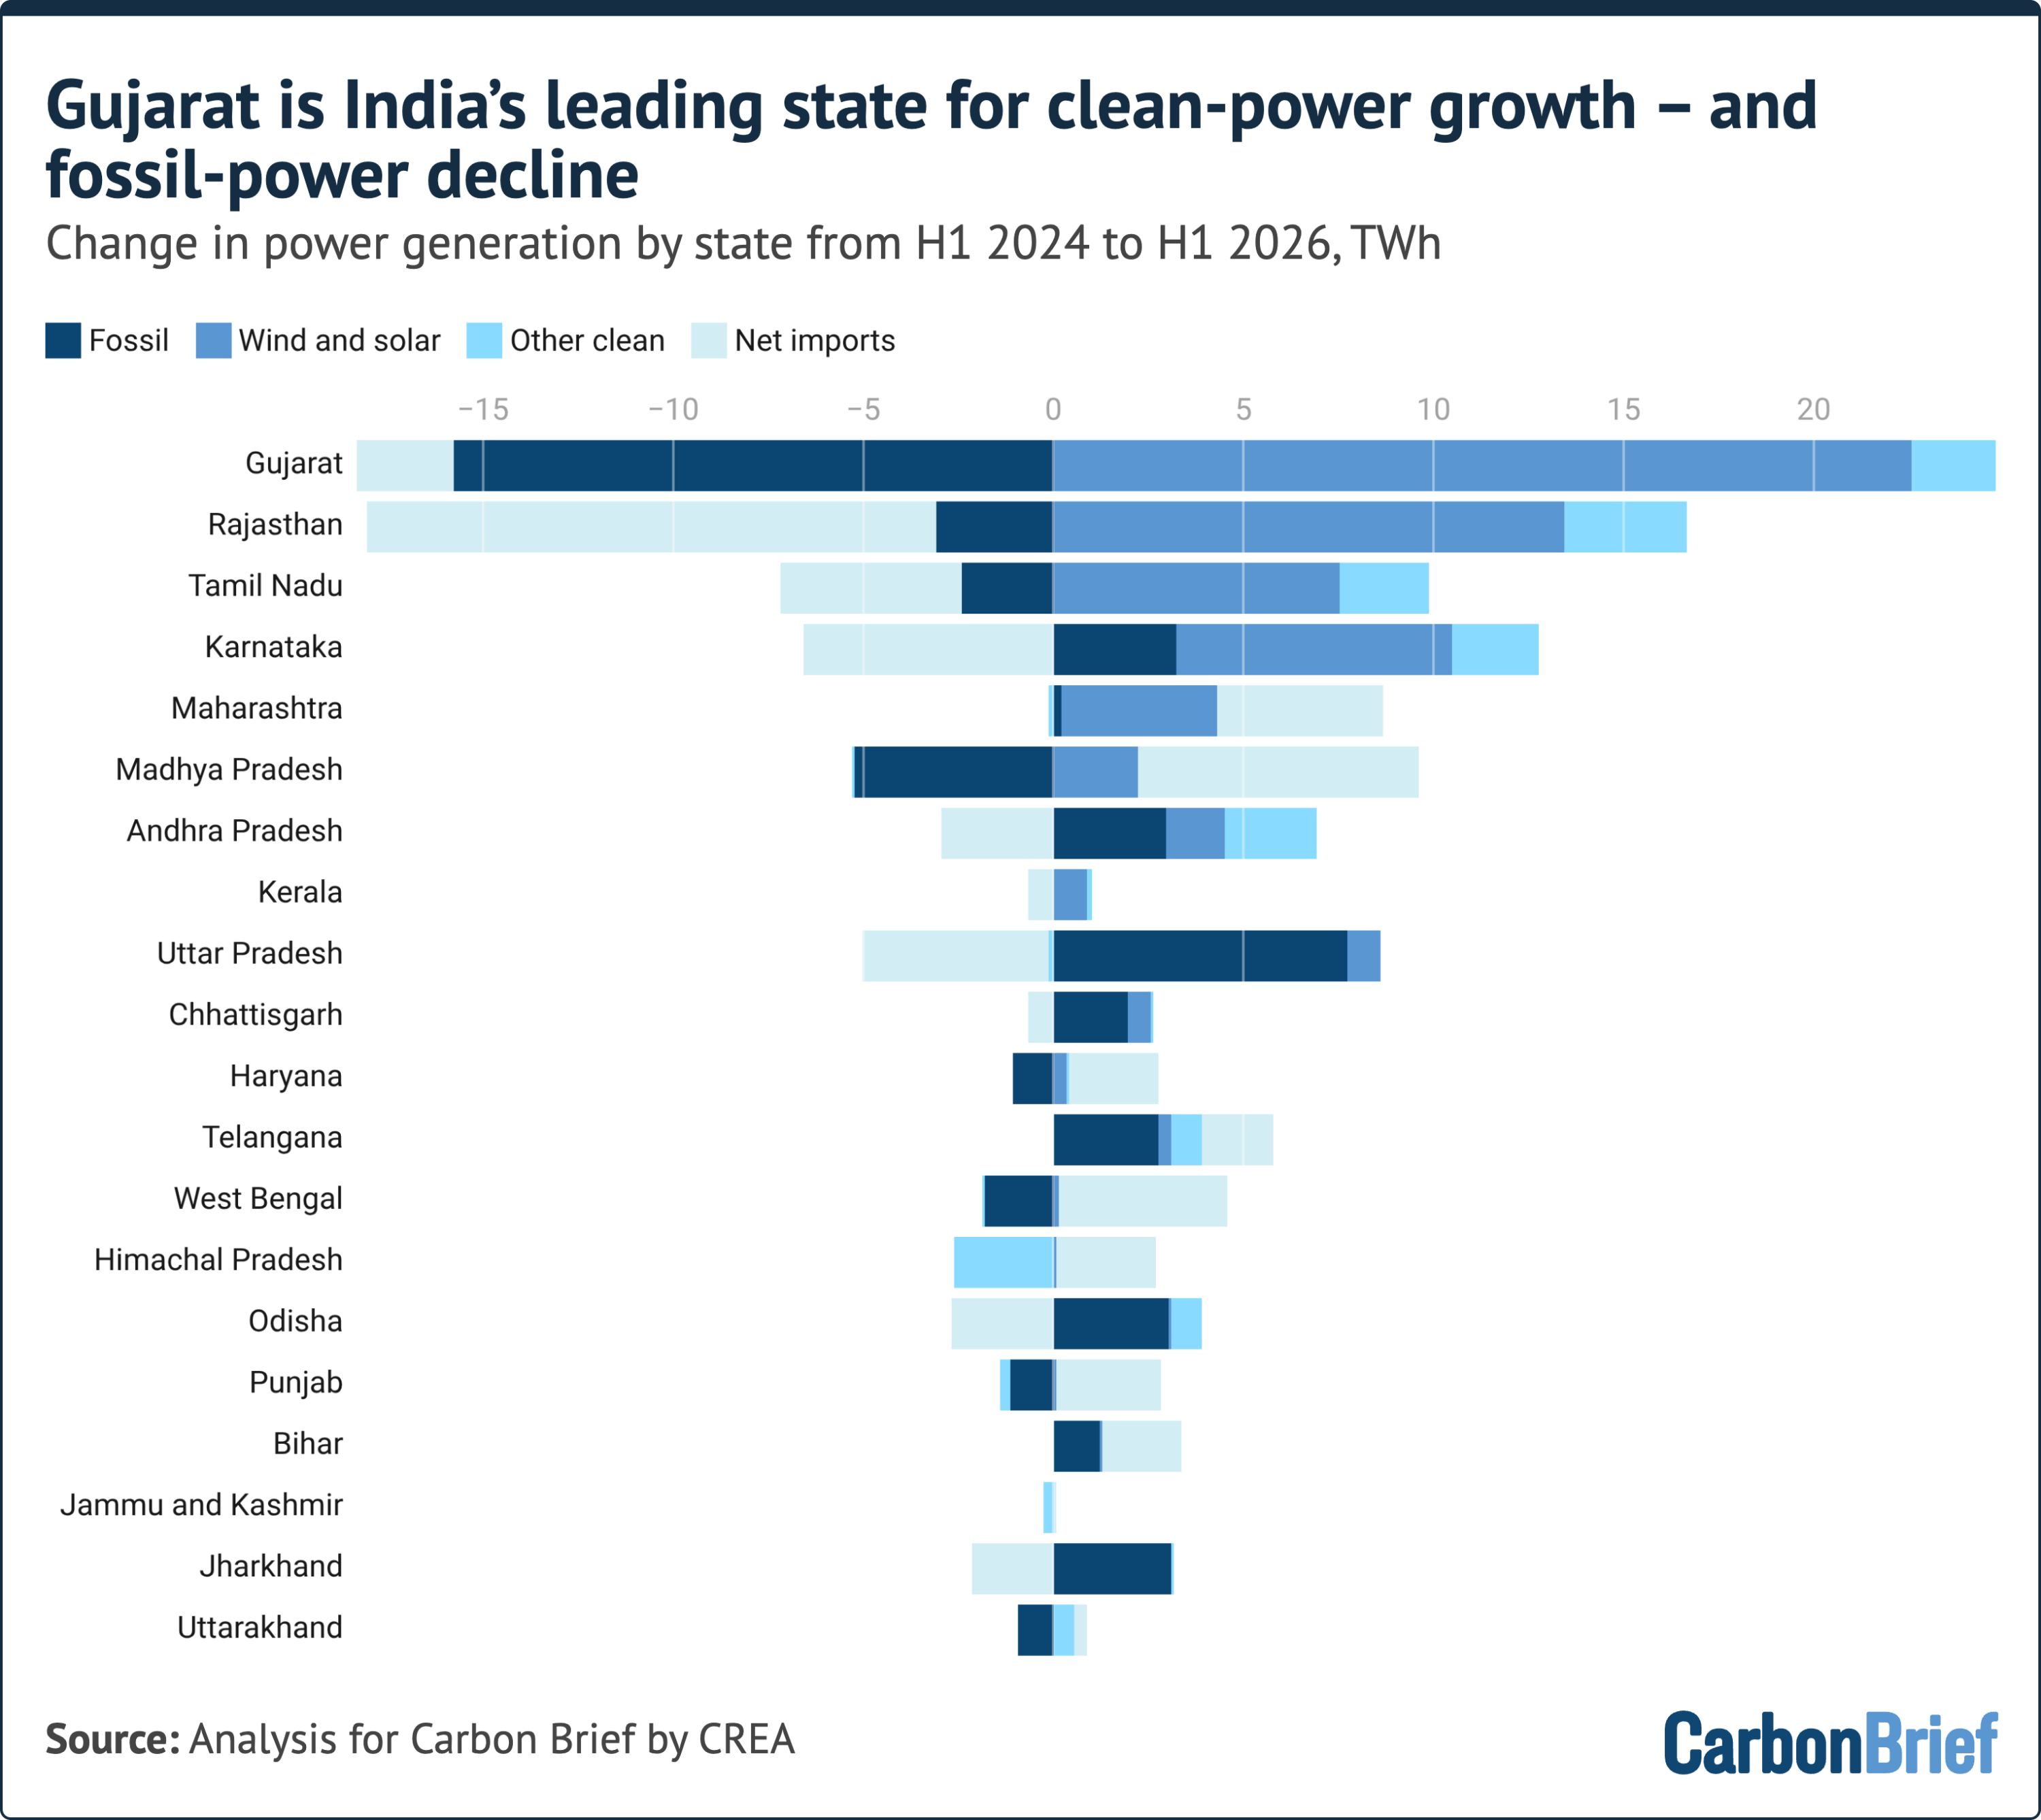
The decline in thermal coal reliance was not uniformly distributed across the subcontinent; it was led by specific industrial states that mobilized renewable capital projects.
- Gujarat: Emerged as the primary driver of India’s power sector transition. Gujarat led all states in both renewable capacity additions (wind and solar) and absolute reductions in thermal fossil generation.
- Rajasthan and Tamil Nadu: Recorded the second and third largest gains in clean power output, effectively displacing local fossil-fuel generation.
- Madhya Pradesh, West Bengal, and Punjab: Reduced local thermal generation through increased net power imports from regional grids rather than local renewable installations.
- Karnataka and Andhra Pradesh: Installed renewable assets at a pace exceeding local demand growth. However, because both states exported substantial green power across state borders, local fossil-fuel generation remained stable or slightly increased to fulfill baseline commitments.
- Maharashtra and Telangana: Exhibited the highest absolute increases in electricity demand, but managed to cover nearly all incremental loads through newly commissioned solar and wind facilities.
                  STATE-LEVEL CLEAN POWER & FOSSIL DYNAMICS
  +-------------------+-----------------------------+-----------------------------+
  | State             | Clean Generation Growth     | Fossil Generation Trajectory|
  +-------------------+-----------------------------+-----------------------------+
  | Gujarat           | Highest nationwide          | Largest absolute reduction  |
  | Rajasthan         | Significant expansion       | Substantial contraction     |
  | Tamil Nadu        | Robust growth               | Moderate contraction        |
  | Maharashtra       | High expansion              | Matched demand (Flat)       |
  | Telangana         | High expansion              | Matched demand (Flat)       |
  | Karnataka/AP      | Surplus renewable growth    | Exported green power/Local  |
  |                   |                             | fossil stable               |
  +-------------------+-----------------------------+-----------------------------+
2. Petroleum and Natural Gas Consumption Trends
India’s total petroleum product consumption contracted by 1.3% year-on-year in H1 2026, following a 0.7% drop during the same period in 2025. This two-year decline in oil and gas reliance offered an unprecedented buffer against foreign energy shocks, particularly during the maritime disruptions in the Strait of Hormuz.
                  H1 2026 PETROLEUM PRODUCT DEMAND VARIATIONS
  +-----------------------+-------------------+-----------------------------------+
  | Product Fuel Type     | Demand YoY Change | Primary Operational Drivers       |
  +-----------------------+-------------------+-----------------------------------+
  | Petrol (Motor Spirit) | +6.9%             | Passenger vehicle mobility;       |
  |                       |                   | offset by ethanol blending        |
  | Diesel (HSD)          | +4.1%             | Freight traffic & agricultural    |
  |                       |                   | water pumping during heatwaves    |
  | Aviation Turbine Fuel | +2.0% (Slowdown)  | Middle East route cancellations   |
  |                       |                   | & elevated

 import costs           |
  | LPG                   | -7.0%             | Strait of Hormuz supply shocks    |
  | Petcoke               | -9.9%             | High import prices; industrial    |
  |                       |                   | shift to coal in cement kilns     |
  | Naphtha               | Contracted        | ~60-100% price hikes; reduced     |
  |                       |                   | petrochemical plant operations    |
  +-----------------------+-------------------+-----------------------------------+
Despite absolute contractions in heavy derivatives, transport fuels showed varied dynamics:
- Diesel Demand: Rose 4.1% due to heavy logistics demand and the use of diesel-powered pumps for agricultural irrigation during monsoon delays.
- Petrol Demand: Bounced back to 6.9% growth, reflecting expanding two-wheeler and personal vehicle ownership. However, national ethanol blending initiatives—which achieved a 20% national blend rate ahead of the 2026 targeted schedule—shaved approximately one full percentage point off total petrol demand growth.
- Electric Vehicle (EV) Adoption: Accelerated via targeted sub-national frameworks, such as the Delhi EV Policy, which targeted two-wheelers, three-wheelers, and high-mileage urban commercial fleets, moderating long-term gasoline demand projections.
3. Industrial Expansion and Non-Power Coal Consumption
The primary structural driver of $CO_2$ emissions growth in H1 2026 was the industrial manufacturing sector, where heavy fossil reliance remains uncoupled from grid electricity.
- Steel and Cement Production: Output jumped 8% and 9% year-on-year, respectively, fueled by domestic institutional investment in real estate and infrastructure development.
- Industrial Coal Use: Direct coal consumption in industries outside of power, steel, and cement surged by 14% year-on-year in H1 2026, up from 3% in H1 2025. This surge was primarily driven by fuel-switching, as natural gas and Liquefied Petroleum Gas (LPG) shortages compelled mid-sized industrial units to revert to solid fossil fuels.
Official Statements & Policy Interventions
The divergence between power grid decarbonization and rising industrial emissions triggered swift policy and regulatory interventions across several government bodies.
Emergency Fuel Authorizations
In response to global gas market volatility following the Strait of Hormuz crisis, the Ministry of Petroleum and Natural Gas, alongside state-level environmental authorities, issued temporary policy relaxations permitting industrial facilities to burn alternative fuels.
State Pollution Control Boards in key industrial regions—including Delhi NCR, Rajasthan, Tamil Nadu, Gujarat, and Maharashtra—issued temporary orders authorizing hospitality, ceramic, textile, and light-manufacturing units to utilize coal, kerosene, biomass pellets, and fuel oil in commercial boilers to maintain operation during gas shortfalls.
Power System Grid Regulations
To address renewable integration challenges, the Central Electricity Authority (CEA) introduced a strategic policy proposal:
"Starting after June 2027, all newly commissioned state-owned solar and wind power generation projects will be subject to a mandatory requirement to include a minimum of two-hour battery energy storage systems (BESS) to retain grid access and reduce peak-hour congestion."
This measure aims to limit curtailment, which affected 5.3 GW of renewable assets due to regional transmission bottlenecks. Projects unable to clear transmission lines faced financial penalties to preserve grid access.
Energy Storage & Strategic Minerals Framework
To meet long-term energy security goals, the Ministry of Power updated its National Electricity Plan objectives:
- Energy Storage Mandates: Targets specify 82 gigawatt-hours (GWh) of grid-scale storage capacity by 2026–27, expanding to 411 GWh by 2031–32. As of May 2026, competitive tenders for 272 GWh (including 142 GWh of pumped hydro and 133 GWh of battery storage) have been deployed.
- Critical Minerals: The Ministry of Coal formally designated domestic coking coal as a "Critical and Strategic Mineral." To reduce reliance on expensive metallurgical coal imports, public and private mining enterprises are investing heavily in domestic coal-washing facilities to refine raw coking coal for blast furnace integration.
Future Outlook & Systemic Challenges
While the zero-growth milestone in coal power generation represents a significant step in India’s energy transition, sustaining this trajectory while decoupling industrial expansion from carbon emissions presents several systemic challenges.
              KEY ARCHITECTURAL CHALLENGES FOR INDIA'S TRANSITION
  +-------------------------------------------------------------------------+
  | Industrial Electrification Disparity                                    |
  |   └── India industrial grid power share: ~17% (2nd lowest in G20)       |
  +-------------------------------------------------------------------------+
  | Capital Investments in Coal Assets                                      |
  |   ├── Thermal Capacity: 43 GW currently under construction             |
  |   └── Coal Gasification: Target to process 100 Mt/year within 4 years   |
  +-------------------------------------------------------------------------+
  | Grid Infrastructure Bottlenecks                                         |
  |   ├── Delayed coal plant thermal flexibility regulations                 |
  |   └── Inter-state transmission curtailments (5.3 GW delayed projects)   |
  +-------------------------------------------------------------------------+
1. The Industrial Electrification Imperative
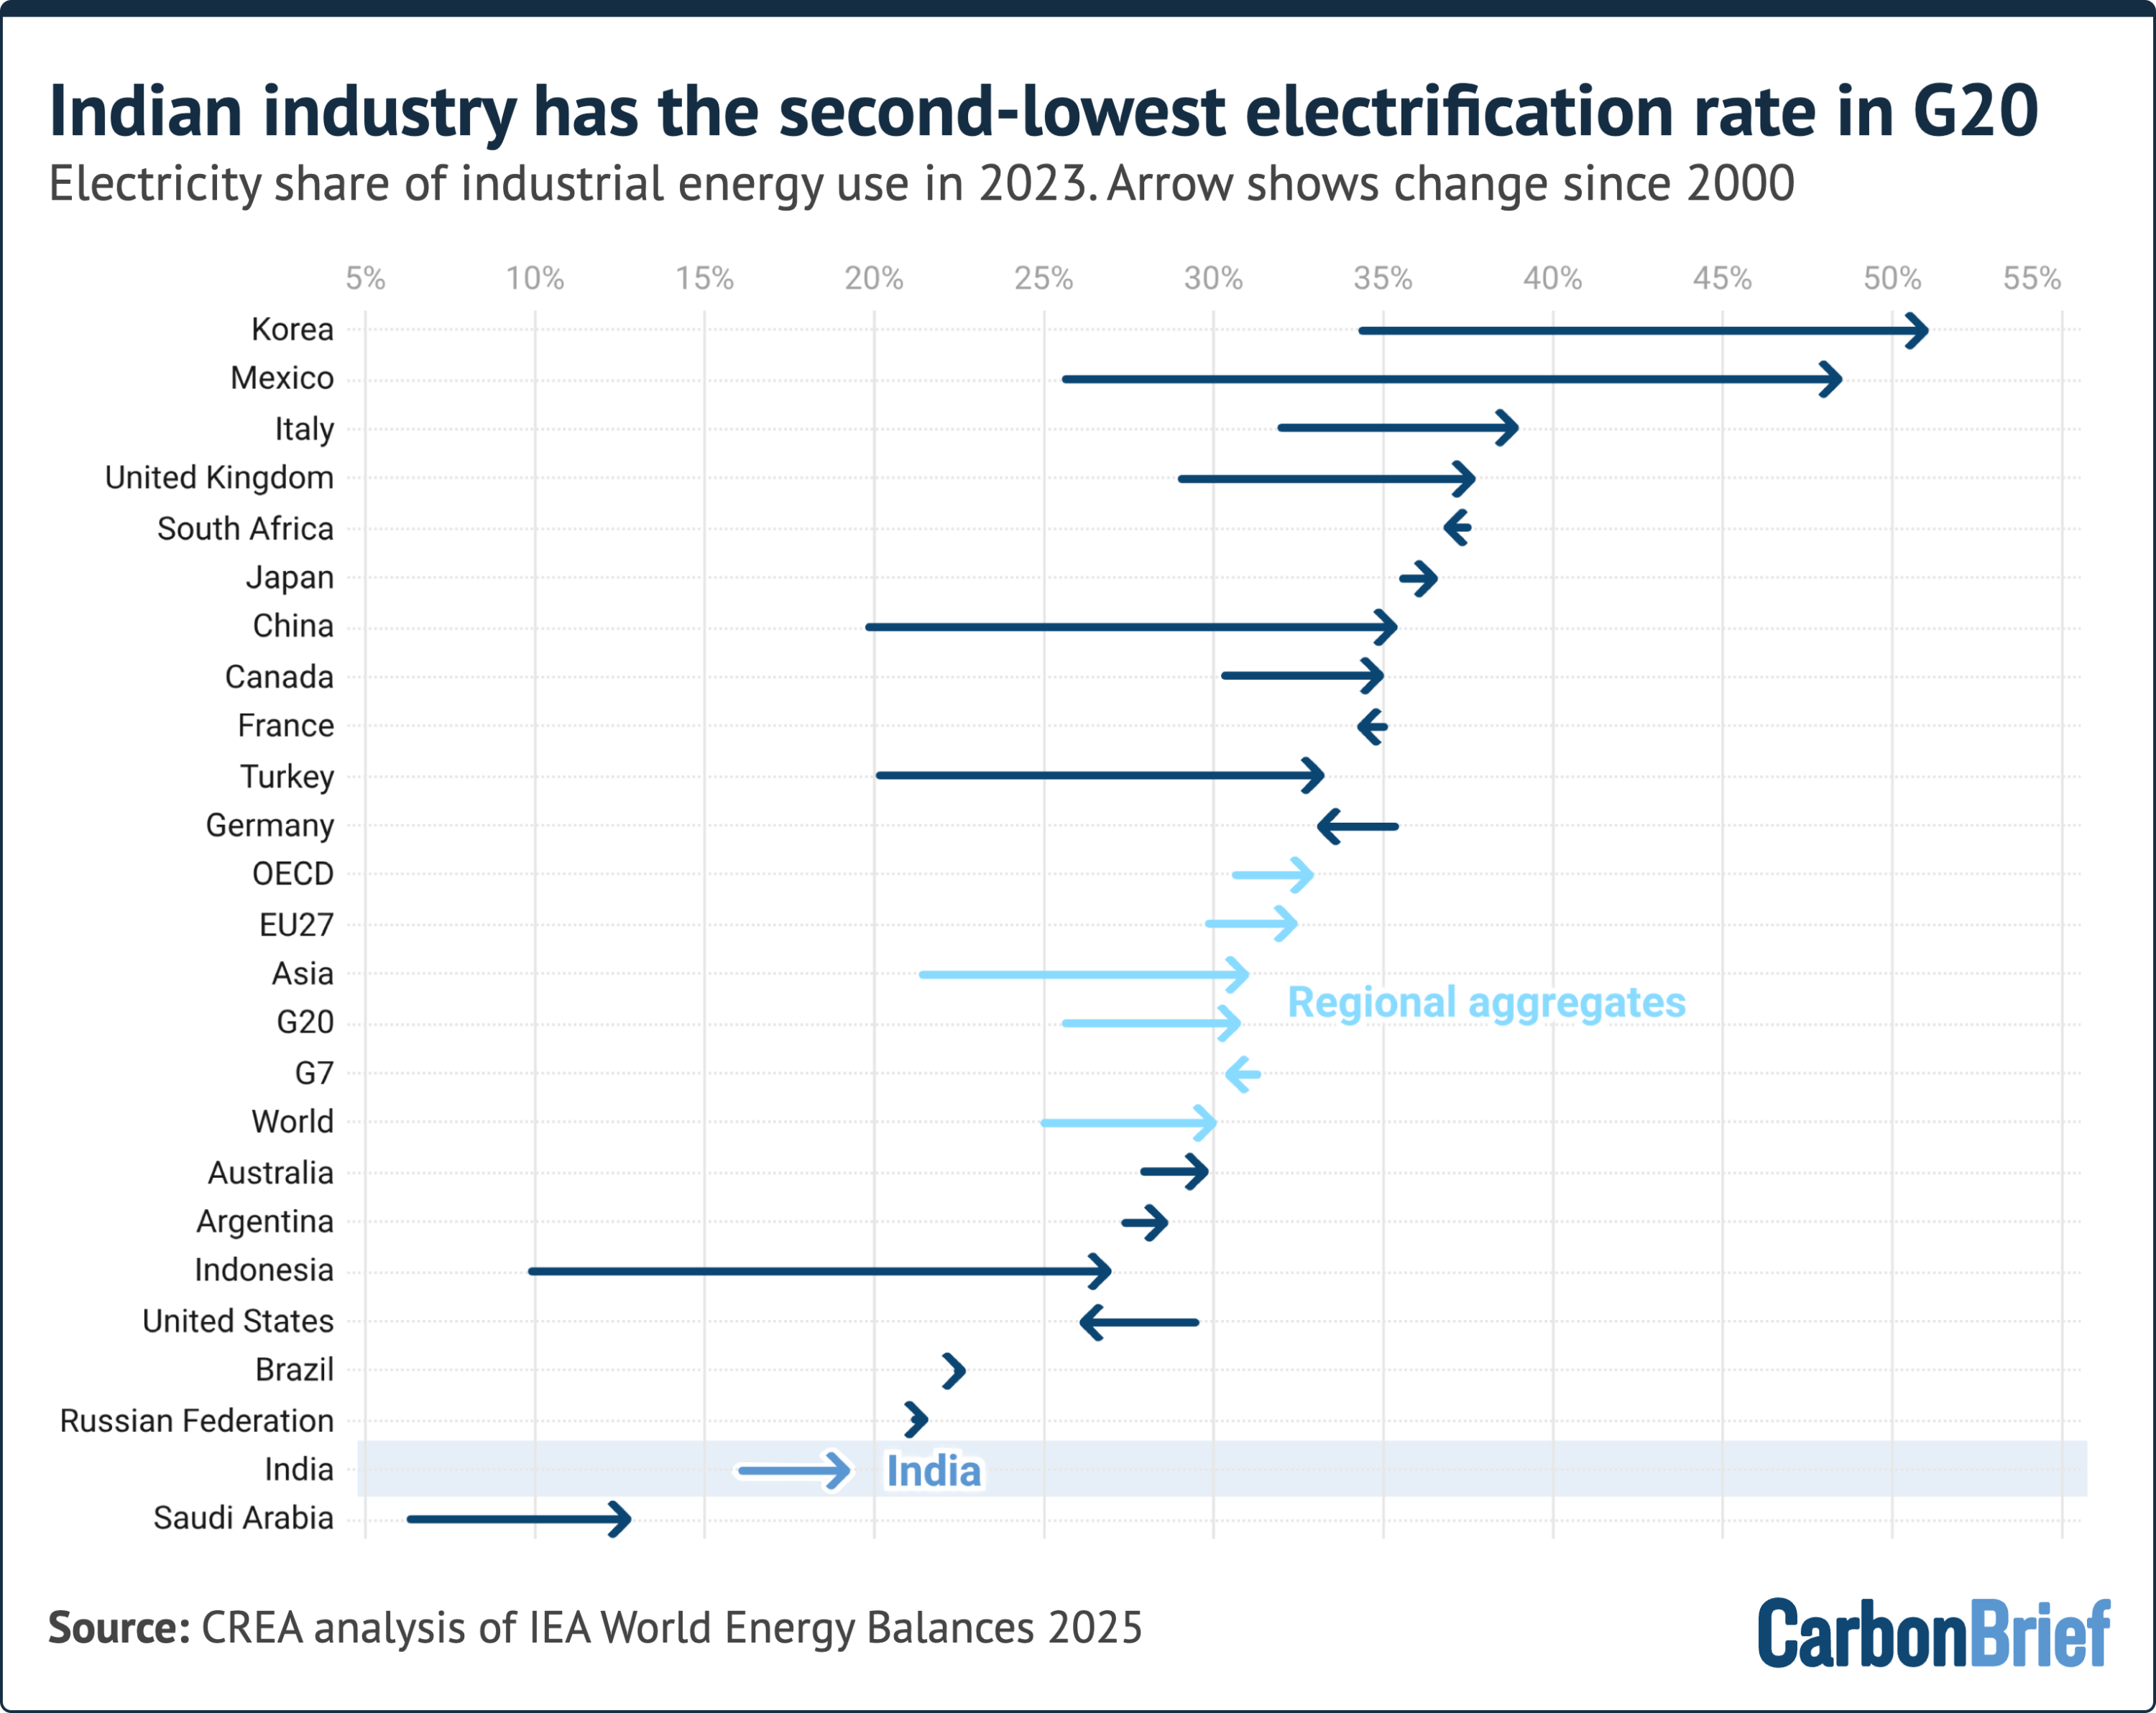
The core challenge facing India’s climate roadmap is its heavy manufacturing sector. India currently records the second-lowest industrial electrification rate among G20 nations, with electricity comprising just 17% of total industrial energy consumption.
       G20 INDUSTRIAL ELECTRIFICATION RATES (ELECTRICITY SHARE % OF TOTAL ENERGY)
  +-------------------------------------------------------------------------+
  | South Korea  | [=========================================] >50%         |
  | World Avg    | [=======================] ~28%                           |
  | INDIA        | [=================] 17%                                  |
  | Saudi Arabia | [=======] <10%                                           |
  +-------------------------------------------------------------------------+
Unless industrial electrification accelerates through technologies like electric arc furnaces, industrial heat pumps, and green hydrogen integration, increases in heavy manufacturing output will continue to translate directly into higher thermal emissions, offsetting progress made in the power grid.
2. Capital Lock-in in Fossil Fuel Assets
Despite clean power covering incremental electricity demand, significant capital investments continue to flow into long-term fossil fuel infrastructure:
- Thermal Coal Power: Approximately 43 GW of new coal-fired power capacity remains under construction to meet projected evening peak loads.
- Coal Gasification Initiatives: The government is pursuing plans to establish 100 million metric tonnes of annual coal gasification capacity within four years to convert domestic coal into chemical feedstocks and synthetic gas, aiming to substitute imported natural gas and petrochemical imports.
- Coking Coal & Mining Expansion: New mine openings and coal washery investments risk locking in high carbon intensities across industrial supply chains for decades.
3. Grid Flexibility and Infrastructure Bottlenecks
Sustaining the expansion of clean energy will require modernization of India’s power distribution networks. Regulatory delays in finalizing a national thermal flexibility plan—which requires existing coal plants to ramp down to 40-50% of capacity during periods of high solar generation—have contributed to localized renewable curtailment.
Addressing these issues will require rapid expansion of inter-state transmission corridors, timely completion of pumped hydro projects, and wide-scale adoption of grid-scale battery storage.
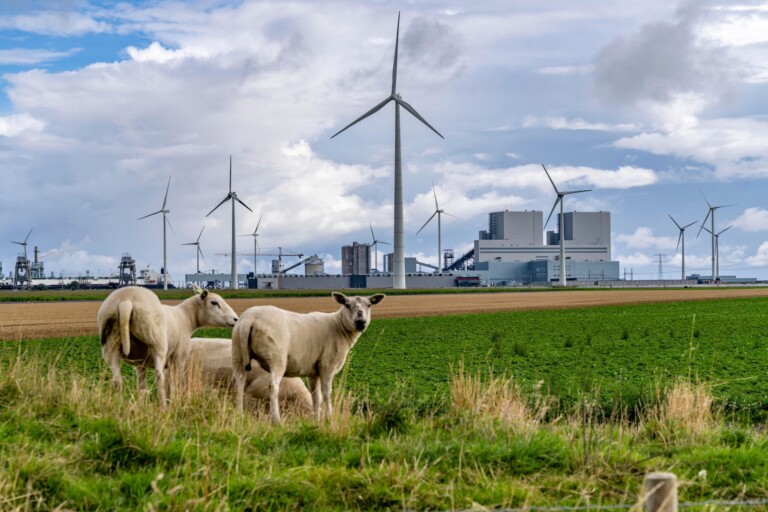
India’s first-half 2026 data illustrates a dual narrative: clean energy technology is successfully managing growth in power sector emissions, but addressing emissions across heavy industry, transportation, and raw materials processing will require expanding decarbonization strategies beyond the electricity grid.