Executive Overview
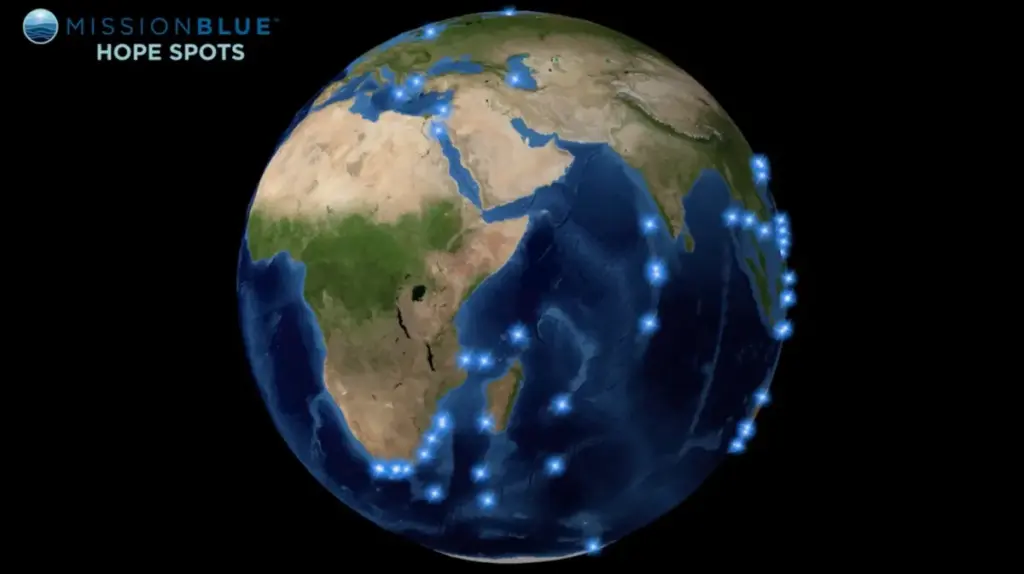
As the global community faces a narrowing window to arrest the degradation of marine ecosystems, precision data and spatial intelligence have emerged as foundational weapons in the fight for ocean survival. In a major technological and conservation milestone unveiled at the Esri User Conference, the renowned ocean conservation foundation Mission Blue—founded by legendary oceanographer Dr. Sylvia Earle—has launched a groundbreaking geospatial mapping initiative. Utilizing Esri’s industry-standard ArcGIS platform, this dynamic visualization tool maps the global overlap between Mission Blue Hope Spots® and existing Marine Protected Areas (MPAs).
The initiative moves beyond static cartography, translating complex, multifaceted marine data into a living, interactive narrative. By integrating data from the Marine Protection Atlas (MPAtlas) and global databases like the World Database on Protected Areas (WDPA), the new mapping framework does not merely show where ocean protection exists; it evaluates the strength of that protection. In an era where "paper parks"—protected areas that exist legally on maps but lack enforcement or genuine restriction against industrial extraction—threaten to skew conservation metrics, this distinction is revolutionary.
The overarching goal is both urgent and clear: to provide policymakers, scientists, Indigenous communities, and local "Hope Spot Champions" with the empirical clarity needed to support the international "30×30" initiative—the global commitment to protect at least 30% of the world’s ocean by 2030. This article explores the technological architecture, ecological imperatives, strategic implications, and future outlook of Mission Blue’s partnership with Esri, charting a course from raw spatial data to actionable global stewardship.
Detailed Chronology: From Concept to Plenary Debut
The journey toward this advanced geospatial integration reflects the evolution of marine conservation from localized activism to a globally coordinated, data-driven movement.
Phase I: The Birth of the Hope Spot Network
Founded in 2009, Mission Blue set out to ignite public support for a global network of marine areas critical to the health of the planet. Dr. Sylvia Earle envisioned Hope Spots not as isolated sanctuaries, but as vital nodes in an interconnected network of hope, science, and action. Initially tracked through regional studies, ecological surveys, and grassroots advocacy, identifying these areas required synthesizing vast amounts of biological and cultural data. However, as the network expanded to encompass hundreds of diverse locations worldwide—ranging from the high-biodiversity coral reefs of the Coral Triangle to the carbon-storing kelp forests of temperate waters—managing and visualizing this sprawling data ecosystem became a monumental logistical challenge.
Phase II: The Integration of Geospatial Intelligence
Recognizing that traditional mapping methods were insufficient to capture the dynamic, fluid nature of marine environments, Mission Blue turned to modern geospatial technology. By partnering with Esri, the organization integrated its spatial datasets into the ArcGIS platform. This technological leap allowed conservationists to transition from flat, two-dimensional maps to multi-layered, interactive spatial analyses. For the first time, researchers could visualize Hope Spots alongside dynamic oceanographic layers, human impact metrics, and shipping lanes.
Phase III: The 2026 Esri User Conference Plenary Debut
The culmination of years of data harmonization, spatial modeling, and cross-platform synthesis occurred at the 2026 Esri User Conference Plenary Session. On this global stage, the new Mission Blue map was officially presented to a vast audience of geospatial professionals, technologists, scientists, and environmental leaders. The presentation demonstrated how ArcGIS can ingest disparate global datasets—such as the rigorous protection classifications maintained by the MPAtlas—and render them into intuitive, high-impact visual stories. The debut marked a watershed moment, bridging the gap between high-tech geographic information systems (GIS) and frontline marine conservation.
Supporting Context & Metrics: Unpacking the Data Layer
To fully understand the significance of Mission Blue’s new mapping initiative, one must examine the underlying metrics, classifications, and ecological realities that inform the platform.
Defining Hope Spots
Hope Spots are not designated by a single bureaucratic metric; rather, they are chosen based on a holistic set of ecological, cultural, and strategic criteria. They include:
- Extraordinary Biodiversity: Ecosystems hosting rare, endemic, or highly concentrated marine species.
- Essential Habitats & Migration Corridors: Critical staging grounds for endangered megafauna, such as whales, sea turtles, and sharks.
- Carbon-Rich Ecosystems: Blue carbon habitats—including mangroves, seagrass meadows, and salt marshes—that sequester atmospheric carbon at rates exponentially higher than terrestrial forests.
- Cultural & Local Leadership Significance: Regions where indigenous traditions or community-led conservation frameworks are driving sustainable management practices.
The Critical Nuance of MPA Protection Levels
One of the most valuable aspects of the new Esri-powered mapping tool is its integration with the Marine Protection Atlas. Historically, governments and international bodies reported ocean conservation progress based purely on coverage area—the total percentage of territorial waters or Exclusive Economic Zones (EEZs) designated as MPAs. However, conservation scientists have long warned that this metric is dangerously misleading.
An MPA that permits bottom trawling, oil and gas exploration, or intensive industrial fishing provides little to no ecological benefit, effectively functioning as a "paper park." The MPAtlas classifies marine protected areas across a spectrum of protection levels:
- Fully Protected: Areas where all extractive and destructive activities are strictly prohibited.
- Highly Protected: Areas allowing only minimal, non-industrial extractive uses that do not compromise the core ecosystem.
- Lightly / Minimally Protected: Areas permitting significant levels of fishing, aquaculture, or industrial activity.
- Unimplemented / Unknown: Areas designated on paper but lacking management plans or enforcement infrastructure.
By overlaying Hope Spots with these granular classifications, Mission Blue’s maps instantly expose the true efficacy of existing governance. Viewers can see precisely where a biologically rich Hope Spot intersects with a fully protected marine reserve versus where it languishes under nominal, toothless partial protections.
The 30×30 Imperative
The global scientific consensus holds that humanity must secure full or high protection for at least 30% of the global ocean by 2030 to stave off catastrophic biodiversity collapse and stabilize planetary climate systems. Yet, as spatial data repeatedly demonstrates, achieving 30% coverage is vastly different from achieving 30% effective conservation. Mission Blue’s spatial analysis serves as a diagnostic tool for the 30×30 movement, helping stakeholders identify where existing MPAs can be upgraded, where new protections must be established, and how local community actions scale up to meet international targets.
Official Perspectives and Expert Insights
The convergence of geographic information science and grassroots ocean advocacy has drawn high praise from leaders across both the tech and conservation sectors.
Dr. Sylvia Earle, President and Chairman of Mission Blue, has repeatedly emphasized the psychological and strategic power of visualization in conservation. Reflecting on the philosophy behind the initiative, Earle notes that humanity cannot protect what it does not understand, and people rarely care about what they cannot see. By translating invisible underwater ecosystems and complex legislative boundaries into stark, accessible visual narratives, the platform bridges the empathy gap between land-dwelling humans and the marine realm.
Geospatial analysts and conservation technologists working with Esri’s ArcGIS platform highlight the democratization of data as the project’s primary triumph. In previous decades, high-level spatial analysis was confined to well-funded academic institutions and government agencies. By utilizing ArcGIS, Mission Blue empowers local Hope Spot Champions—often fishermen, indigenous leaders, and grassroots activists with limited technical resources—to harness enterprise-grade mapping tools. These champions can use the platform to validate local ecological claims, lobby regional policymakers, and present undeniable visual evidence of threats facing their marine territories.
Furthermore, partner organizations such as the Marine Conservation Institute (the driving force behind MPAtlas) and the UN Environment Programme World Conservation Monitoring Centre (UNEP-WCMC) have lauded the initiative for bridging the gap between static databases and dynamic application. Data that once sat dormant in sprawling spreadsheets is now animated within a living spatial canvas, driving accountability among sovereign nations that claim to meet conservation quotas while permitting industrial exploitation within their borders.
Future Outlook: Turning Insight Into Action
As the countdown to 2030 accelerates, the trajectory of marine conservation will increasingly be dictated by data integration, transparency, and local empowerment. The deployment of Mission Blue’s new mapping platform on the Esri ArcGIS framework establishes a new benchmark for how environmental organizations leverage technology.
Expanding the Geospatial Frontier
Looking forward, Mission Blue plans to continuously update and expand its mapping capabilities. Future iterations aim to incorporate real-time or near-real-time data streams, including satellite tracking of industrial fishing vessels (via systems like Global Fishing Watch), benthic habitat degradation monitoring, and ocean temperature anomaly tracking. By layering climate stress indicators—such as marine heatwaves and ocean acidification metrics—over Hope Spot boundaries, conservationists will be able to predict ecological stress points before catastrophic die-offs occur.
Strengthening Local Stewardship and Policy
Technology alone cannot save the oceans, but it provides the undeniable truth required to mobilize political will. The maps serve as a dual-purpose instrument:
- For Policymakers: They offer an uncompromising audit of where national marine policies are succeeding and where regulatory loopholes are allowing biodiversity loss to continue unchecked.
- For Local Champions: They provide a megaphone backed by rigorous science, allowing communities to demonstrate how their localized stewardship plugs into a grand, planetary defense network.
A Call to Action
Ultimately, Mission Blue’s integration with Esri’s ArcGIS platform transforms abstract environmental data into a compelling, unavoidable call to action. The maps strip away ambiguity, revealing precisely where marine life is thriving under robust protection, where ecosystems remain vulnerable to exploitation, and where the global community must focus its capital, energy, and political capital over the critical years ahead.
As the blue planet faces unprecedented industrial pressures, tools like these ensure that the global movement to save the ocean is guided not by guesswork, but by spatial precision, ecological truth, and unwavering collective resolve.