By Automotive Industry Desk
Published: April 2026
Executive Overview
The automotive landscape in the United States is undergoing a subtle yet profound structural transformation. For years, the single greatest barrier to widespread electric vehicle (EV) adoption has been the formidable cost of entry. While early adopters and environmentally conscious consumers were willing to pay a hefty green premium, mainstream buyers balked at the price tags associated with battery-electric technology.
Today, that narrative is shifting dramatically. According to comprehensive new data compiled by Kelley Blue Book (KBB), electric vehicle transaction prices in the US are continuing their downward trajectory, driving the affordability gap between EVs and traditional internal combustion engine (ICE) vehicles to the narrowest margin ever recorded in automotive history.
In March, the average transaction price (ATP) for a new EV dropped to $54,508. This represents a 2.8% decline year-over-year and marks the third consecutive month of price contractions. When compared to February figures—which themselves underwent downward revisions—prices slipped an additional 0.7%. Consequently, the price premium for purchasing an electric vehicle instead of a standard gas-powered car has shrunk to approximately $5,800.
This convergence is not happening by accident. Driven by aggressive manufacturer incentives, maturing supply chains, and mounting competitive pressure from industry giants like Tesla, the EV market is entering a new era of pragmatic consumer pricing. However, this transition is complex. While lower price points and rich incentives are successfully breathing momentum into month-over-month sales figures, legacy market headwinds—including shifting federal policies and fluctuating year-over-year demand—continue to create a nuanced and evolving sales landscape.
Detailed Chronology of the 2026 Price Correction
To fully understand how the market reached this historic juncture, it is necessary to examine the immediate timeline of price adjustments that defined the opening quarter of 2026.

January to March: A Consistent Downward Trend
The first quarter of the year established a clear pattern of deflationary pressure within the EV segment. While January initiated slight corrections following the holiday push, February accelerated the trend. KBB’s revised data for February showed that initial estimates underreported the extent of price shedding across dealerships nationwide.
By March, the downward momentum solidified into a formalized trend. The average transaction price of $54,508 was supported by steady month-over-month reductions across nearly all major automotive brands operating in the domestic EV space. This consecutive three-month decline has systematically erased the inflationary spikes witnessed during post-pandemic supply chain crunches, bringing high-tech personal transportation closer to the financial reach of the average American household.
The Role of Market Leader Tesla
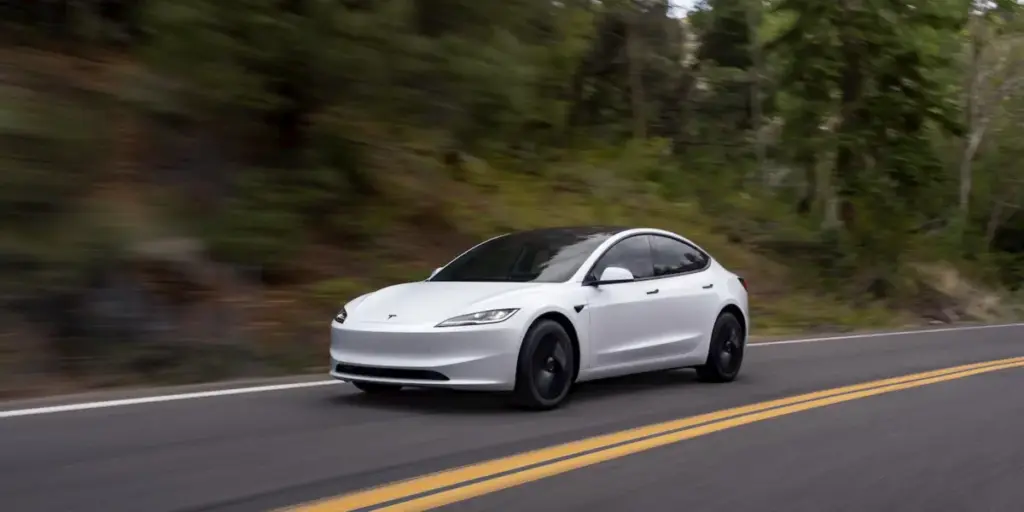
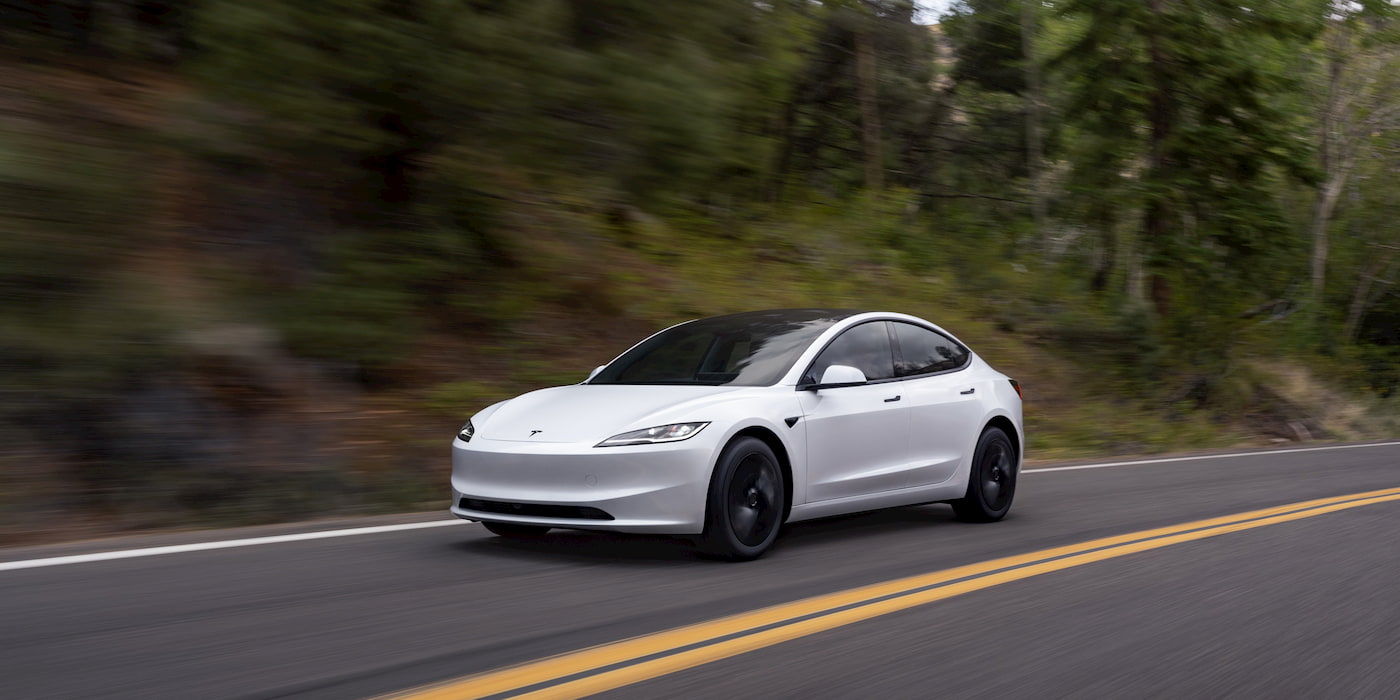
No discussion of US EV pricing is complete without analyzing the gravitational pull of Tesla. As the market share leader, Tesla’s pricing strategies act as a bellwether for the entire industry.
In March, Tesla’s average transaction price settled at $53,421. This figure represents a 2.6% decrease compared to March 2025 and a 1.2% reduction from February 2026 levels. To maintain its volume and stimulate interest, Tesla strategically escalated its incentive spending, pushing manufacturer discounts to 12.3% of its average transaction price.
Yet, Tesla’s ledger tells a dual story. Cox Automotive estimates place Tesla’s US sales down 8.4% year-over-year for March, reflecting lingering challenges against a swelling field of competing domestic and international EV offerings. However, a micro-analysis reveals a different recovery vector: on a month-over-month basis, Tesla deliveries climbed 6.1% compared to February. This marks the second consecutive month of sequential delivery gains, suggesting that lower prices and increased incentive structures are successfully thawing frozen consumer demand.
Supporting Context & Metrics: Decoding the Numbers
The narrowing affordability gap and the mechanics behind modern EV transactions rely on a delicate interplay of sticker prices, dealer markdowns, and manufacturer incentives.
The $5,800 Gap: A Historic Milestone
For years, the "EV premium"—the extra cost required to purchase an electric car over its gas-powered equivalent—hovered well above $10,000, and at times, exceeded $15,000 during the height of the post-pandemic supply chain crisis.
As of March data, that premium has contracted to approximately $5,800. While a $5,800 difference still represents a meaningful sum for budget-conscious buyers, it is a threshold that can often be offset over a vehicle’s lifecycle through lower fueling costs (electricity versus gasoline) and significantly reduced maintenance requirements (fewer moving parts, no oil changes, and less brake wear due to regenerative braking).
The Heavy Lifting of Manufacturer Incentives
Behind the drop in actual transaction prices lies an aggressive surge in promotional spending. In March, the average incentive package for a new electric vehicle climbed to an astonishing 14.6% of the total transaction price. In monetary terms, this translates to nearly $8,000 in direct consumer savings per vehicle.
To put this in perspective:
- EV Incentive Average: 14.6% of ATP (~$8,000 per vehicle)
- February 2026 Incentive Average: 14.2% of ATP
- Year-Over-Year (March 2025) Incentive Average: 12.9% of ATP
- Broader Industry Average: EV incentives are currently running at more than double the average incentive spending seen across the wider automotive market.
These aggressive subsidies are largely designed to counter the psychological and financial friction caused by the phased loss or tightening of certain federal tax credits, ensuring that showrooms continue to move inventory despite legislative headwinds.
Official Statements and Industry Analysis
Industry analysts and automotive economists point to these metrics as evidence of a maturing market entering its inevitable consolidation phase.

"We are witnessing the transition from a novelty market driven by early adopters to a utility market driven by pragmatists," notes a senior automotive market researcher. "When the price gap drops below the psychological $6,000 threshold, you capture an entirely new demographic of buyers who previously ran the numbers and decided the math didn’t work in their favor."
Cox Automotive and Kelley Blue Book analysts emphasize that automakers can no longer rely on high margins per unit produced; instead, volume strategy, manufacturing efficiencies (such as mega-castings and streamlined battery architectures), and targeted financial incentives are now the primary tools for survival and growth.
Furthermore, financial analysts note that while federal tax credit frameworks have experienced turbulence and policy reevaluations, automakers have effectively absorbed much of that shock by reallocating capital into internal incentive pools. By lowering MSRPs and ramping up cash-back offers or subsidized lease programs, manufacturers are absorbing the cost to keep adoption curves pointing upward.
Future Outlook: What Lies Ahead for the EV Market
As the automotive industry looks toward the remainder of 2026 and beyond, several critical questions remain regarding price sustainability, infrastructure expansion, and long-term consumer adoption.
Will Prices Continue to Fall?
While the past three months have demonstrated consistent price deflation, economists warn that a permanent, unbridled slide in EV prices is unlikely. Battery raw material costs—specifically lithium, nickel, and cobalt—have stabilized significantly compared to their historic peaks, but inflationary pressures in labor and electronics remain.
However, as more automakers introduce next-generation, lower-cost platforms (aimed at the sub-$30,000 to $40,000 price band), the mix of vehicles sold will naturally pull average transaction prices down further. The introduction of affordable compact crossovers and entry-level sedans over the next 18 to 24 months is expected to accelerate the closure of the gas-versus-electric affordability gap.

The Broader Ecosystem: Solar, Home Energy, and Total Cost of Ownership
As vehicle purchase prices approach parity with ICE cars, consumer focus is increasingly shifting toward the total cost of ownership (TCO). For many EV owners, the financial equation extends beyond the dealership driveway into home energy management.
Integrating home solar generation and smart residential charging systems has become a primary strategy for drivers looking to maximize their return on investment. Programs that connect prospective EV buyers with pre-vetted, competitive residential solar installations—such as those facilitated through platforms like EnergySage—allow consumers to offset their home and vehicle charging energy costs by 20% to 30%, neutralizing fuel price volatility entirely.
Conclusion
The latest data from Kelley Blue Book signals a watershed moment for the American automotive sector. By shrinking the price gap to a historic low of $5,800 and pumping nearly $8,000 in average incentives into every transaction, automakers are actively dismantling the financial barriers that once slowed the green transition. While challenges remain—particularly in year-over-year sales normalization and shifting regulatory frameworks—the trajectory is unmistakable: electric vehicles are rapidly becoming the economically rational choice for mainstream America.