Executive Overview
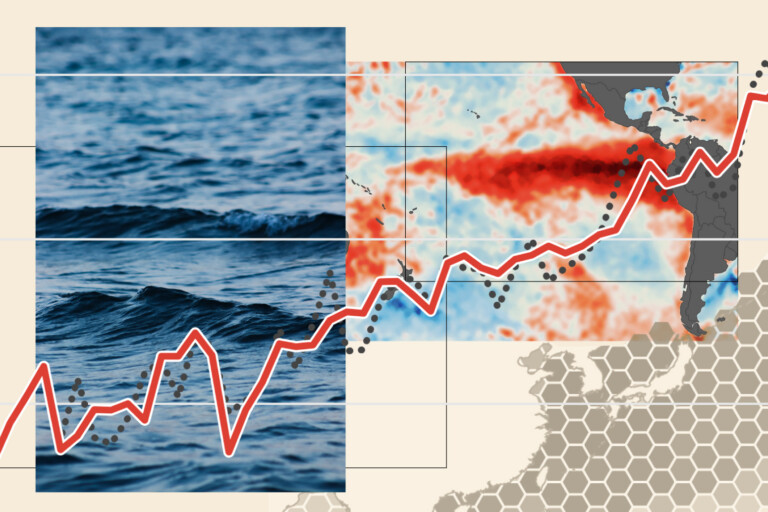
An extraordinarily intense climate event is unfolding across the equatorial Pacific Ocean. The 2026 "super El Niño"—a massive climate phenomenon characterized by anomalous warming of tropical Pacific waters—has formally entered record-breaking territory. Data reveals that sea surface temperatures in the critical tropical Pacific monitoring zones have surged past all previously recorded daily benchmarks, exceeding the historic peak established during the devastating El Niño of 2015–2016.
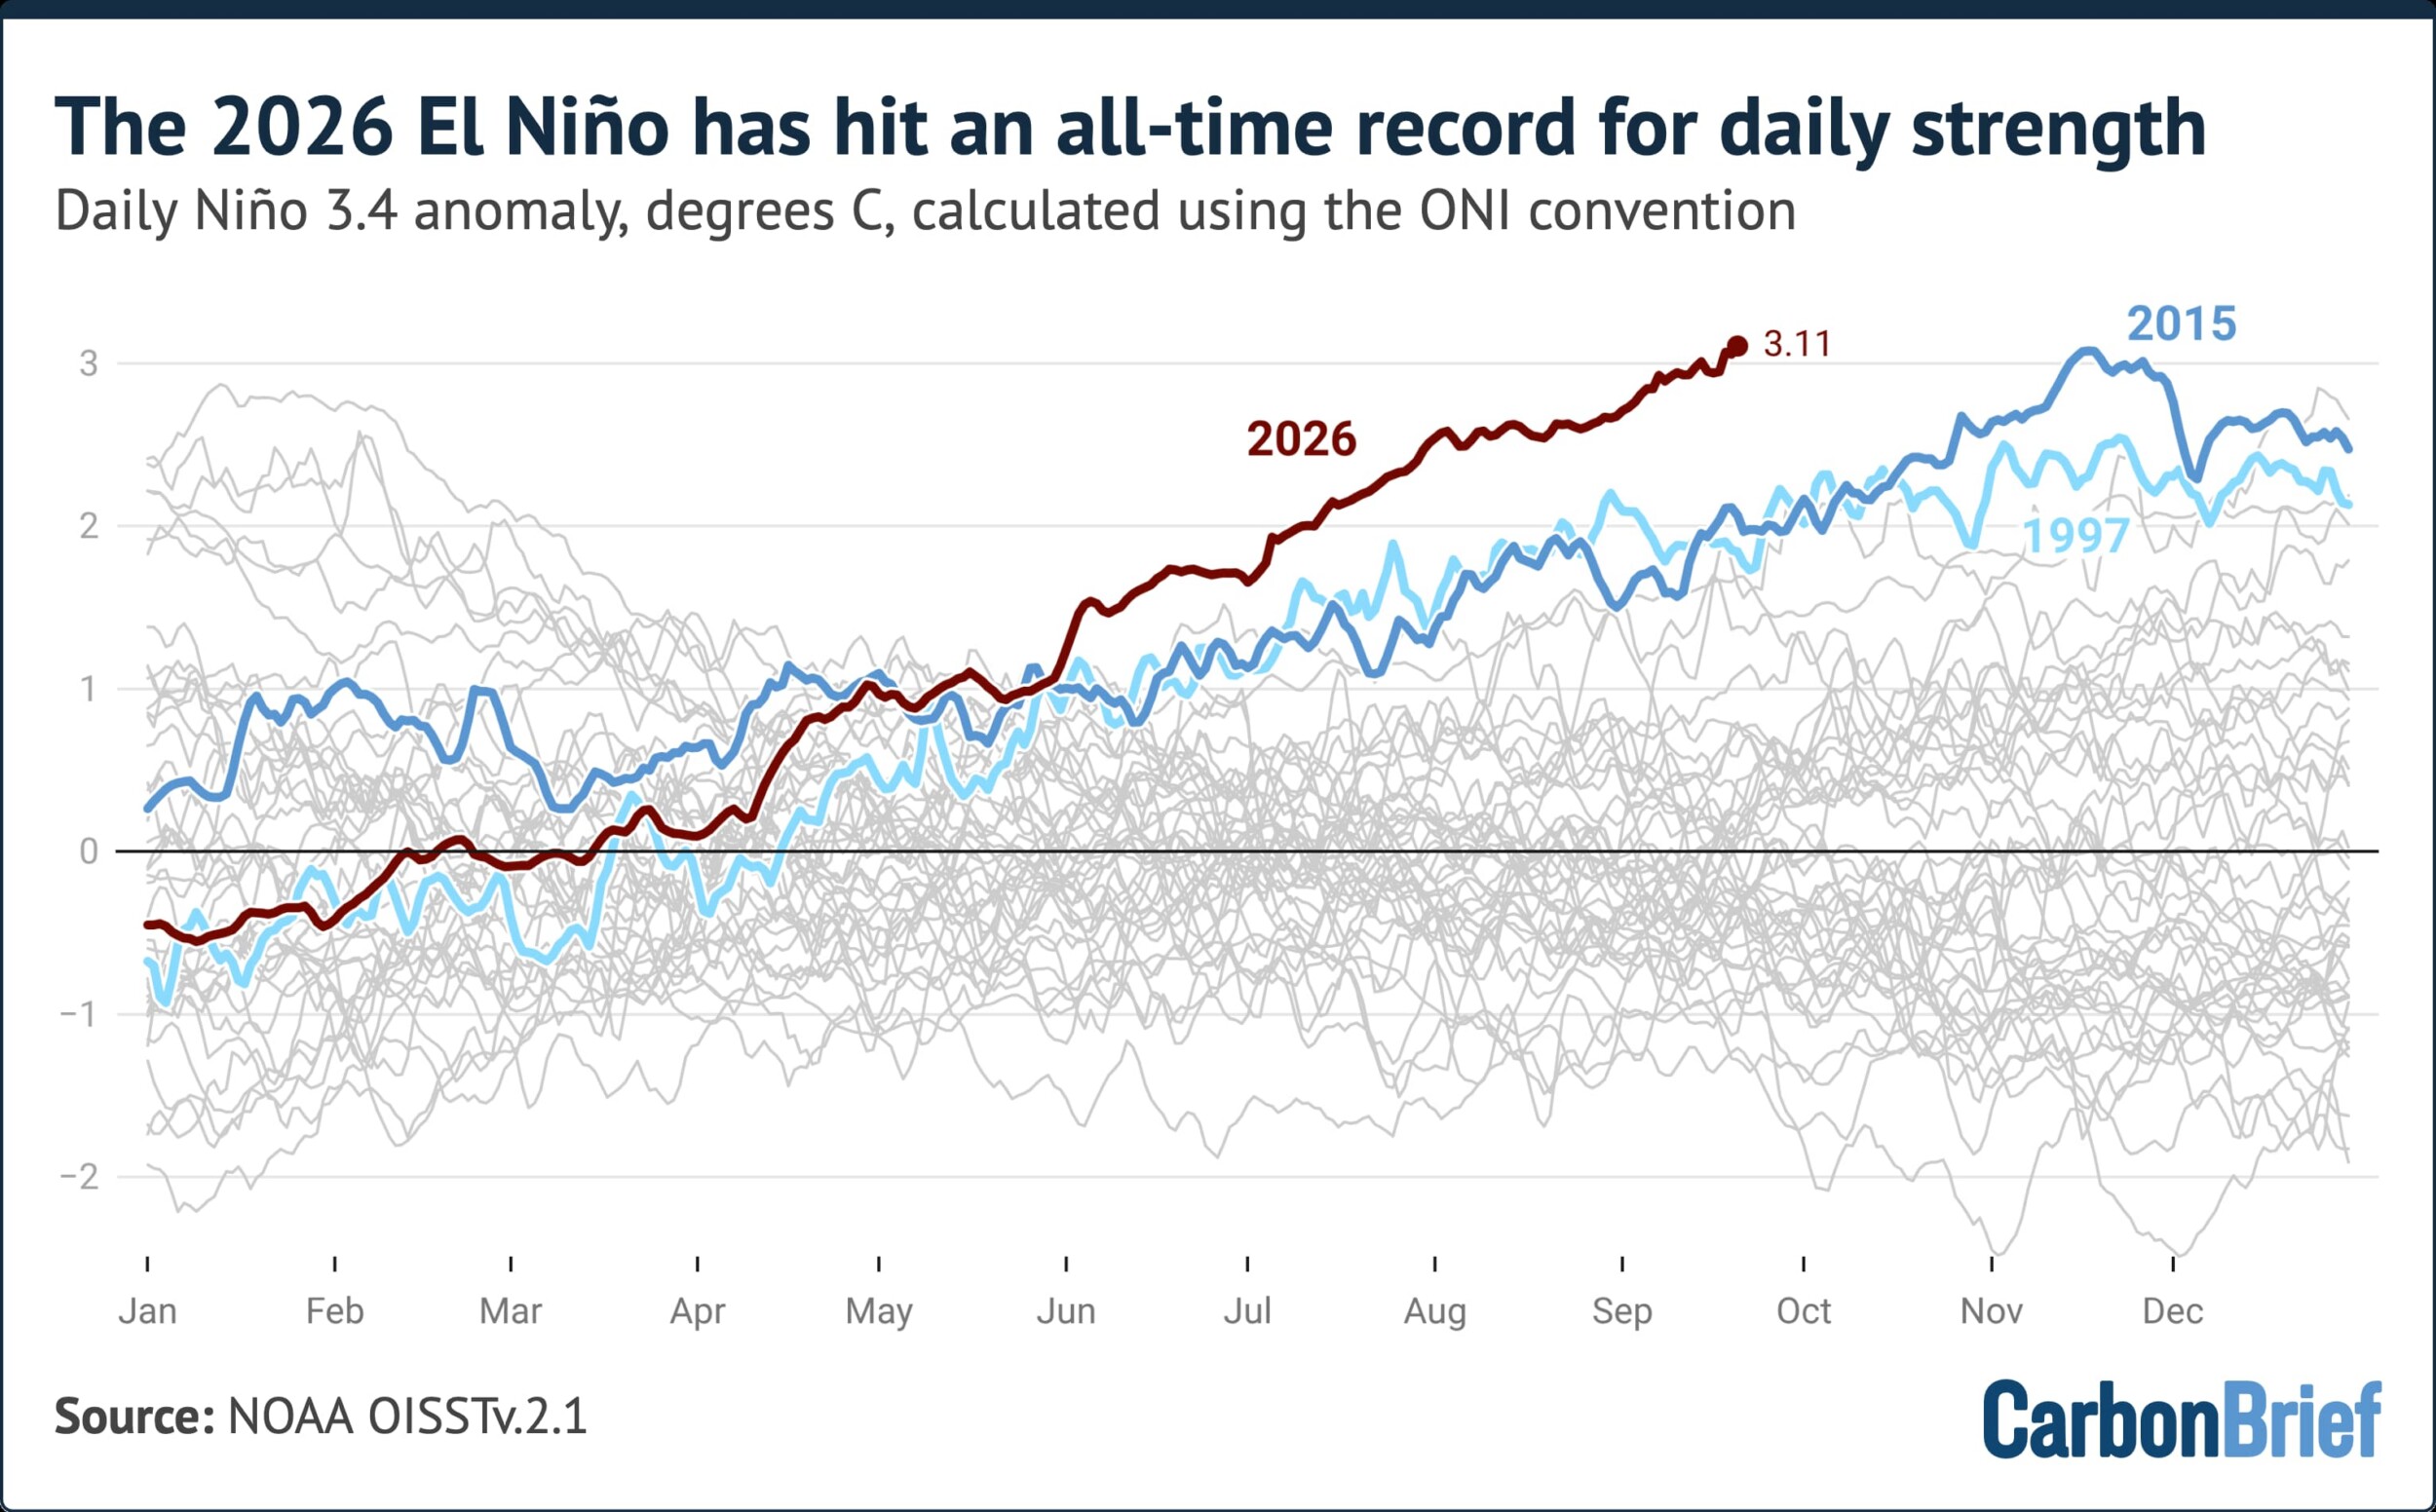
On September 21, 2026, the daily sea surface temperature anomaly in the benchmark Niño 3.4 region reached 3.11°C above historical baselines. This figure eclipses the previous all-time daily record of 3.08°C, set on November 18, 2015.
================================================================================
HISTORIC DAILY NIÑO 3.4 ANOMALY PEAKS
================================================================================
  2015 Event Peak (Nov 18, 2015):   [3.08°C]
  2026 Event Current (Sep 21, 2026): [3.11°C]  <-- NEW ALL-TIME RECORD
================================================================================
What makes this current event particularly alarming to climatologists and oceanographers is not merely its absolute magnitude, but its unprecedented rate of intensification and unusual calendar timing. El Niño events typically reach their maximum intensity during the Northern Hemisphere’s late autumn or winter months, usually between November and January. The fact that the 2026 event has shattered all-time daily records as early as mid-September suggests that the climate system is entering uncharted territory, with severe implications for global weather patterns, agricultural output, marine ecosystems, and planetary temperatures extending well into 2027.

Detailed Chronology of an Unprecedented Event
The evolution of the 2026 super El Niño has moved with a velocity never before documented in the modern instrumental record.
2026 EL NIÑO TRAJECTORY
  [June 2026] ----------> [July - August] ----------> [Sept 21, 2026]
  Official Emergence       Rapid Surge                 Daily Record Broken
Fastest setup on record Surpasses 1997/2015 pace Hits 3.11°C Anomaly- June 2026 — Official Emergence: Atmospheric and oceanic conditions across the tropical Pacific coupled rapidly, signaling the onset of El Niño. From its inception, researchers noted that sea surface temperatures were rising far faster than during the early stages of the landmark 1997–1998 or 2015–2016 events.
- July–August 2026 — Rapid Surge: While typical El Niño events experience gradual mid-summer warming, the 2026 event exhibited relentless heat buildup. By early September, anomalies in the central equatorial Pacific were hovering over 3.0°C. In comparison, during early September of both 1997 and 2015, temperature anomalies stood around 1.9°C—more than a full degree Celsius lower than the levels observed in 2026.
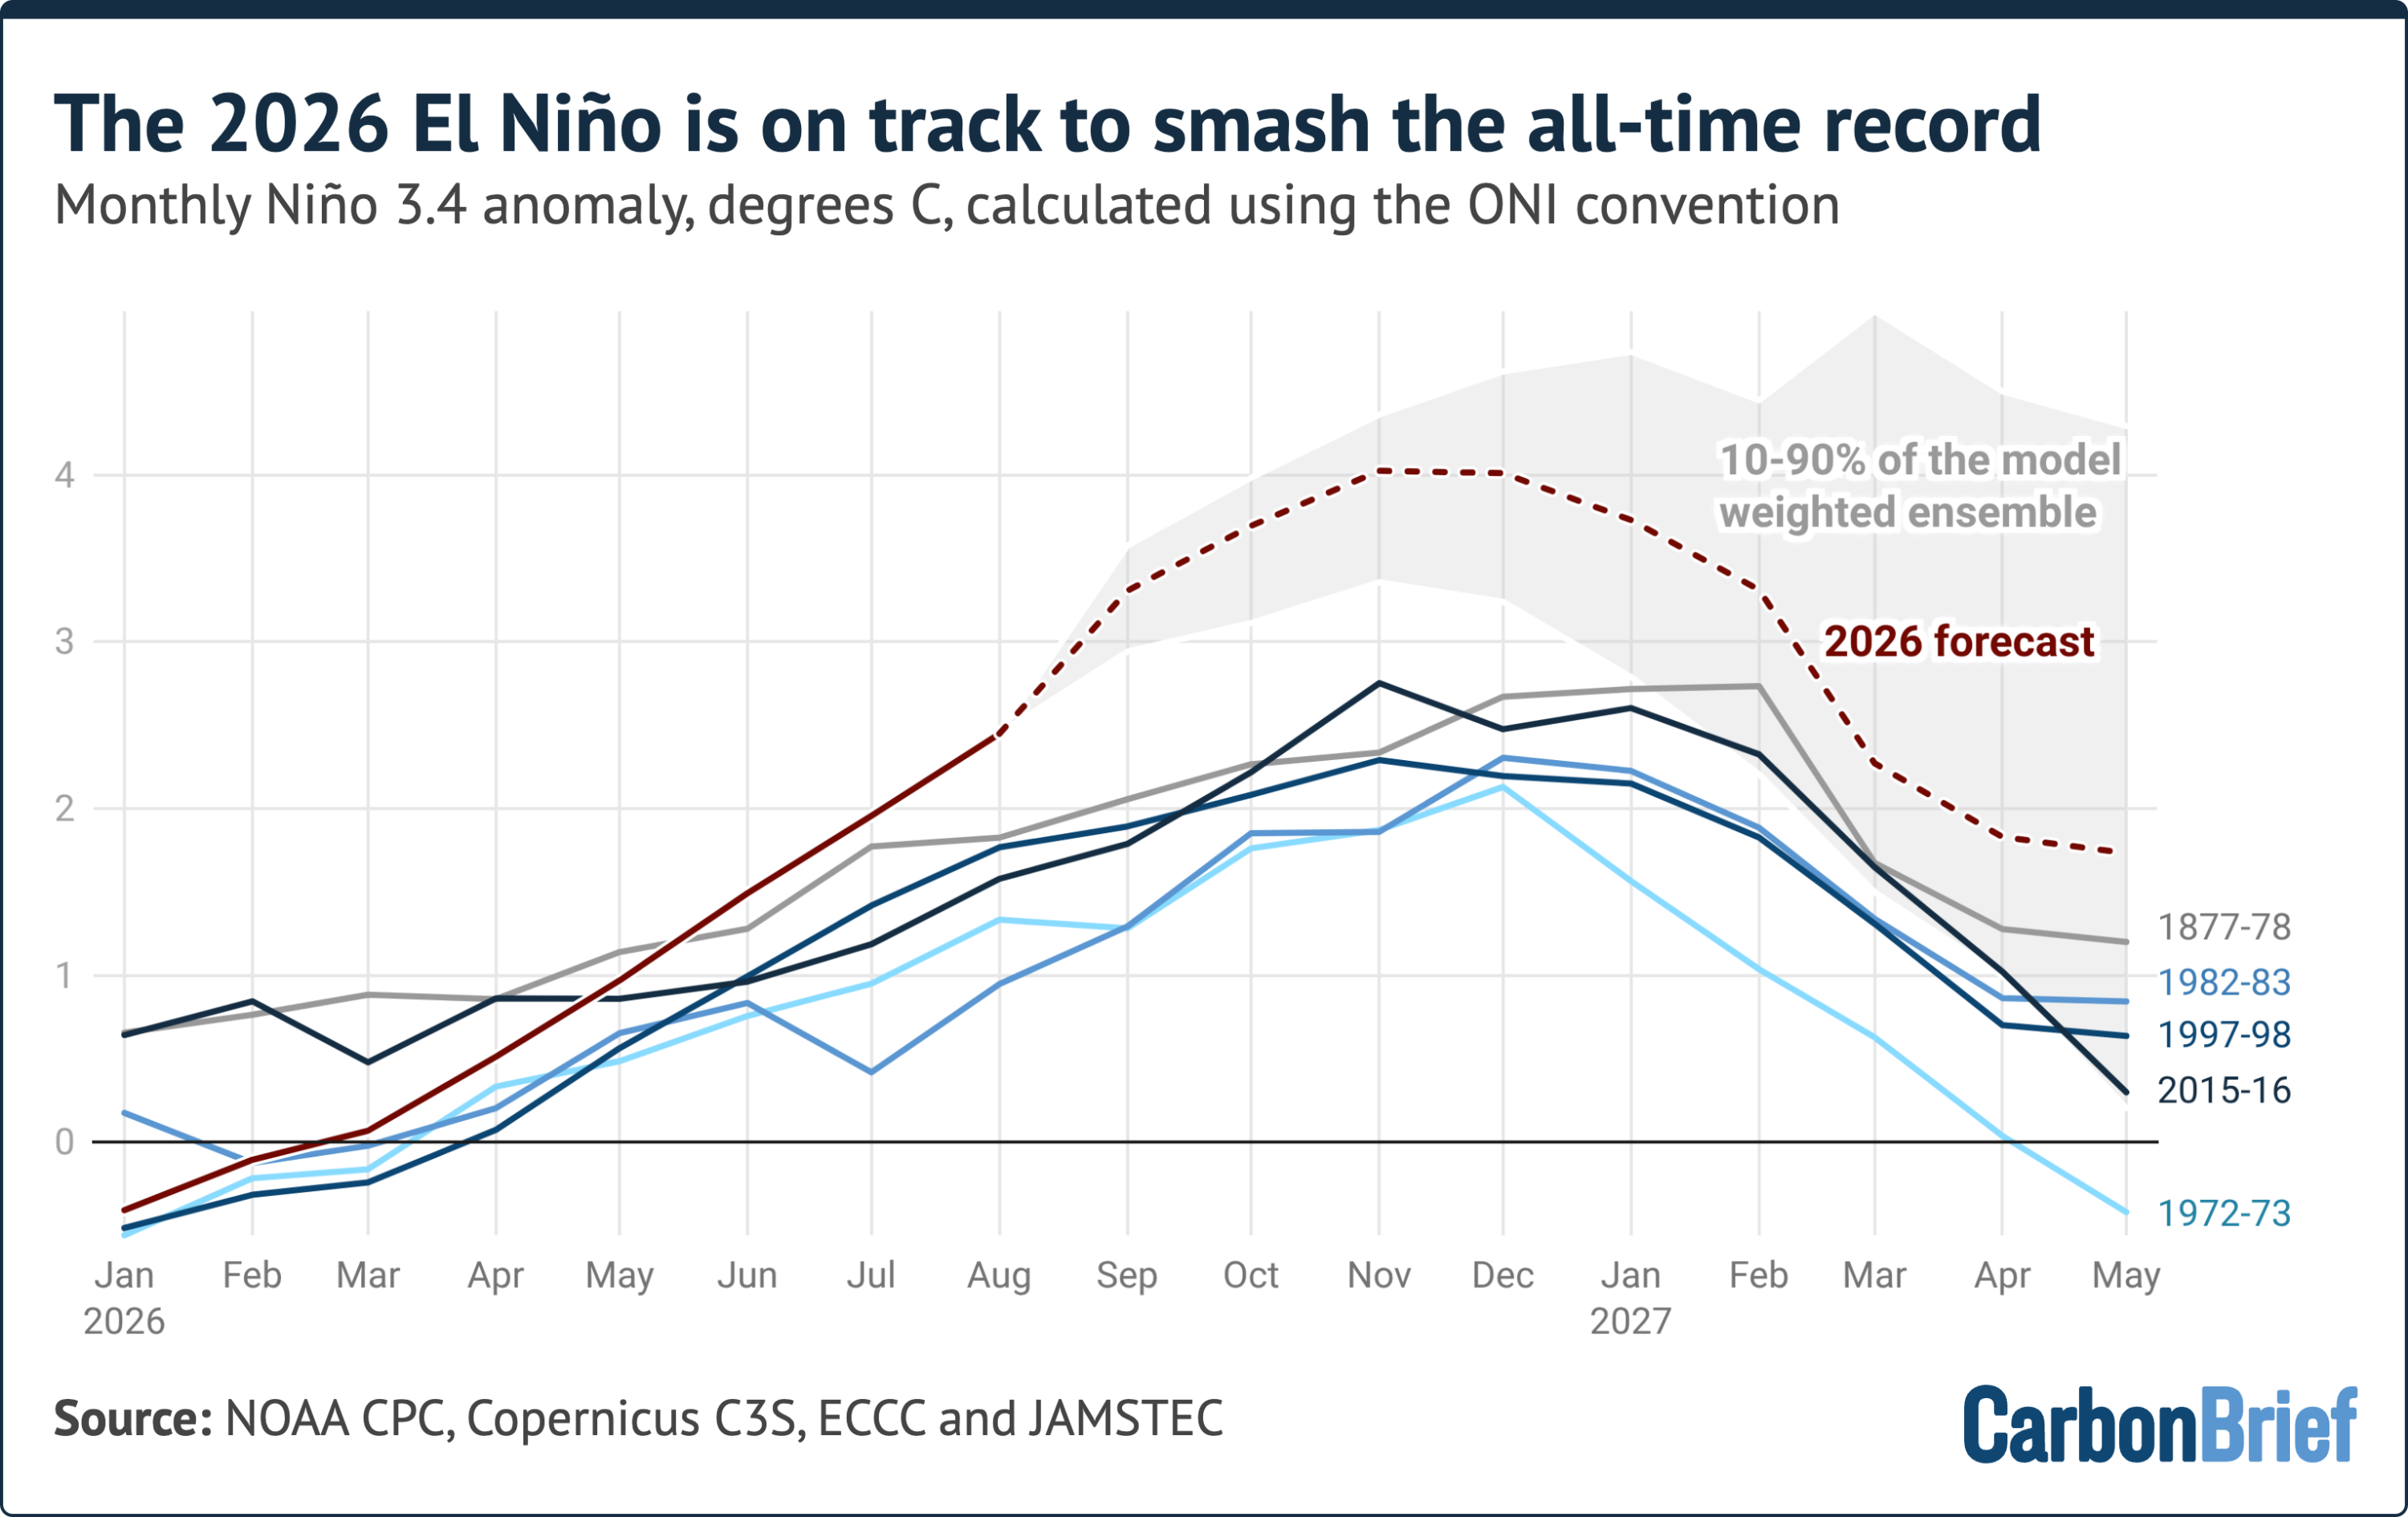
- August 2026 — Historic Monthly Benchmark: The full monthly average for August 2026 closed with a Niño 3.4 temperature anomaly of approximately 2.45°C. In over a century of oceanographic observations, this monthly level has been exceeded only twice: at the absolute peak of the 2015–2016 event (which reached 2.75°C) and during the catastrophic 1877–1878 El Niño (estimated at ~2.7°C based on historical ship logs).
- September 21, 2026 — The Record Breaks: The daily sea surface temperature anomaly hit 3.11°C, officially surpassing the highest daily temperature anomaly ever recorded in human history.
Historically, every "strong" or "very strong" El Niño on record has continued to gain thermal energy between mid-September and its eventual winter peak. Given that the current event is already outperforming past record-holders before the typical autumn intensification phase, meteorologists warn that the event has not yet reached its apex.
Supporting Context & Metrics: Dissecting the Oceanographic Data
To evaluate the magnitude of ENSO (El Niño-Southern Oscillation) events, climate scientists monitor specific sectors of the equatorial Pacific Ocean. The primary benchmark is the Niño 3.4 region, an area spanning from latitude 5°N to 5°S and longitude 120°W to 170°W.
        TROPICAL PACIFIC MONITORING REGIONS
---------------------------------------------------
           170°W                 120°W
   5°N +-----|---------------------|-----+
       |     |   NIÑO 3.4 REGION   |     |  <-- Primary Benchmark
       |     | (3.11°C Anomaly)    |     |      (Sept 21 Record)
   5°S +-----|---------------------|-----+
---------------------------------------------------
Categorization Framework
The U.S. National Oceanic and Atmospheric Administration (NOAA) classifies El Niño strength according to the sea surface temperature (SST) anomaly sustained in the Niño 3.4 region:
- Weak El Niño: SST anomaly between $+0.5^circtextC$ and $+0.9^circtextC$
- Moderate El Niño: SST anomaly between $+1.0^circtextC$ and $+1.4^circtextC$
- Strong El Niño: SST anomaly between $+1.5^circtextC$ and $+1.9^circtextC$
- Very Strong ("Super") El Niño: SST anomaly exceeding $+2.0^circtextC$
With a daily anomaly crossing $+3.11^circtextC$, the 2026 event far surpasses the threshold for a "very strong" event, placing it in an extraordinary class of its own.
EL NIÑO SEVERITY TIER
[Weak: 0.5°C] -> [Moderate: 1.0°C] -> [Strong: 1.5°C] -> [Very Strong: 2.0°C+] ====> [2026 CURRENT: 3.11°C]
The Role of Baseline Conventions: ONI vs. RONI
Understanding how this record is measured requires examining the primary analytical indices used by climate institutes.
Oceanic Niño Index (ONI)
Carbon Brief and major climate institutions utilize the methodology behind NOAA’s Oceanic Niño Index (ONI). The ONI subtracts the centered 30-year average sea surface temperature (currently using the 1991–2020 climatology baseline) from current observations. By shifting the 30-year reference period forward over time, the ONI filters out much of the long-term, human-induced background ocean warming, isolating the specific natural variability of the El Niño signal. Under this standard metric, the daily anomaly of 3.11°C stands as an absolute record.
Relative Oceanic Niño Index (RONI)
In 2024, NOAA formally introduced an alternative metric known as the Relative Oceanic Niño Index (RONI). Designed specifically to account for generalized ocean warming caused by climate change, RONI subtracts the average tropical sea surface temperature anomaly (measured between 20°N and 20°S) from the Niño 3.4 anomaly.
While RONI isolates local coupled ocean-atmosphere mechanics from background planetary warming, it can also understate the localized atmospheric influence of extreme El Niño events that spill across vast stretches of the Pacific basin.
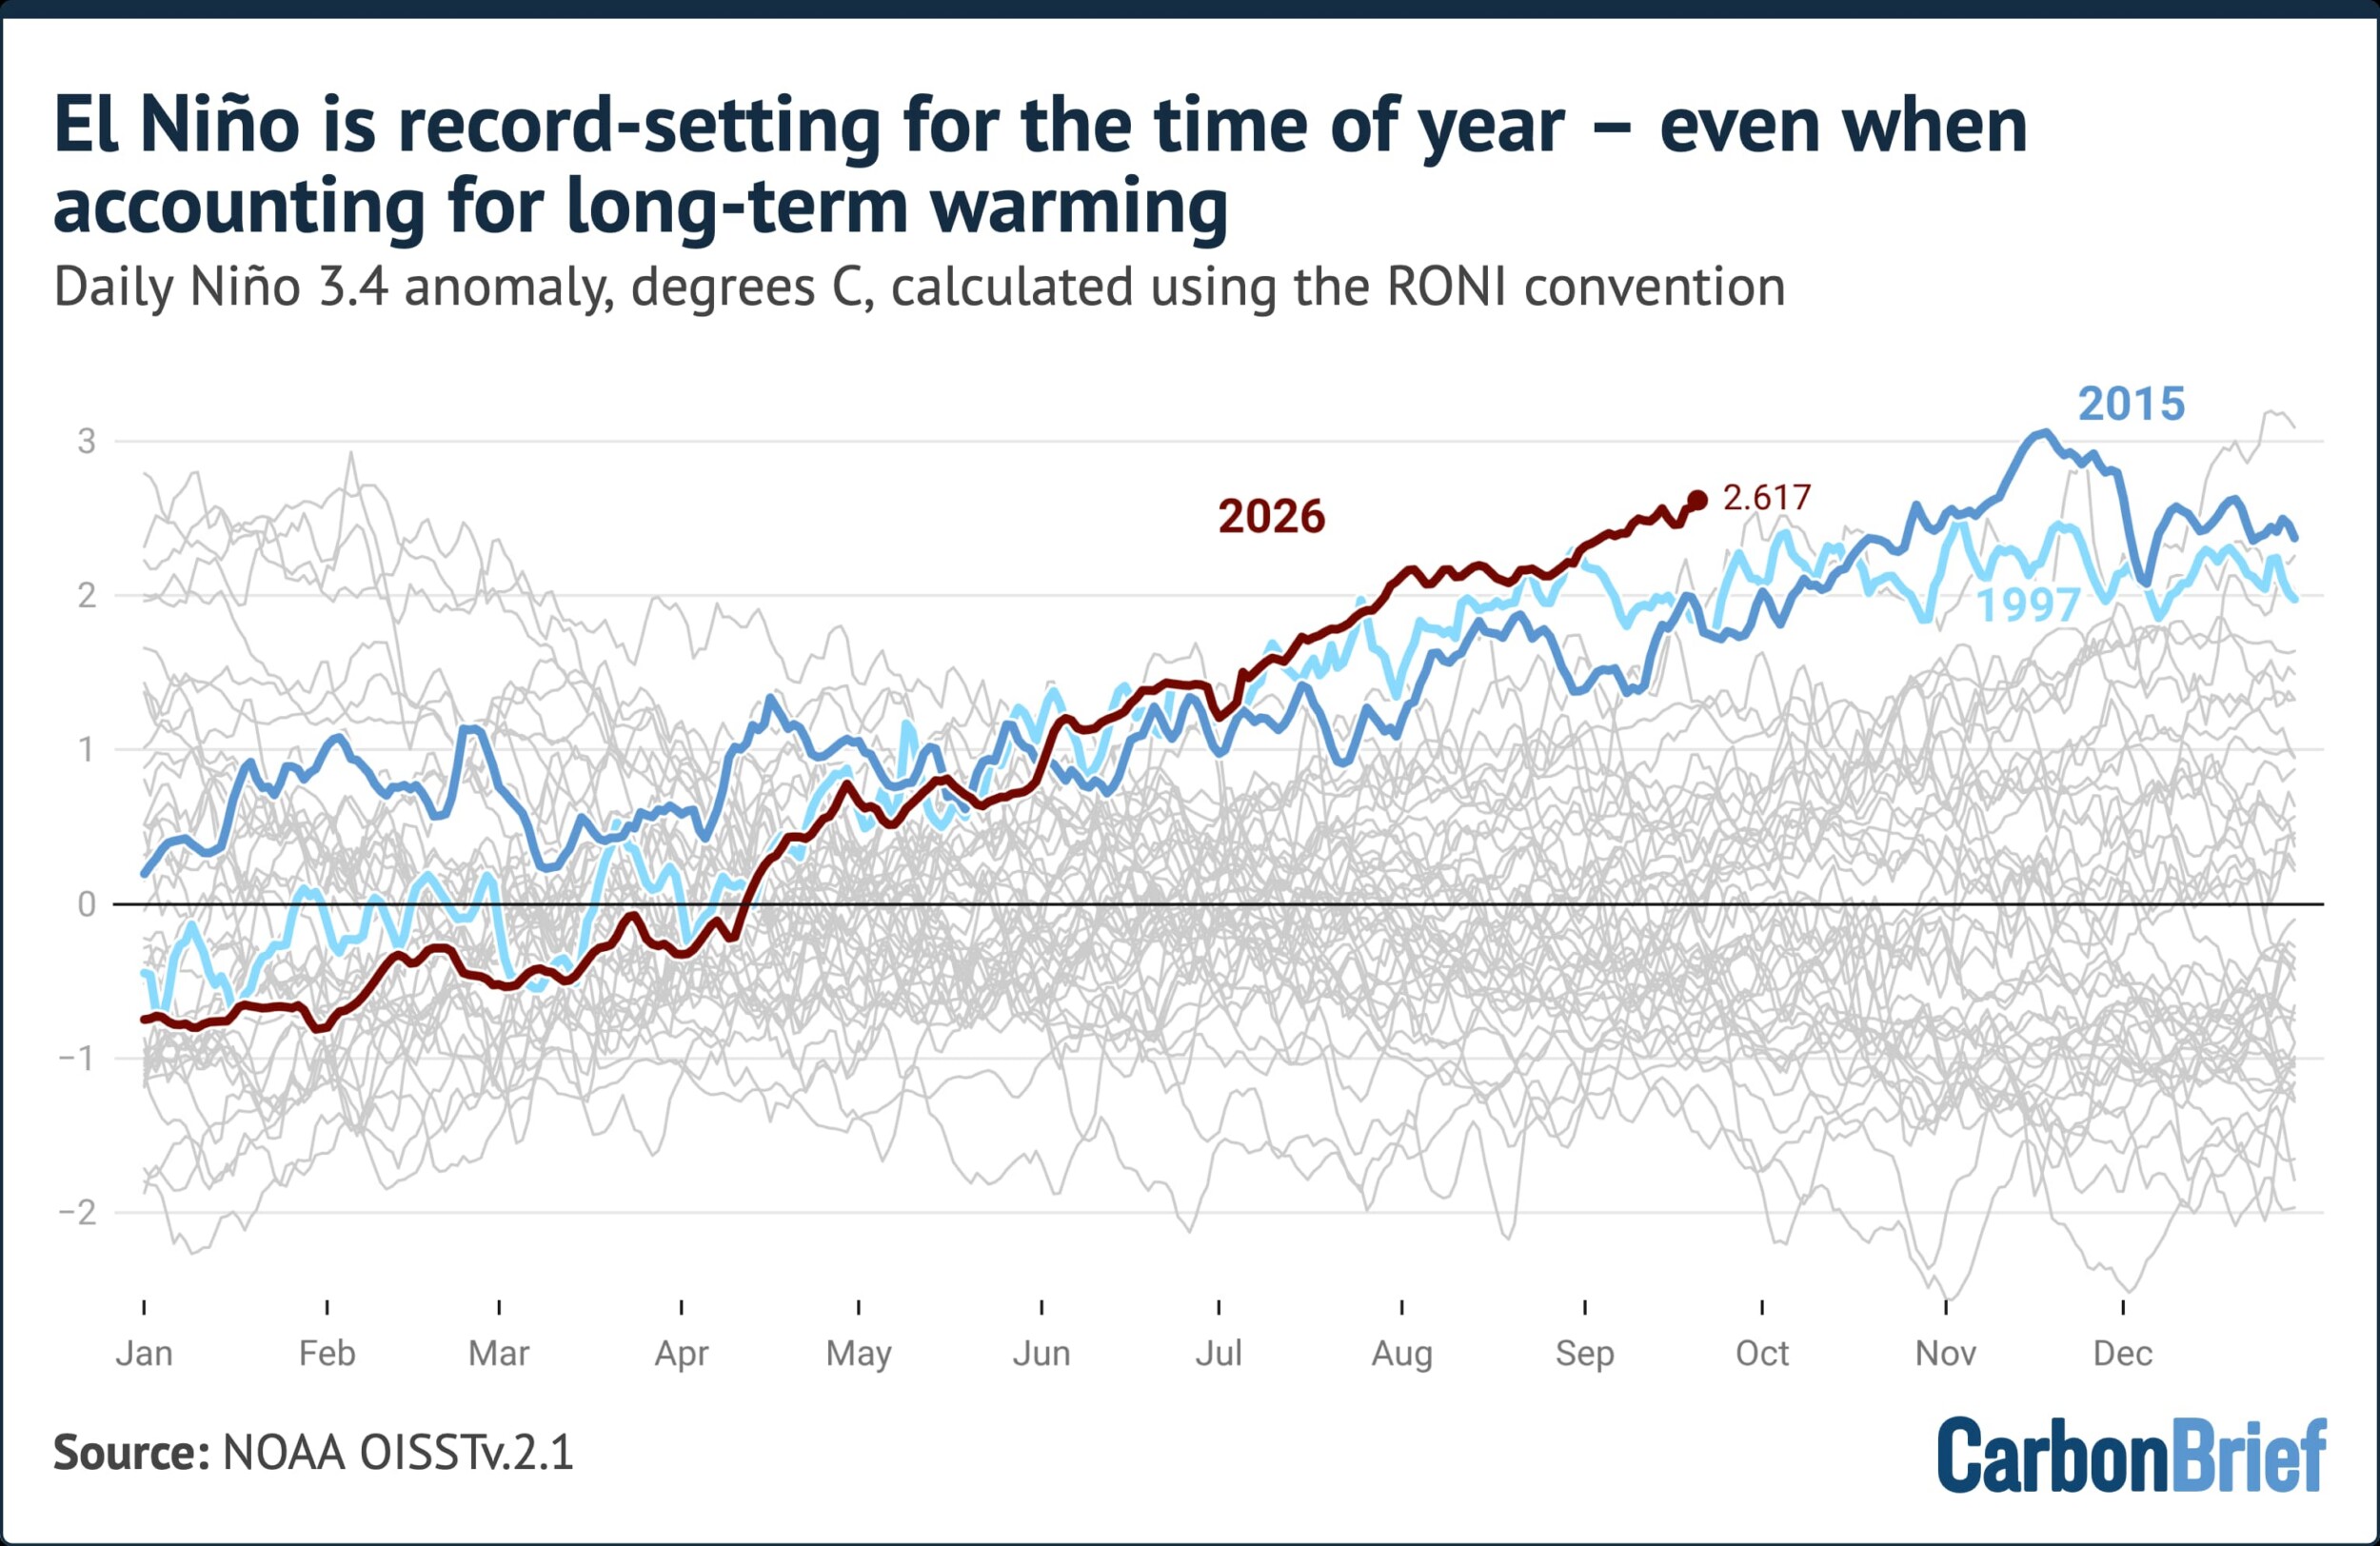
In mid-September 2026, the daily RONI value hovered near 2.5°C. While this represents an all-time record for September, it remains below the all-time daily peak of ~3.2°C recorded in late December 1882/1982 period metrics. However, historical events like 1982–83, 1997–98, and 2015–16 typically added between 0.5°C and 1.9°C to their RONI values between mid-September and their winter peaks, indicating that RONI records could also fall in the coming months.
Official Statements & Methodological Debates
Climate monitoring organizations and atmospheric scientists have voiced both awe and caution regarding the ongoing observations.
Scientific Consensus on Current Records
Prominent climate tracking researchers noted the milestone early in the week as data solidified. Oceanographers analyzing real-time satellite altimetry and buoy arrays from the Tropical Atmosphere Ocean (TAO) project confirmed that trade winds across the Pacific have severely weakened or reversed, allowing massive surges of warm sub-surface water (down to 150–300 meters) to slosh eastward toward South America.

Model Performance and Forecast Uncertainties
To project the evolution of the event, researchers synthesized data from 14 global seasonal forecasting models—including systems from NOAA’s Climate Prediction Center (CPC), the Copernicus Climate Change Service (C3S), Environment and Climate Change Canada (ECCC), and the Japan Agency for Marine-Earth Science and Technology (JAMSTEC).
================================================================================
SEASONAL MODEL PROJECTIONS (14 ENSEMBLE SYSTEMS / 674 RUNS)
================================================================================
  Mean Projected Monthly Peak:   [~4.1°C]
  80% Confidence Interval Range: [3.4°C to 4.6°C]
  Historical Comparison Margin:  +1.3°C above 2015–2016 record peak
================================================================================
Across an ensemble of 674 individual model runs, the projections yield alarming results:
- The ensemble multi-model mean projects a peak monthly anomaly later this year of ~4.1°C.
- Fully 80% of model runs fall between 3.4°C and 4.6°C.
- 100% of the model runs project a peak that exceeds the 2015–2016 record of 2.75°C.
However, atmospheric scientists urge a degree of analytical caution. Seasonal forecasting systems have never been tested or calibrated against an event of this magnitude in the modern observational era. Furthermore, models slightly overpredicted Pacific warm anomalies during the mid-summer months, with real-world observations for August tracking roughly 0.3°C lower than model ensemble averages.
Despite this minor observational variance, experts emphasize that the fundamental physics governing ENSO events points toward continued strengthening into late 2026.
Future Outlook & Global Climate Cascades
The consequences of an unprecedented "super El Niño" extend far beyond sea surface temperature charts. The phenomenon acts as a primary driver of global weather disruption, shifting the jet streams, altering precipitation belts, and releasing vast stores of oceanic heat into the atmosphere.
               PACIFIC OCEAN REALIGNMENT & GLOBAL CASCADE

  [Extreme SST Heating (>3.11°C)] ---> [Subtropical Jet Stream Shift]
                                                |
        +---------------------------------------+---------------------------------------+
        |                                       |                                       |
  [Drought & Fires]                    [Torrential Rains]                     [Atmospheric Heat Release]
  SE Asia, Indonesia, Amazon basin     South America, US Gulf Coast           Global surface temp spikes
  Peatland carbon release surges       Flooding and infrastructure damage     Massive lag impact into 2027
Multi-Year Temperature Lag Effects
Because the transfer of thermal energy from the tropical ocean into the global atmosphere involves a time lag of several months, the true surface-temperature impacts of an El Niño event are typically realized during the year following its peak.

Analysis indicates that while 2026 is already on track to rank as either the warmest or second-warmest calendar year on record, the atmospheric warming lag means 2027 will bear the brunt of this event. If the 2026 El Niño peaks near or above projected levels, 2027 could see global average surface temperatures rise dramatically higher, shattering global temperature thresholds.
Socioeconomic, Agricultural, and Ecological Disruptions
The regional climate shocks tied to an event of this magnitude are already emerging:
- Indonesian Fire Emissions: Severe drought conditions across Southeast Asia are drying out peatlands and tropical forests. Early data indicates that fire emissions in Indonesia during 2026 are on track to match or exceed the worst century records, threatening to release gigatons of stored carbon into the atmosphere.
- Disruption of Marine Ecosystems: Extreme sea surface warmth is triggering widespread marine heatwaves. Coral reef systems across the equatorial Pacific face unprecedented risk of severe, irreversible bleaching. Additionally, the suppression of nutrient-rich upwelling along the South American coastline threatens regional fisheries.
- Global Weather Anomalies: The reorganization of deep atmospheric convection in the Pacific will disrupt rainfall patterns globally. Typical impacts include severe droughts across northern Australia, Southern Africa, and the Amazon basin, paired with heightened risks of destructive flooding across coastal Peru, Ecuador, and the southern United States.
As the 2026 super El Niño continues its extraordinary climb toward an autumn/winter peak, climate monitoring agencies worldwide are maintaining elevated watches. The coming months will test the limits of climate forecasting models and highlight the growing vulnerability of human and ecological systems to extreme earth system disruptions.