Executive Overview
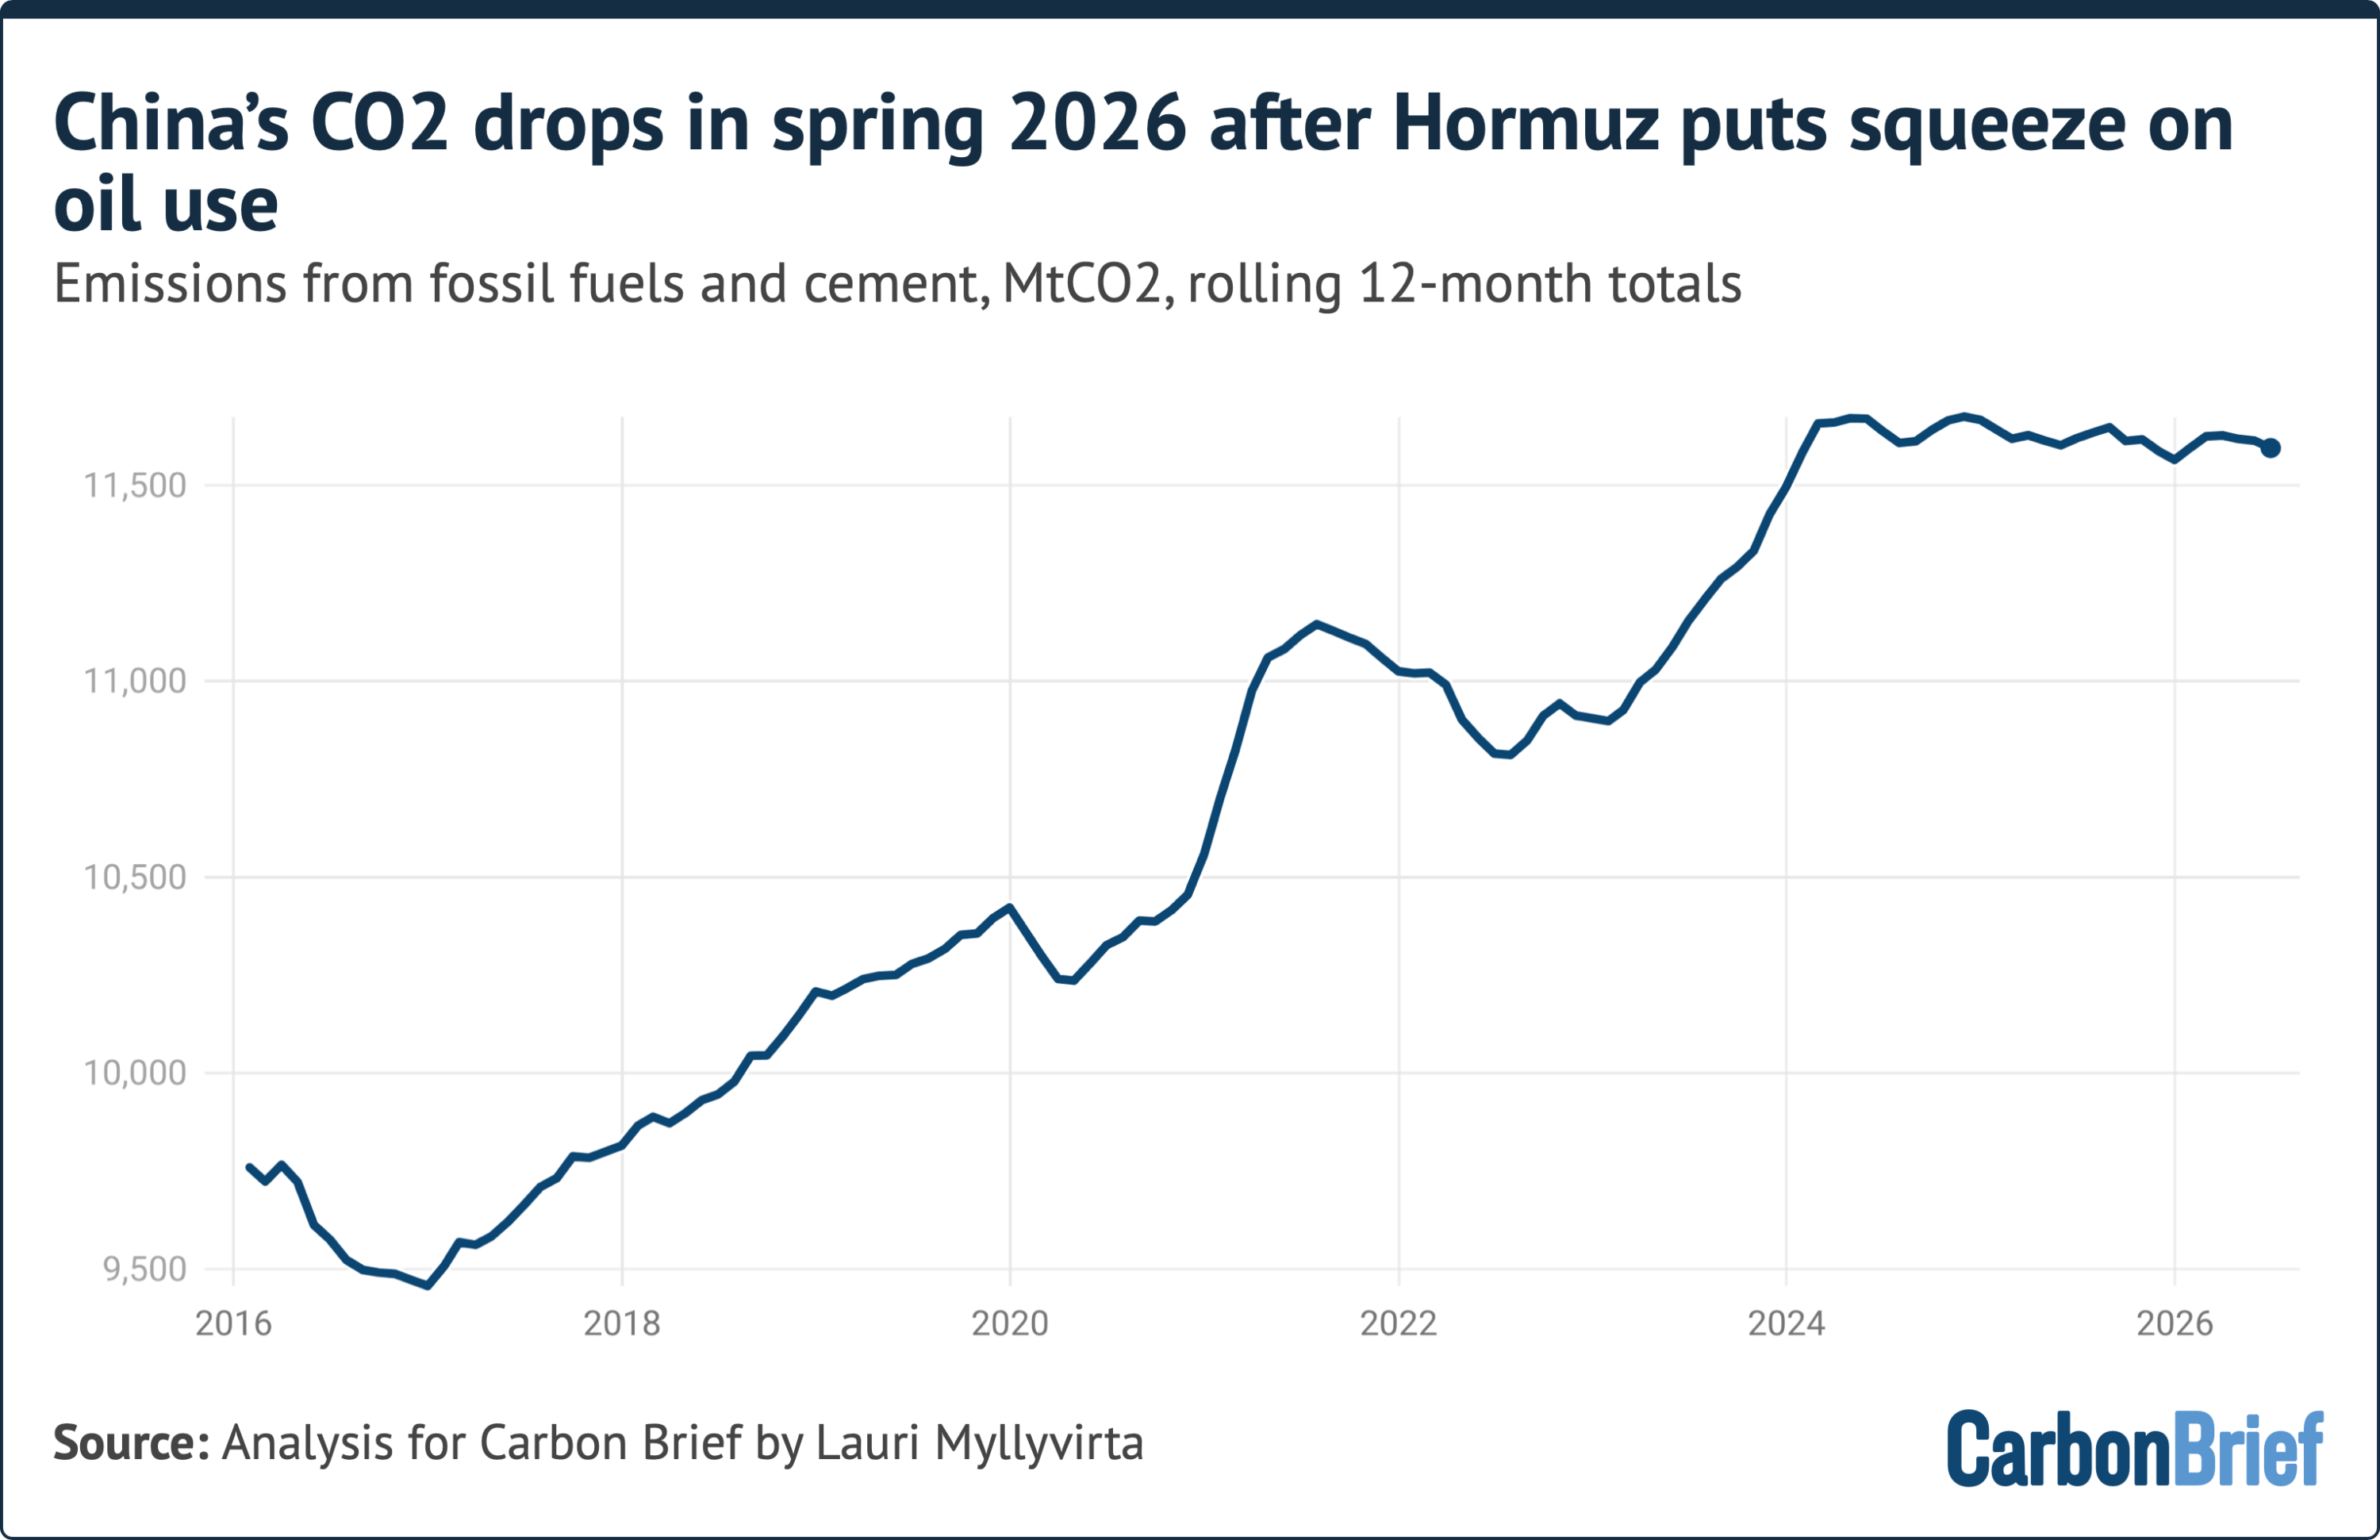
In a historic turning point for global climate trends, China’s carbon dioxide ($textCO_2$) emissions fell by 1% year-on-year in the second quarter of 2026. Data compiled by the Centre for Research on Energy and Clean Air (CREA) reveals that this drop was overwhelmingly driven by a unprecedented 9% plummet in national oil consumption, triggered in part by supply disruptions and soaring fuel prices resulting from the Strait of Hormuz conflict.
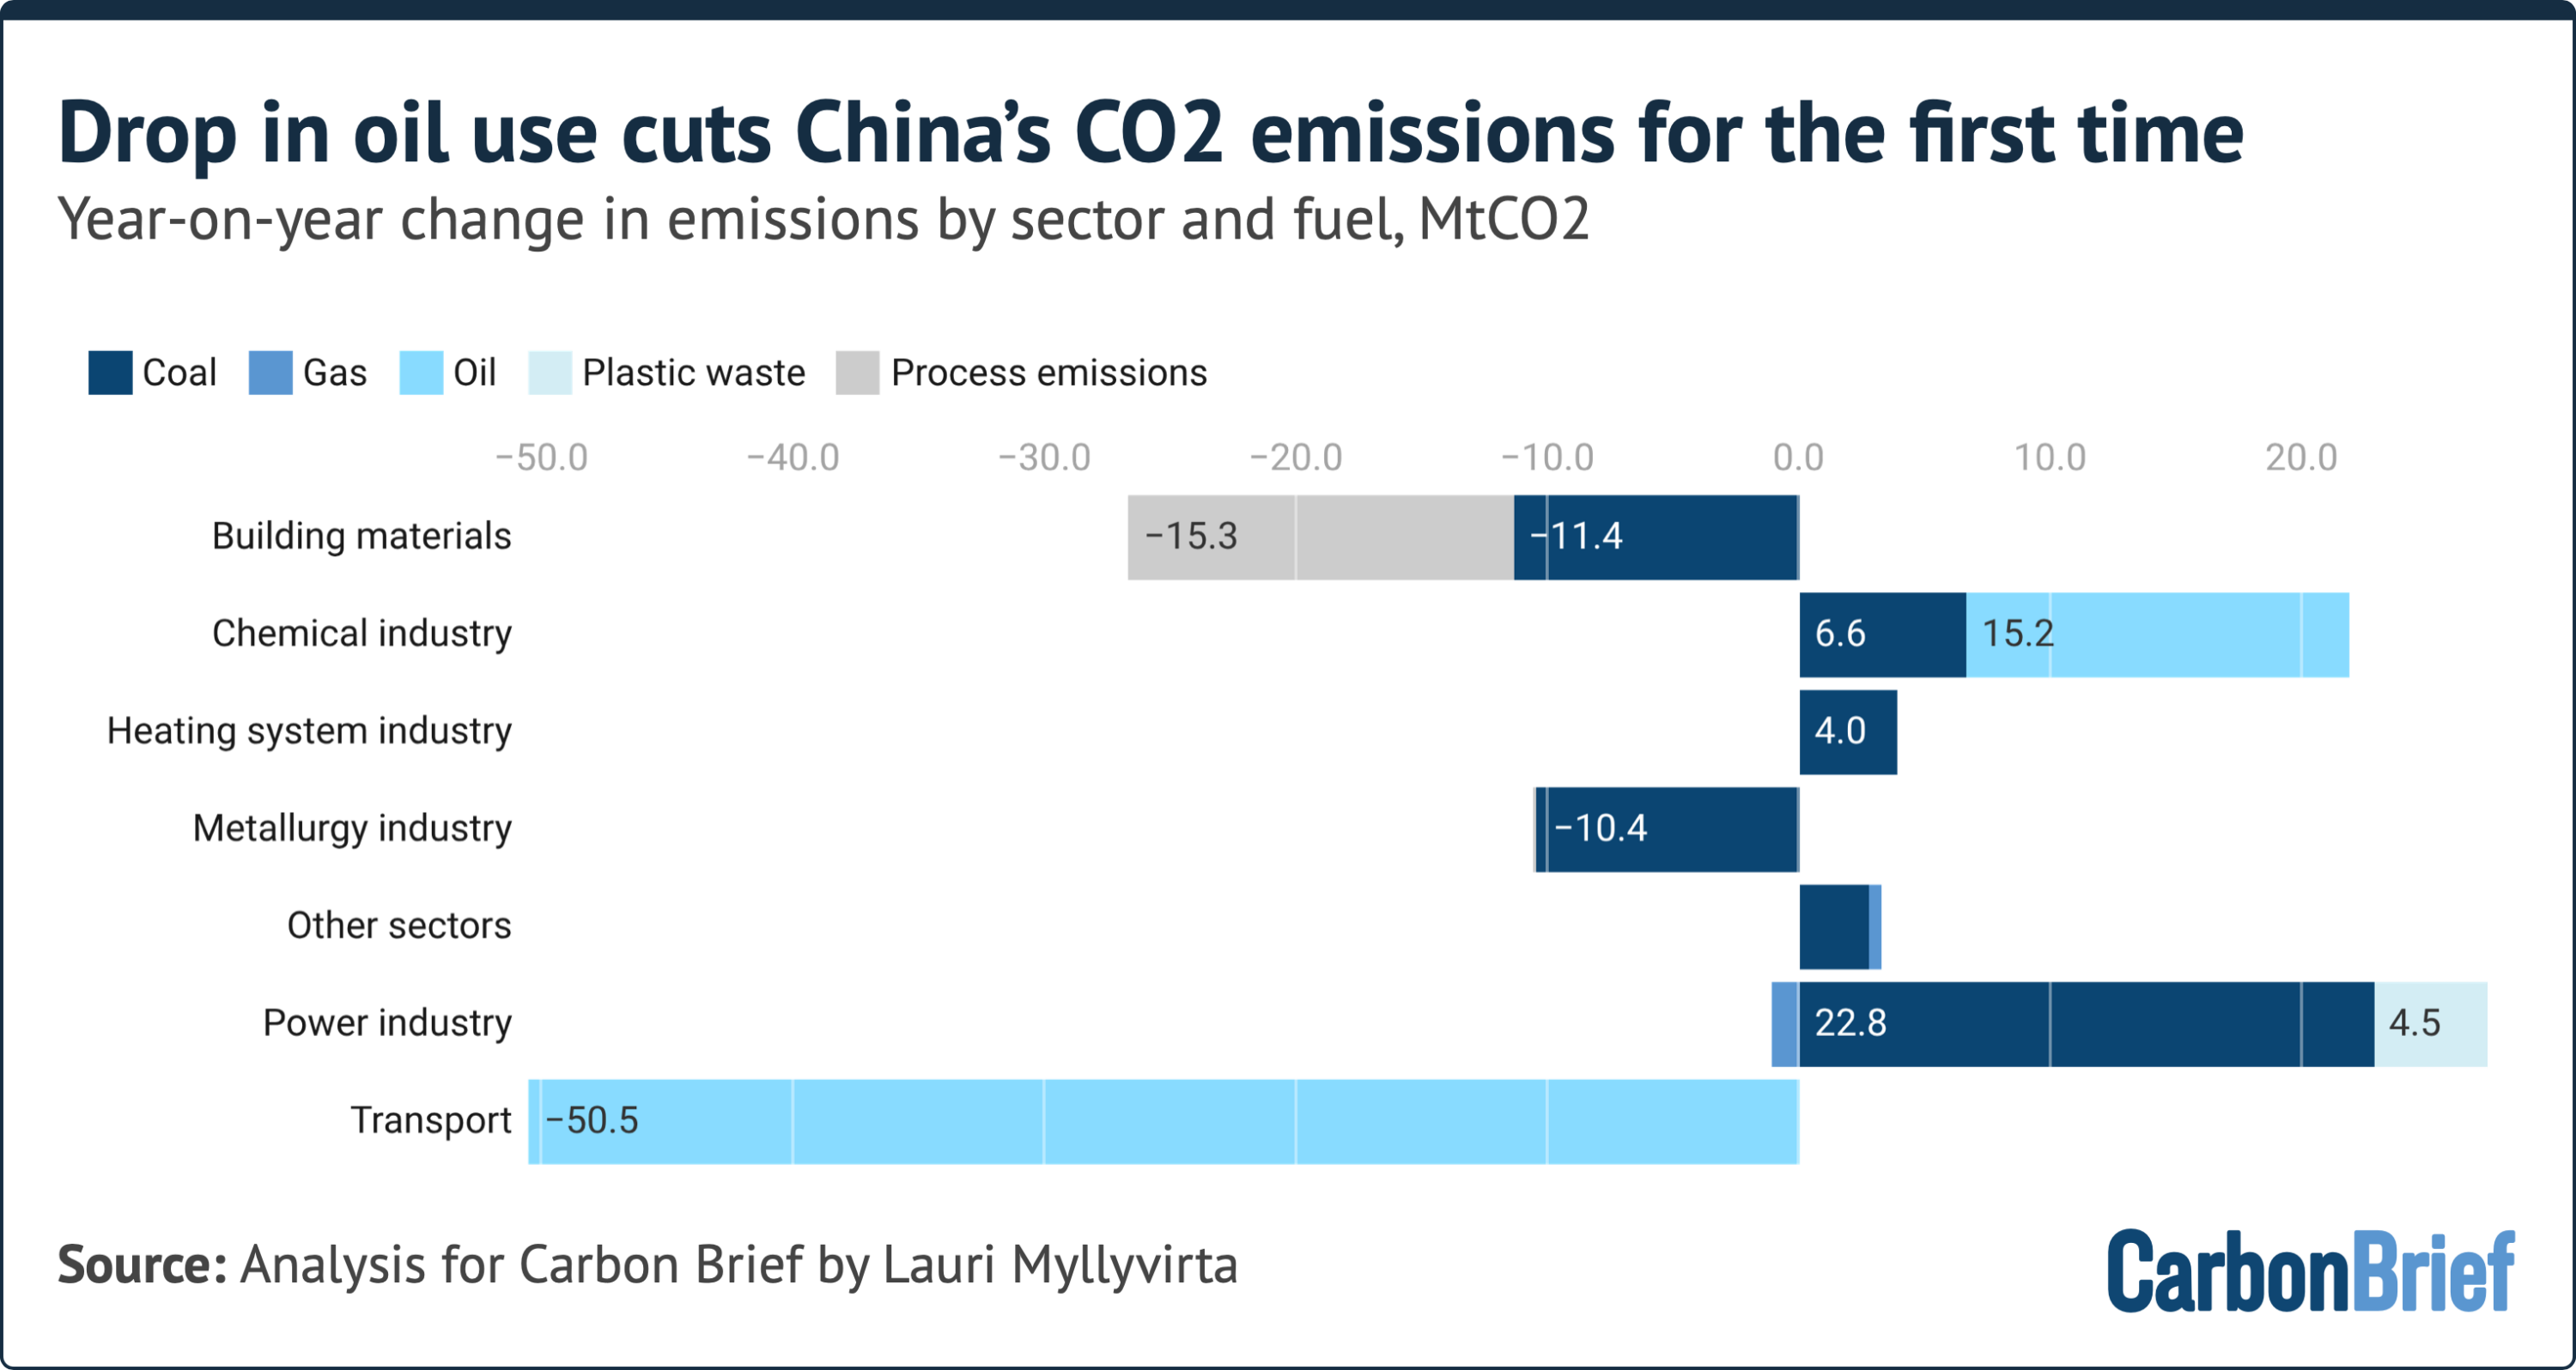
This marks the first time in modern Chinese economic history that a decline in national carbon emissions was propelled by reduced oil consumption rather than a drop in coal burning. Transport oil consumption contracted by a staggering 16% during the quarter as commercial and passenger transport rapidly shifted away from liquid fossil fuels.
       CHINA Q2 2026 EMISSIONS & ENERGY DISRUPTION AT A GLANCE
┌──────────────────────────────────────┬──────────────────────────────────┐
│ Indicator                            │ Q2 2026 Value / Change (YoY)     │
├──────────────────────────────────────┼──────────────────────────────────┤
│ National CO₂ Emissions               │ ▼ 1.0%                           │
│ Total Oil Consumption                │ ▼ 9.0%                           │
│ Transport Oil Demand                 │ ▼ 16.0%                          │
│ Crude Oil Import Volume              │ ▼ 32.0%                          │
│ Coal Use in Power Generation         │ ▲ 2.4%                           │
│ Electric Heavy-Truck Sales Share     │ ▲ >45.0% (June market share)     │
│ EV Charging Volume Growth            │ ▲ 60.0%                          │
│ H1 Avoided Oil via EVs               │ 36.0 Mtoe (Exceeds UK 6-mo total)│
└──────────────────────────────────────┴──────────────────────────────────┘
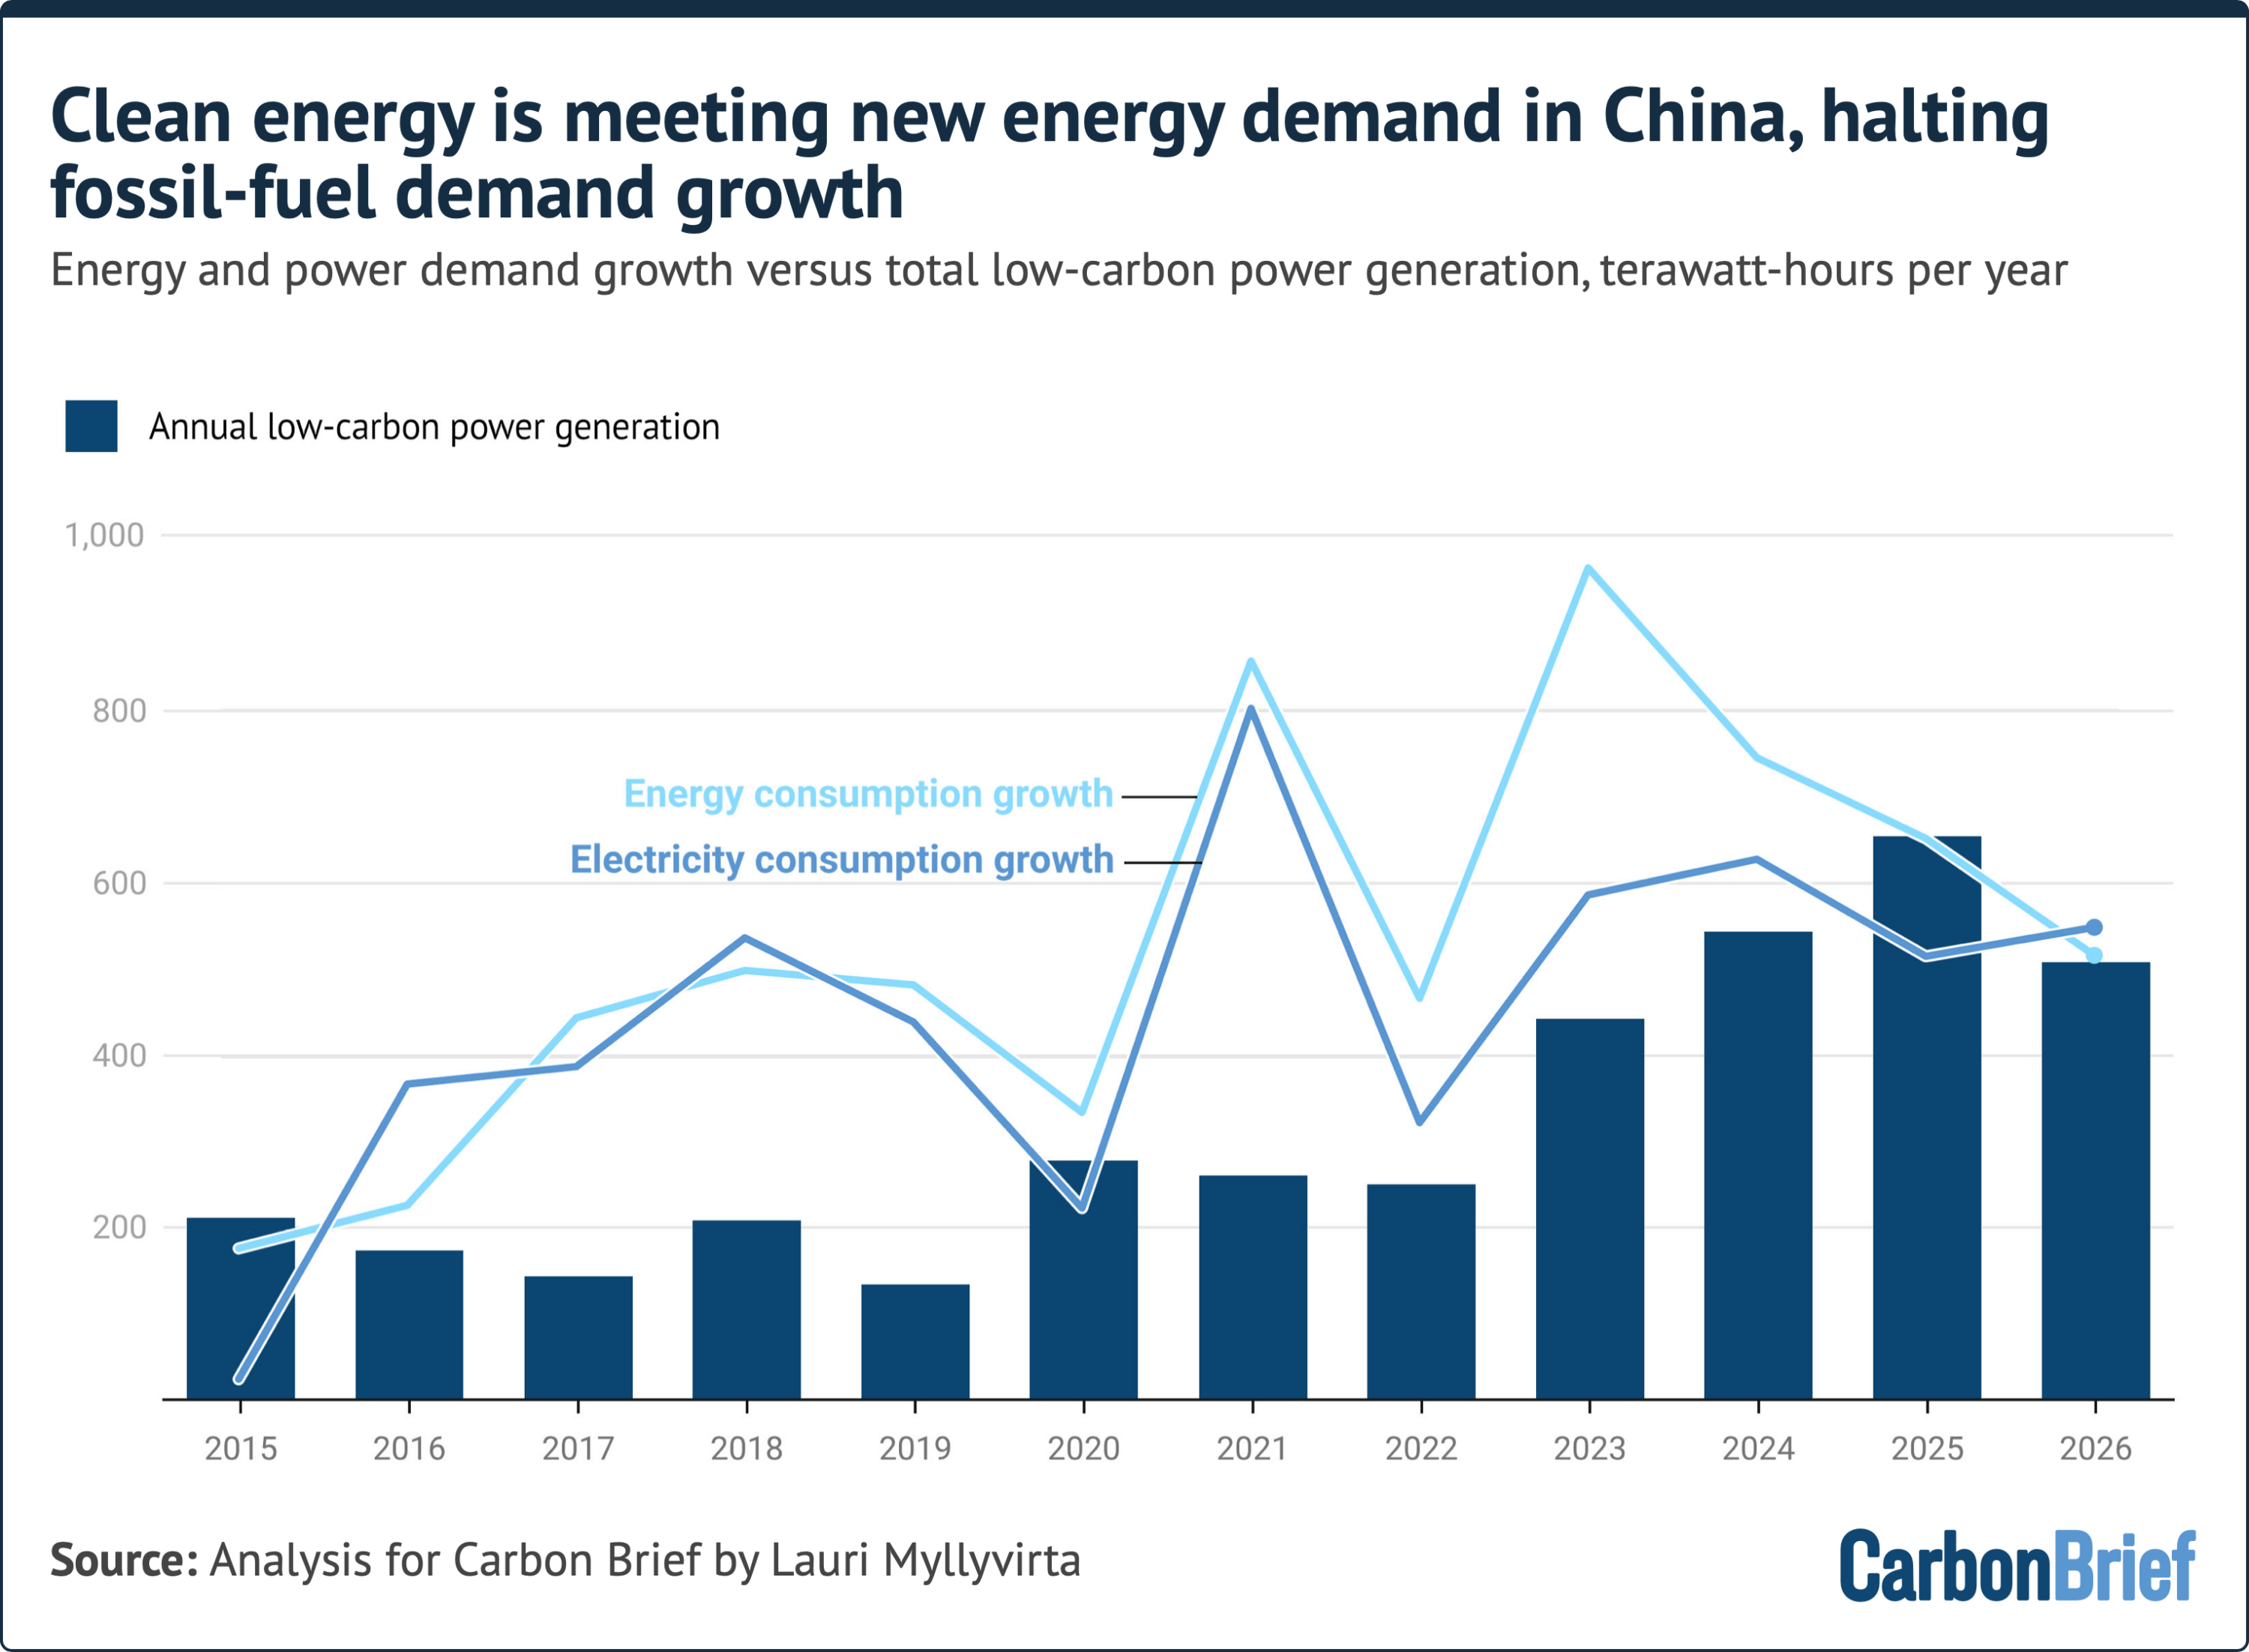
The decline occurred despite a continued rebound in coal-fired power generation, which grew by 2.4% in the same period. The rise in coal dispatch was largely caused by grid integration bottlenecks and unfavorable wind conditions, which forced power authorities to curtail record volumes of renewable generation. Nevertheless, the structural acceleration of vehicle electrification—coupled with a sustained slump in real-estate construction—overwhelmed the power sector’s increased coal use, keeping China’s total emissions on a flat-to-falling trajectory below their 2023–2024 peak.
Detailed Chronology: From the Hormuz Shock to Domestic Energy Realignment
The Escalation and Import Freeze
The second quarter of 2026 opened against the backdrop of acute geopolitical volatility. Following supply chokepoints in the Middle East stemming from the Strait of Hormuz crisis, crude oil deliveries to Chinese ports plummeted.
2026 EMISSIONS TRAJECTORY (Q1 TO Q2)

  Q1 2026                          Q2 2026
 ┌──────────────┐                 ┌──────────────┐
 │ CO₂ ▲ 2.0%   │  Hormuz Oil     │ CO₂ ▼ 1.0%   │  Net H1 2026:
 │ (Driven by   │  Supply Shock   │ (Driven by   │  Emissions up marginally,
 │  curtailment)│  ────────────►  │  9% drop in  │  but remain below the
 └──────────────┘                 │  oil demand) │  2023–2024 peak.
└──────────────┘- Q1 2026 Context: China recorded a 2% year-on-year increase in overall emissions, caused primarily by early-year grid management issues that wasted substantial solar and wind generation.
- April–May 2026: As Gulf crude shipments faltered, China’s overall crude oil imports collapsed by 32% for the quarter. Refineries slashed processing volumes by 11%.
- June 2026: Domestic fuel sales reported by state refiner Sinopec fell 9% across the first half of the year, with total transportation fuel demand (petrol, diesel, and jet fuel) suffering its steepest quarterly downturn on record.
- Mid-Year Assessment: Official data from China’s National Bureau of Statistics (NBS) confirmed that while drawing down strategic oil inventories cushioned approximately 60% of the import deficit, genuine demand destruction and technology substitution accounted for the remaining 40%.
A Divergent Fuel Picture
While oil consumption recorded steep drops, other primary energy sectors performed unevenly throughout Q2 2026:
- Coal: Overall coal use expanded moderately, driven by the power sector (+2.4%) and industrial heating, whereas coal use in heavy manufacturing (steel, cement) contracted.
- Natural Gas: Gas-fired power generation dropped 1.2% year-on-year, undercut by elevated international spot prices for LNG during the Middle East crisis.
- Renewables & Clean Power: Hydropower output staged a major rebound, rising 9% year-on-year following improved rainfall across key southern river basins. Nuclear output expanded by 2%.
Supporting Context & Sectoral Metrics
1. Transport Electrification: The Primary Driver of Oil Displacement
The sharp drop in liquid fuel usage was not merely a passive reaction to elevated oil prices; it represented the rapid expansion of structural transportation trends already underway. Mobility metrics show that physical movement across China did not collapse during Q2: cross-regional passenger travel edged up by 0.1%, urban transit trips grew by 2.9%, and commercial freight tonnage increased by 2.4%.
The structural decoupling of transit volume from oil consumption was driven by rapid fleet electrification across three main domains:
                  Q2 2026 TRANSPORTATION & ELECTRIFICATION DISPLACEMENT
┌─────────────────────────────────────────────────────────────────────────────────────────┐
│                                                                                         │
│  EV Heavy Trucks    ▲ 77% YoY Sales Growth (June Market Share >45%)                     │
│  ───────────────                                                                        │
│  Active Fleet       ▲ 33% Total EV Fleet Growth YoY (+12.1m EVs added in H1)           │
│  ───────────────                                                                        │
│  Charging Demand    ▲ 60% YoY Electricity Consumption via Charging Infrastructure       │
│  ───────────────                                                                        │
│  Displaced Oil      19 Mtoe Avoided in Q2 alone (36 Mtoe in H1 2026)                    │
│                                                                                         │
└─────────────────────────────────────────────────────────────────────────────────────────┘
Commercial Heavy Haulage
Sales of electric heavy-duty trucks skyrocketed by 77% year-on-year in Q2. By June, zero-emission trucks captured over 45% of all new heavy-vehicle sales in China. Displaced diesel in the freight and logistics sector served as the single largest driver of reduced oil consumption.
Fleet Expansion and Utilization
The total operational EV population reached unprecedented density, expanding 33% year-on-year. Of the 12.1 million new energy vehicles (NEVs) added in the first half of 2026, 8.1 million were fully electric battery vehicles (BEVs). Crucially, utilization of existing EVs surged: total electricity consumed via public and private charging infrastructure increased by 60% in Q2, indicating that plug-in hybrid owners increasingly opted for pure-electric driving modes to avoid high pump prices.
Fleet Displacement Volumes
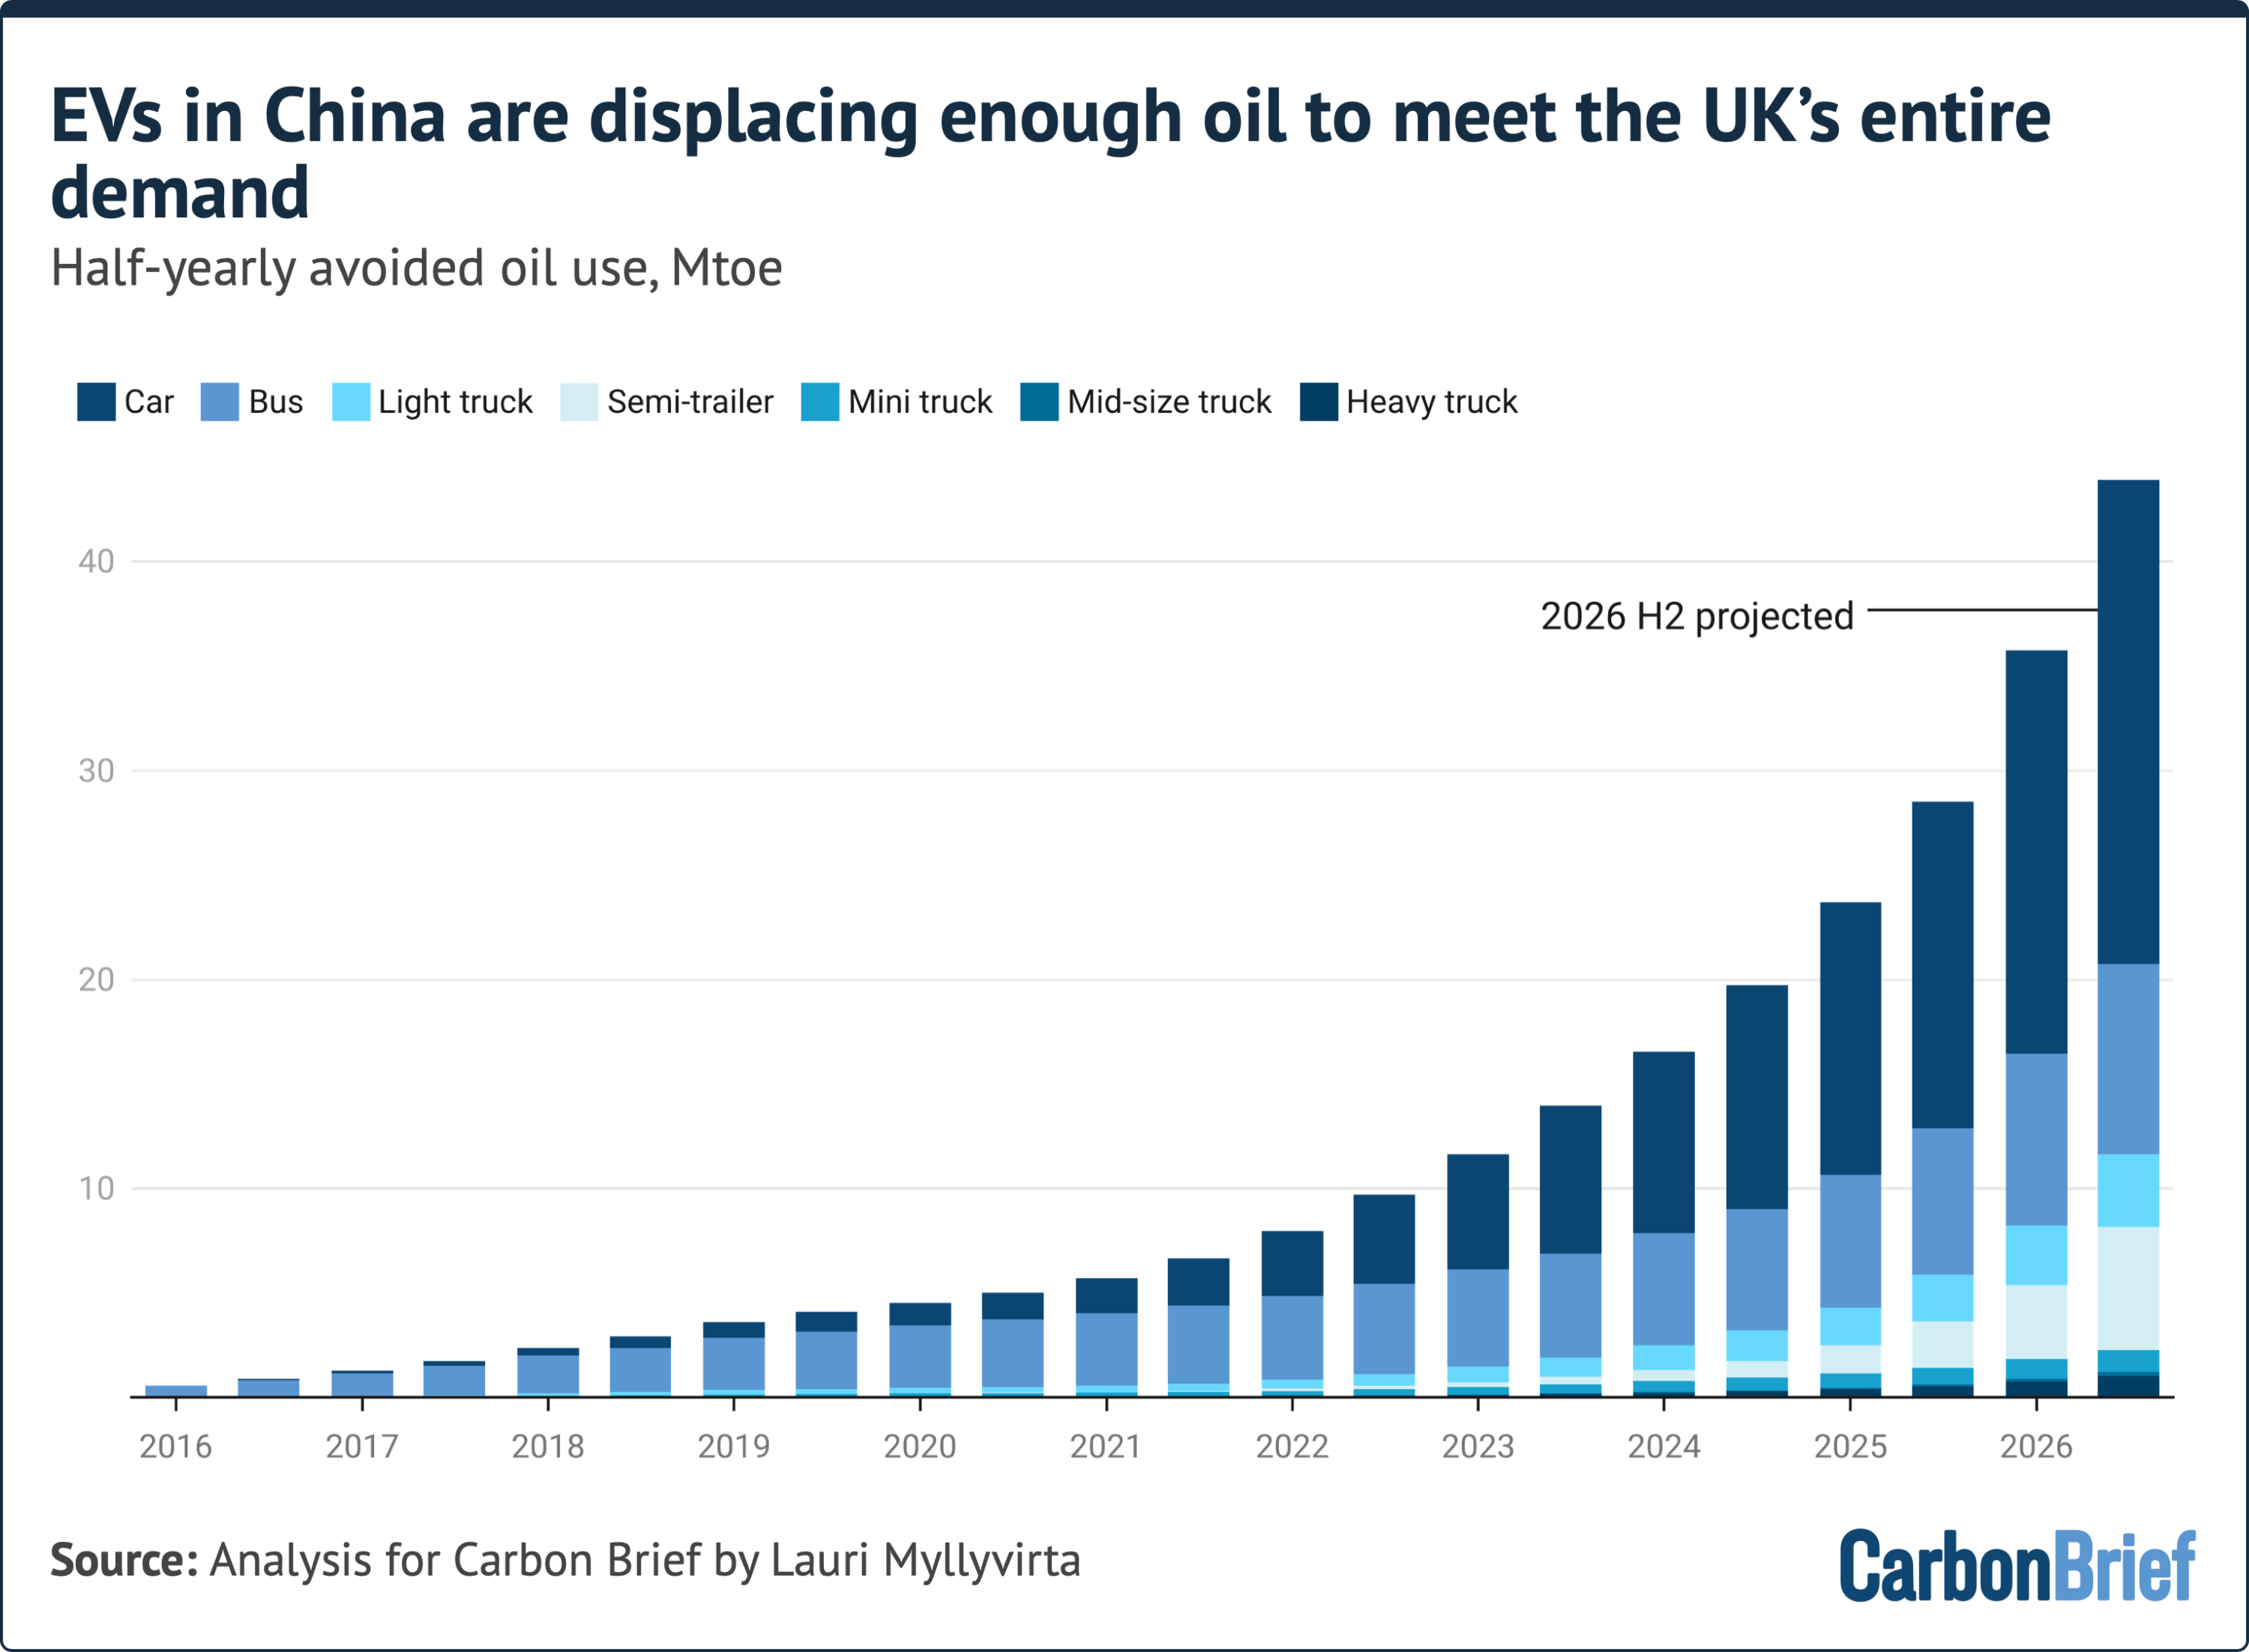
According to analysis by CREA and the China Association of Automobile Manufacturers, transport electrification displaced 19 million tonnes of oil equivalent (Mtoe) in Q2 2026 alone—a 50% year-on-year increase in avoided fuel. Over the first half of 2026, cumulative avoided oil reached 36 Mtoe, a figure that exceeds the total half-yearly oil consumption of the United Kingdom.
  HALF-YEARLY OIL DISPLACED BY ELECTRIC VEHICLES IN CHINA (Mtoe)

  H1 2024  ██████████████ 18 Mtoe
  H1 2025  ██████████████████████ 24 Mtoe
  H1 2026  ████████████████████████████████████ 36 Mtoe
           └─────────► Exceeds UK total 6-month oil consumption
If current charging growth holds through late 2026, annual displaced oil will hit 80 million tonnes, equivalent to the national oil demand of Mexico.
2. Heavy Industry and Construction: The Real Estate Drag
Beyond transportation, China’s industrial footprint reflected the ongoing recalibration of its broader economy away from fixed-asset real-estate investment.
       Q2 2026 INDUSTRIAL PRODUCTION IMPACT ON EMISSIONS
┌──────────────────────────────┬──────────────────┬────────────────────────┐
│ Industry Sector              │ Q2 Metric Change │ Direct Impact          │
├──────────────────────────────┼──────────────────┼────────────────────────┤
│ Cement Production            │ ▼ 9.0%           │ CO₂ reduction          │
│ Crude Steel Output           │ ▼ 1.0%           │ Process emissions down │
│ Pig Iron Production          │ ▼ 3.0%           │ Reduced metallurgical  │
│                              │                  │ coal consumption       │
│ Coal-to-Chemicals            │ Growth Stalled   │ High utilization caps  │
│ Ethylene (Petrochemical)     │ ▲ 17.0%          │ Offset oil decline     │
└──────────────────────────────┴──────────────────┴────────────────────────┘- Cement: Output contracted by 9% in the second quarter, accelerating from an 8% drop in Q1. This drop directly reflects reduced structural demand from housing projects and infrastructure builds.
- Metals: Crude steel production fell 1% year-on-year, while pig iron output dropped 3%, constraining process emissions and curbing metallurgical coal requirements.
- Coal-to-Chemicals: Despite surging crude oil prices—which typically make coal-based petrochemical alternatives far more competitive—coal-chemical output growth slowed significantly. Plants were already running near maximum operational capacity, leaving little room to expand market share.
3. The Power Sector Paradox: Coal’s Rise Amid a Clean Energy Surge
The primary counterweight to China’s declining oil emissions was the power generation sector, where emissions grew by 3.0% across the first half of 2026. This increase highlights ongoing challenges in power grid management and market design.
                      THE POWER SECTOR INFLEXIBILITY CYCLE
┌─────────────────────────────────────────────────────────────────────────────┐
│ 1. Massive Clean Buildout                                                   │
│    • Wind and Solar additions continue at high historical pace.             │
│    • Hydro rebounds (+9%), Nuclear expands (+2%).                           │
└──────────────────────────────────────┬──────────────────────────────────────┘
                                       │
                                       ▼
┌─────────────────────────────────────────────────────────────────────────────┐
│ 2. Grid & Market Rigidities                                                 │
│    • Inflexible long-distance transmission agreements.                      │
│    • Outmoded off-take pricing contracts for thermal power plants.          │
│    • Wave of new legacy coal plants entering service (30GW in H1 2026).     │
└──────────────────────────────────────┬──────────────────────────────────────┘
                                       │
                                       ▼
┌─────────────────────────────────────────────────────────────────────────────┐
│ 3. Systemic Outcome                                                         │
│    • Clean power curtailed ("wasted") due to regional oversupply.           │
│    • Sub-optimal wind weather lowers natural capacity factors.              │
│    • Coal power dispatched (+2.4%) to meet baseline demand growth.          │
└─────────────────────────────────────────────────────────────────────────────┘
Despite adding clean generating capacity capable of covering up to 5% annual demand growth, fossil-fuel power generation rose due to two key structural bottlenecks:
- Unfavorable Wind Conditions: Wind velocity patterns across inland provinces fell well below long-term seasonal averages, reducing yield per turbine.
- Systemic Curtailment: Grid operators frequently curtailed ("wasted") variable solar and wind output. Legacy grid operating policies prioritize fixed long-term commercial contracts for coal generators over real-time renewable integration.
This issue was compounded by a new wave of coal-fired capacity entering service. Chinese utilities brought 30 gigawatts (GW) of new coal power online during the first six months of 2026 alone—the highest rate of commissioning since 2016. An additional 25 GW broke ground, while less than 3 GW of aging capacity was retired.
Official Statements, Policy Frameworks & Strategic Directives
The emissions data coincides with a major legislative period, as Chinese ministries rolled out sectoral 15th Five-Year Plan (2026–2030) policy documents. These plans formalize broad strategic directives across energy, power, and transport infrastructure.
                     15TH FIVE-YEAR PLAN POLICY DIRECTIVES
┌───────────────────────────┬─────────────────────────────────────────────────┐
│ Plan Focus Area           │ Strategic Target / Policy Adjustment            │
├───────────────────────────┼─────────────────────────────────────────────────┤
│ Electrification Target    │ Raise electricity to 35% of end-use energy      │
│                           │ by 2030 (up from 30% in 2025).                  │
│ EV Fleet Penetration      │ Expand NEV fleet share to 30% total (up from    │
│                           │ 12% in 2025); 25% of commercial vehicles.       │
│ Renewable Curtailment     │ Maximum provincial curtailment allowance         │
│ Caps                      │ relaxed from 5–10% up to 15%.                   │
│ Coal Policy Pivot         │ Shift from "gradual reduction" to coal          │
│                           │ consumption "entering a plateau" through 2030.  │
│ Nuclear Infrastructure    │ Approved 8 new reactors in July 2026; 5 units   │
│                           │ (4.5GW) entering operation in 2026.             │
└───────────────────────────┴─────────────────────────────────────────────────┘
Expert Analysis
Lauri Myllyvirta, lead analyst at the Centre for Research on Energy and Clean Air (CREA) and author of the assessment, emphasized the importance of the shift:
"China’s emissions fell in the second quarter despite an increase in coal use. For the first time ever, a drop in oil use was sufficient to drive a decline in emissions overall… The emission trend remains a race between energy demand growth and clean-energy growth, both of which have slowed down this year."
Sectoral 15th Five-Year Plans
The rollout of sectoral plans by the National Development and Reform Commission (NDRC) and National Energy Administration (NEA) points to several structural priorities:
Accelerated Electrification
Beijing raised its official electrification target, aiming for electricity to account for 35% of total final energy consumption by 2030, up from 30% in 2025 and 26.5% in 2020. The transport plan mandates that NEVs represent 30% of all vehicles on the road by 2030, up from 12% at year-end 2025.
Revised Curtailment Framework
The newly released Power Sector Five-Year Plan officially relaxed historical limits on renewable energy curtailment. Where curtailment was previously capped strictly at 5%—and later relaxed to 10% in resource-rich western regions—the new framework allows certain provinces to tolerate up to 15% curtailment to prevent grid instability while longer transmission lines are built.
Redefining the Role of Coal
The updated policy framing marks a subtle shift in official language. While earlier high-level declarations targeted a "gradual reduction" in coal burning between 2026 and 2030, the new directives state that coal consumption will "enter a plateau." Furthermore, regulators vowed to apply "reasonable control" over coal-power capacity and generation, signaling stricter criteria for future plant approvals alongside a broader reliance on non-coal balancing options, including battery storage, virtual power plants (VPPs), and demand-side response.
Future Outlook: The Race Between Clean Energy Growth and Power Grid Bottlenecks
As China navigates the remainder of 2026, the trajectory of its national carbon profile will depend on the balance between two opposing dynamics: unprecedented transport electrification versus power grid infrastructure limitations.
                CHINA'S EMISSIONS TRAJECTORY: KEY FORCES
┌────────────────────────────────────────┬────────────────────────────────────────┐
│ DEPRESSING EMISSIONS (Structural)     │ ELEVATING EMISSIONS (Friction)        │
├────────────────────────────────────────┼────────────────────────────────────────┤
│ • Transport electrification surge      │ • Inflexible power dispatch contracts │
│ • Sluggish real-estate construction    │ • 204GW coal capacity under construction│
│ • Rapid grid battery buildout (153GW)  │ • Increased curtailment caps (up to 15%)│
│ • Hydropower and nuclear expansion     │ • Industrial heating coal consumption  │
└────────────────────────────────────────┴────────────────────────────────────────┘
1. Sustained Oil Demand Destruction
The structural shock delivered to liquid fuels during Q2 is unlikely to reverse. The combination of high fuel price sensitivity, expanding EV market share in freight, and aggressive fleet substitution by urban taxi and logistics networks has permanently reduced domestic petrol and diesel demand.
As charging infrastructure expands—supported by 153 GW of utility-scale battery storage already installed nationwide—electric vehicles will continue to absorb a growing share of transport energy demand.
2. Resolving Grid Bottlenecks
To translate rapid additions of solar, wind, nuclear, and hydro power into net reductions in fossil fuel use, Chinese energy planners must accelerate structural power market reforms:
- Contract Flexibility: Transitioning away from fixed monthly purchase contracts for coal plants toward dynamic day-ahead and real-time spot market dispatch.
- Transmission Capacity: Completing ultra-high voltage (UHV) direct-current lines connecting remote solar bases in the western deserts to heavy demand centers along the eastern seaboard.
- Storage Integration: Expanding energy storage systems beyond the 17 GW added in H1 2026 to ensure grid stability without relying on coal plants for baseload capacity.
Conclusion
China’s Q2 2026 performance shows that its clean energy strategy has entered a new phase. While previous reductions in emissions relied on heavy-handed administrative cuts to coal-intensive manufacturing, the latest drop was driven by structural technology substitution in the transportation sector.
With overall energy demand growth slowing from post-pandemic highs down to roughly 5%, China’s non-fossil capacity expansion is now large enough to meet all incremental energy demand. If grid regulators successfully resolve curtailment issues and integrate variable renewables efficiently, China’s carbon emissions will not merely plateau—they will enter a sustained structural decline.