Executive Overview
An unprecedented marine heat surge in the equatorial Pacific Ocean has propelled the 2026 "super El Niño" into record-breaking territory, threatening to upend global climate dynamics, agricultural stability, and extreme weather projections. Data confirmed by atmospheric and oceanic research bodies indicates that sea surface temperature anomalies in the central tropical Pacific have equaled—and by some baseline measurements, surpassed—the all-time daily records established during the catastrophic El Niño event of 2015–2016.
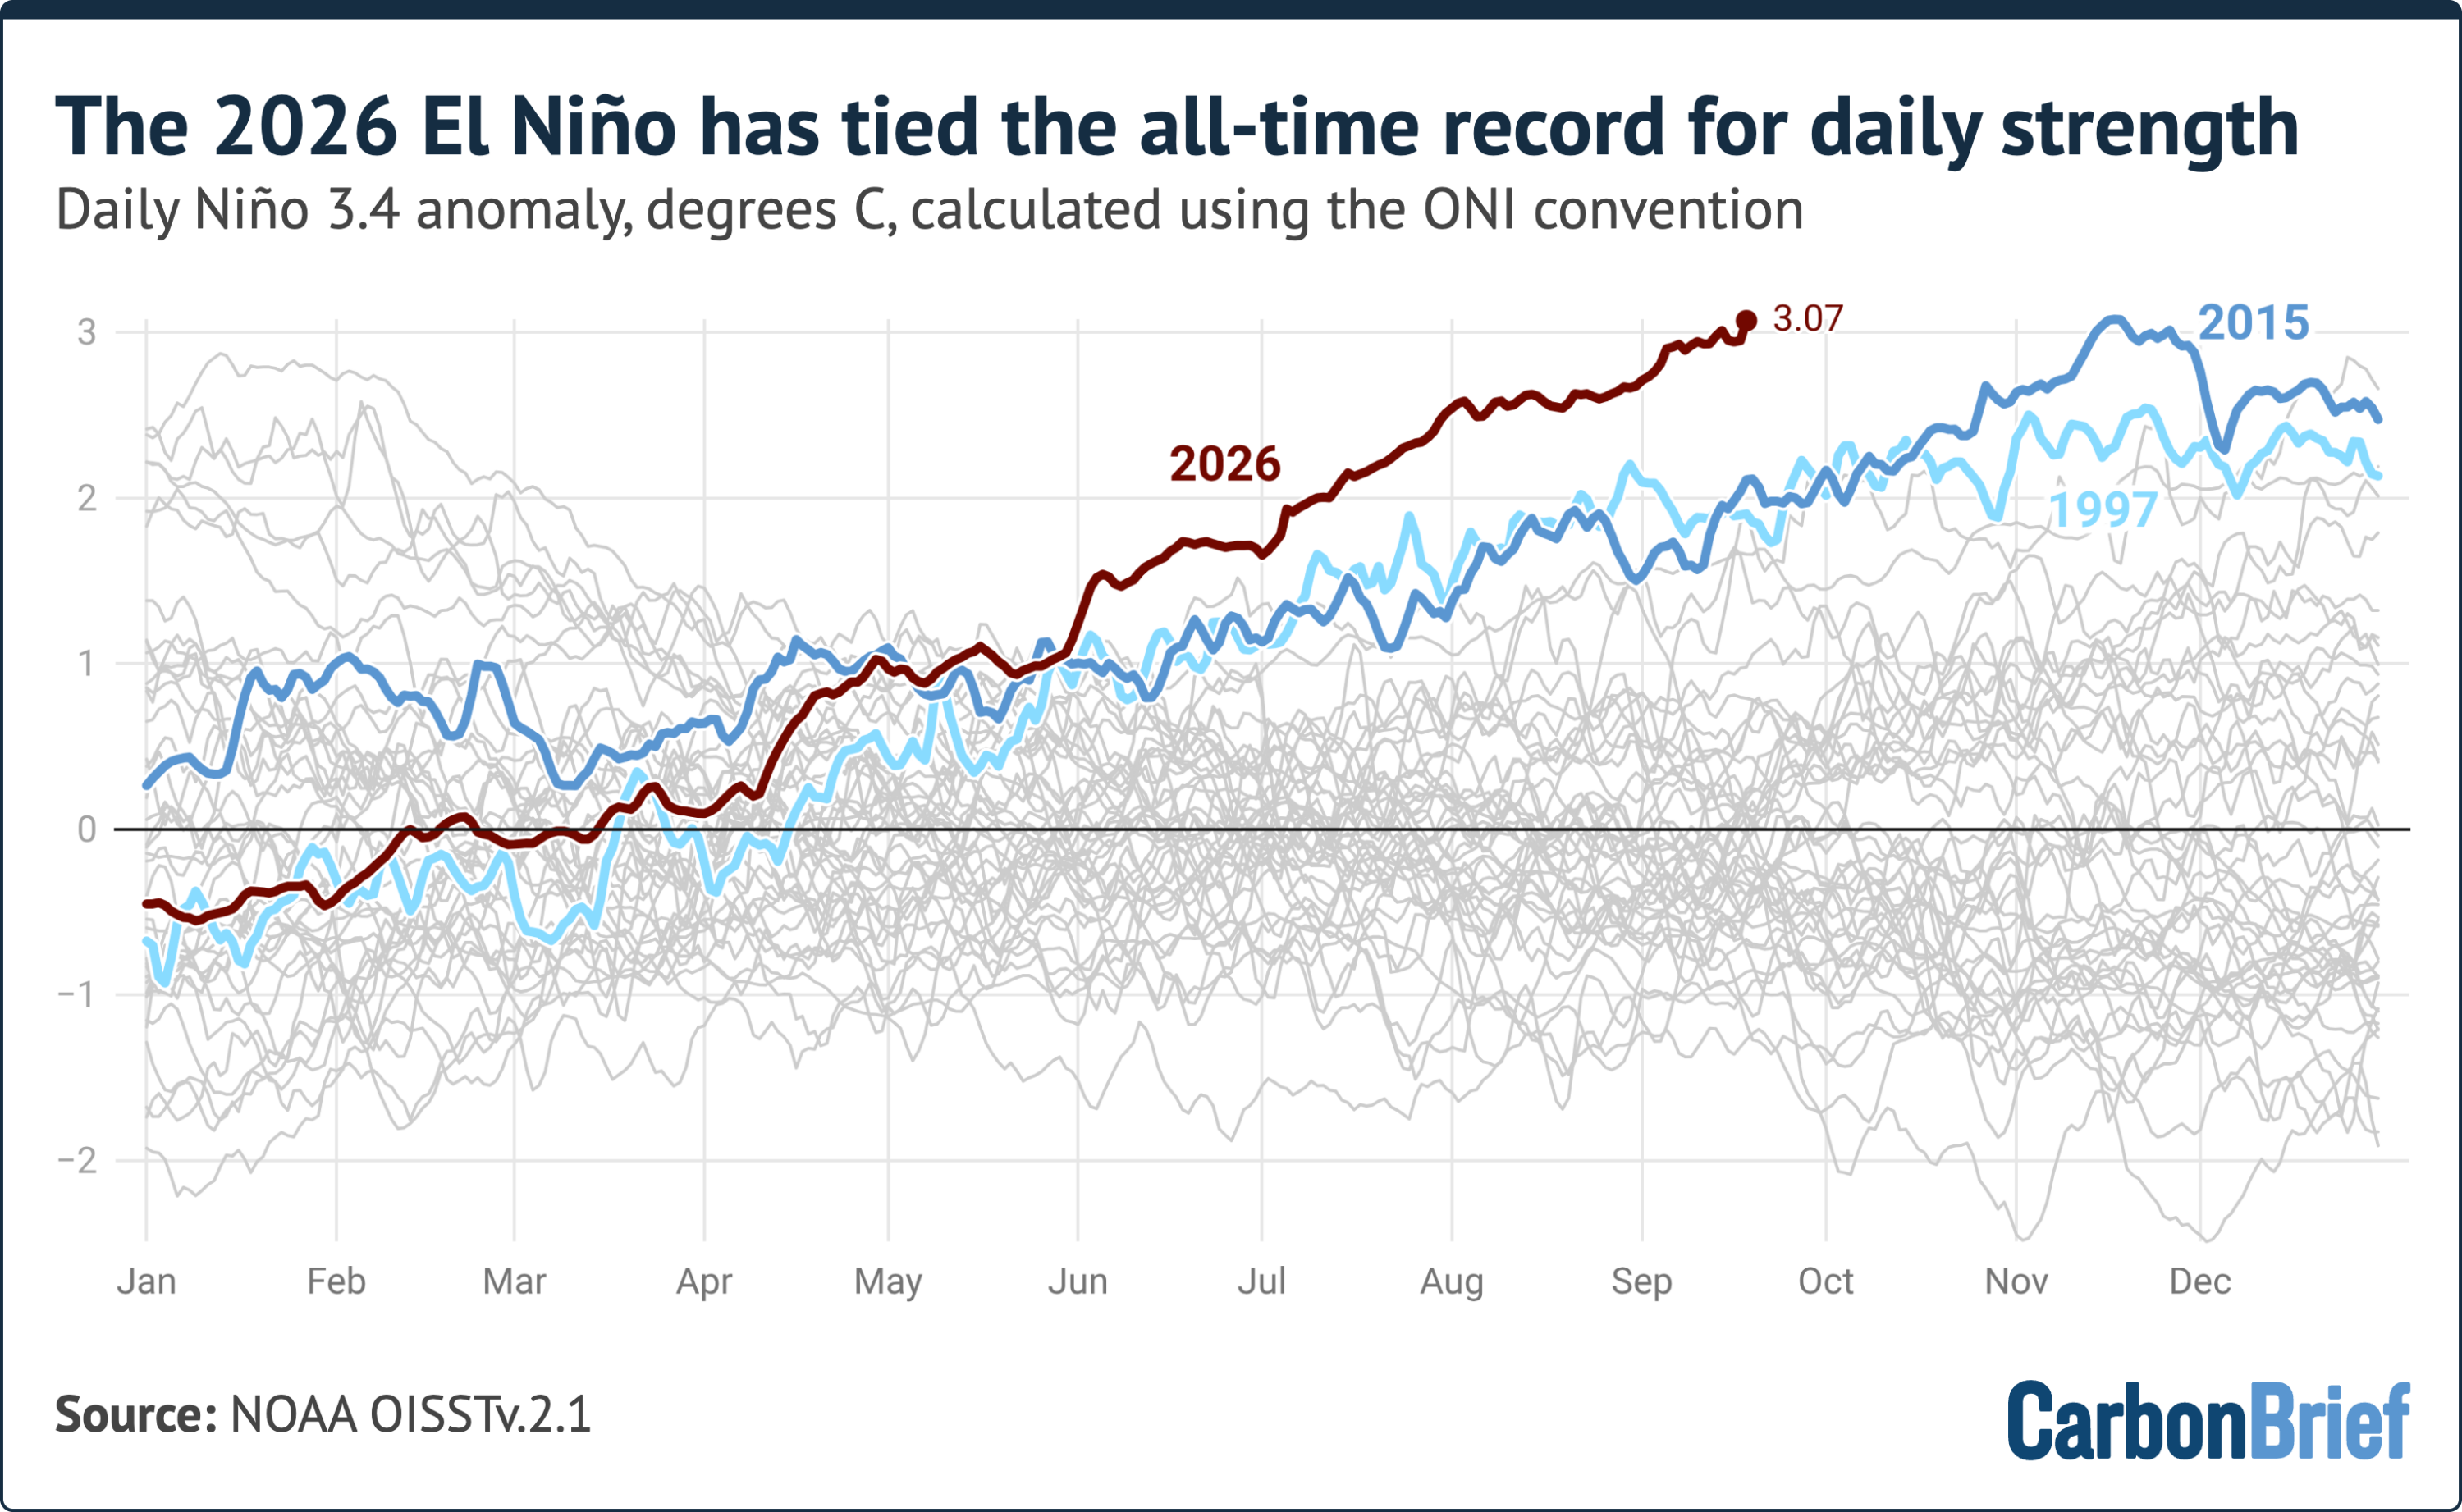
As of mid-September 2026, the daily temperature anomaly in the critical Niño 3.4 region reached an astounding 3.07°C above historical baselines. What distinguishes the current event from its historical precursors is not merely its absolute temperature anomaly, but its astonishing rate of intensification and extraordinarily early calendar trajectory. Historically, El Niño events peak during the Northern Hemisphere’s winter months—typically late November through January. Breaching the 3.0°C threshold by September suggests an oceanic warming trajectory without precedent in the modern instrumental record.
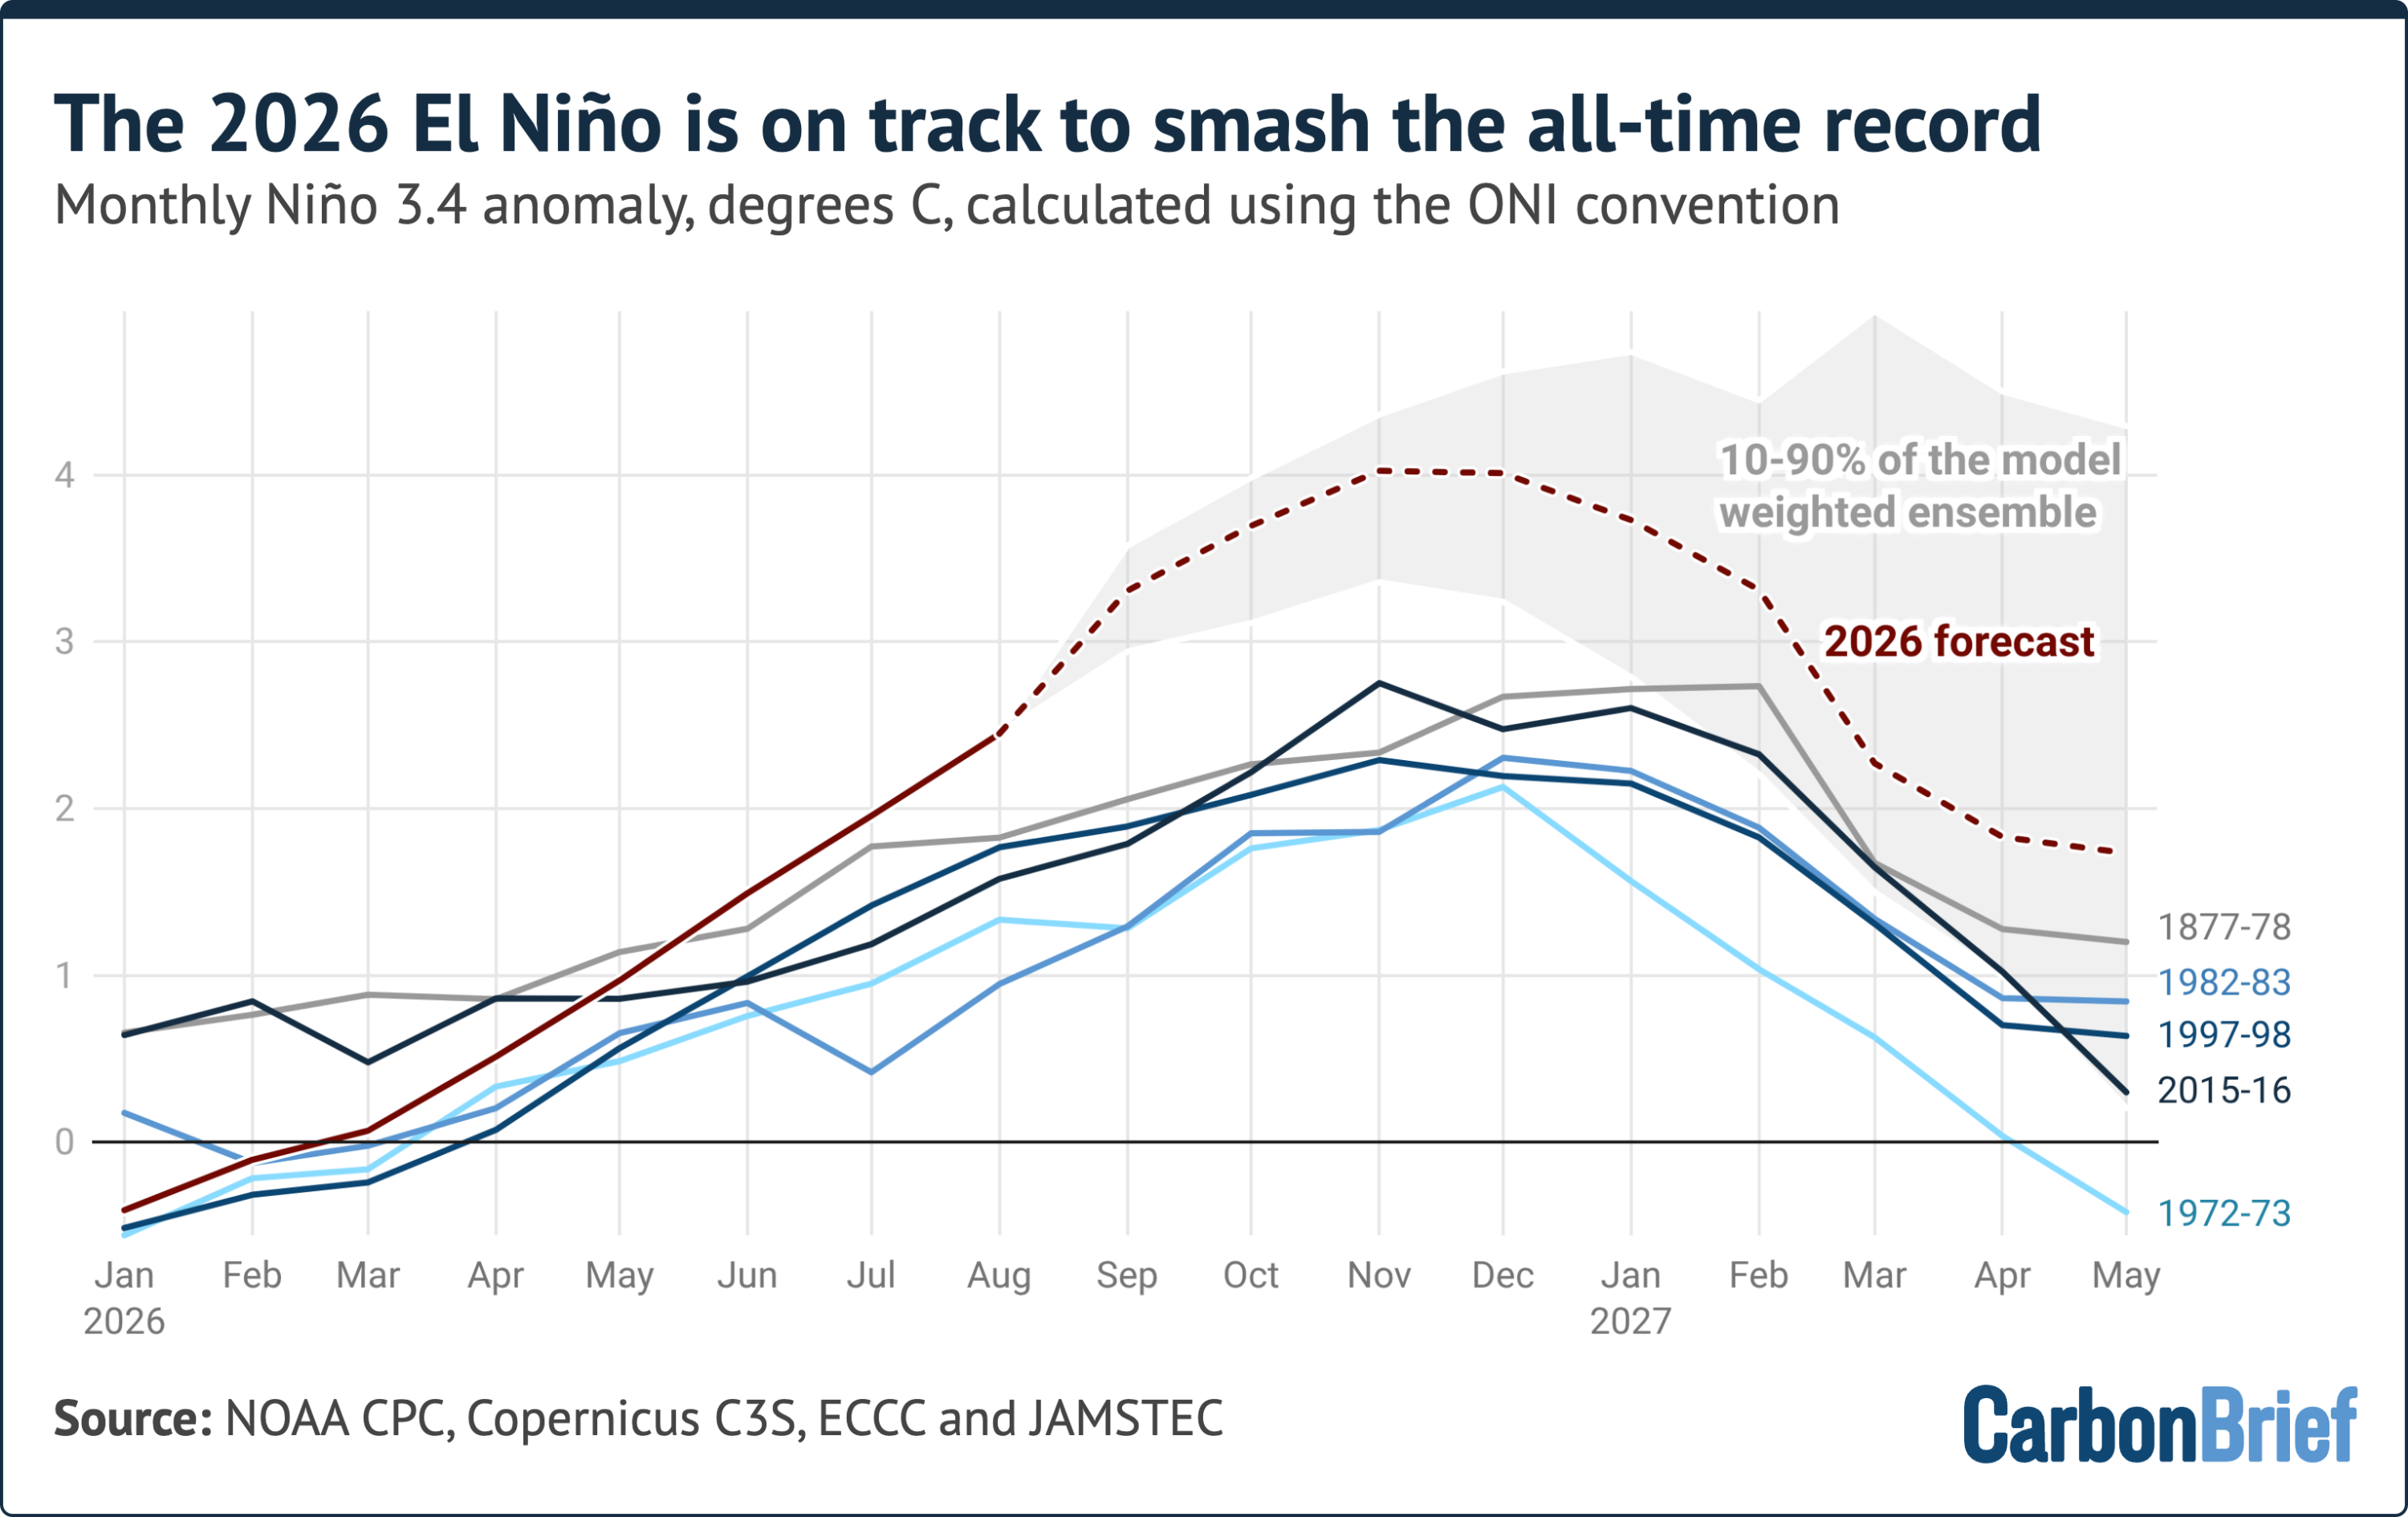
International climate modeling centers forecasting through late 2026 and early 2027 project that the event has yet to reach its apex. Multi-model ensemble forecasts suggest monthly anomalies could peak above 4.1°C between November and January. Because the atmospheric response to Pacific ocean warming operates on a multi-month lag, while 2026 is already on track to rank among the warmest years ever recorded, the full planetary impact of this extreme event will predominantly reverberate across 2027.

Detailed Chronology
2026 Super El Niño: Timeline of Intensification
├── June 2026: Formal onset declared; rapid tropical Pacific warming begins.
├── Early August 2026: Monthly Niño 3.4 anomaly reaches 2.45°C (3rd highest on record).
├── Early September 2026: Anomalies exceed 1997 & 2015 comparative benchmarks by >1.0°C.
├── September 19, 2026: Daily Niño 3.4 anomaly reaches 3.07°C, tying all-time daily record.
└── Late 2026 – Early 2027 (Forecast): Model ensembles project peak anomaly near ~4.1°C.
The Inception: June 2026
The current event formally materialized in June 2026, following a rapid collapse of easterly trade winds across the tropical Pacific basin. Warm subsurface waters trapped in the western Pacific migrated eastward as a series of downwelling Kelvin waves, quickly suppressing the cold-water upwelling off the coast of South America and initiating a sharp warming trend across thousands of miles of ocean.
Unprecedented Summer Acceleration: July–August 2026
Throughout July and August, the velocity of intensification outpaced all previous events on record. By early September, conditions had dramatically diverged from the onset timelines of historical benchmark events:
- In early September 1997 and 2015, sea surface temperature anomalies in the central Pacific hovered around 1.9°C above baseline.
- In early September 2026, the daily anomaly breached 2.9°C, standing more than a full degree Celsius higher than the same calendar point in previous "super" events.
The September Threshold
On September 19, 2026, the daily anomaly within the Niño 3.4 monitoring zone officially reached 3.07°C. This statistically matched the absolute daily peak recorded on November 18, 2015 (3.08°C), an event that occurred two months later in the seasonal cycle. Under alternative analytical baselines utilized by independent meteorological organizations, the 2026 event had already established a definitive new all-time high water mark for daily ocean warming.
Supporting Context & Metrics
Evaluating the magnitude of an El Niño event requires tracking specific oceanic sub-regions and applying rigorous statistical indices. The primary geographical benchmark used by global climate agencies is the Niño 3.4 region, a swath of the equatorial Pacific spanning latitudes 5°N to 5°S and longitudes 120°W to 170°W.
+-------------------------------------------------------------------------+
|                    EL NIÑO SEVERITY CLASSIFICATION                      |
+-------------------+-----------------------------------------------------+
| Classification    | Niño 3.4 Anomaly Threshold                          |
+-------------------+-----------------------------------------------------+
| Weak              | +0.5°C to +0.9°C                                    |
| Moderate          | +1.0°C to +1.4°C                                    |
| Strong            | +1.5°C to +1.9°C                                    |
| Very Strong       | +2.0°C and above                                    |
| Current (Sep 2026)| +3.07°C  [Record Territory]                          |
+-------------------+-----------------------------------------------------+
To isolate natural climate variability from secular background warming caused by human-induced greenhouse gas emissions, scientists deploy distinct analytical metrics.
1. Oceanic Niño Index (ONI)
The Oceanic Niño Index (ONI), managed by the U.S. National Oceanic and Atmospheric Administration (NOAA), measures sea surface temperature anomalies relative to a centered 30-year climate baseline (currently 1991–2020). By continuously updating this baseline, ONI filters out much of the background trend of global ocean warming, offering a clear picture of localized ocean-atmosphere coupling.
- Under the ONI metric, the August 2026 monthly average anomaly reached 2.45°C.
- This monthly figure is surpassed in the 150-year instrumental record only by November/December 2015 (2.75°C) and the reconstructed historical event of 1877–1878 (~2.7°C).
2. Relative Oceanic Niño Index (RONI)
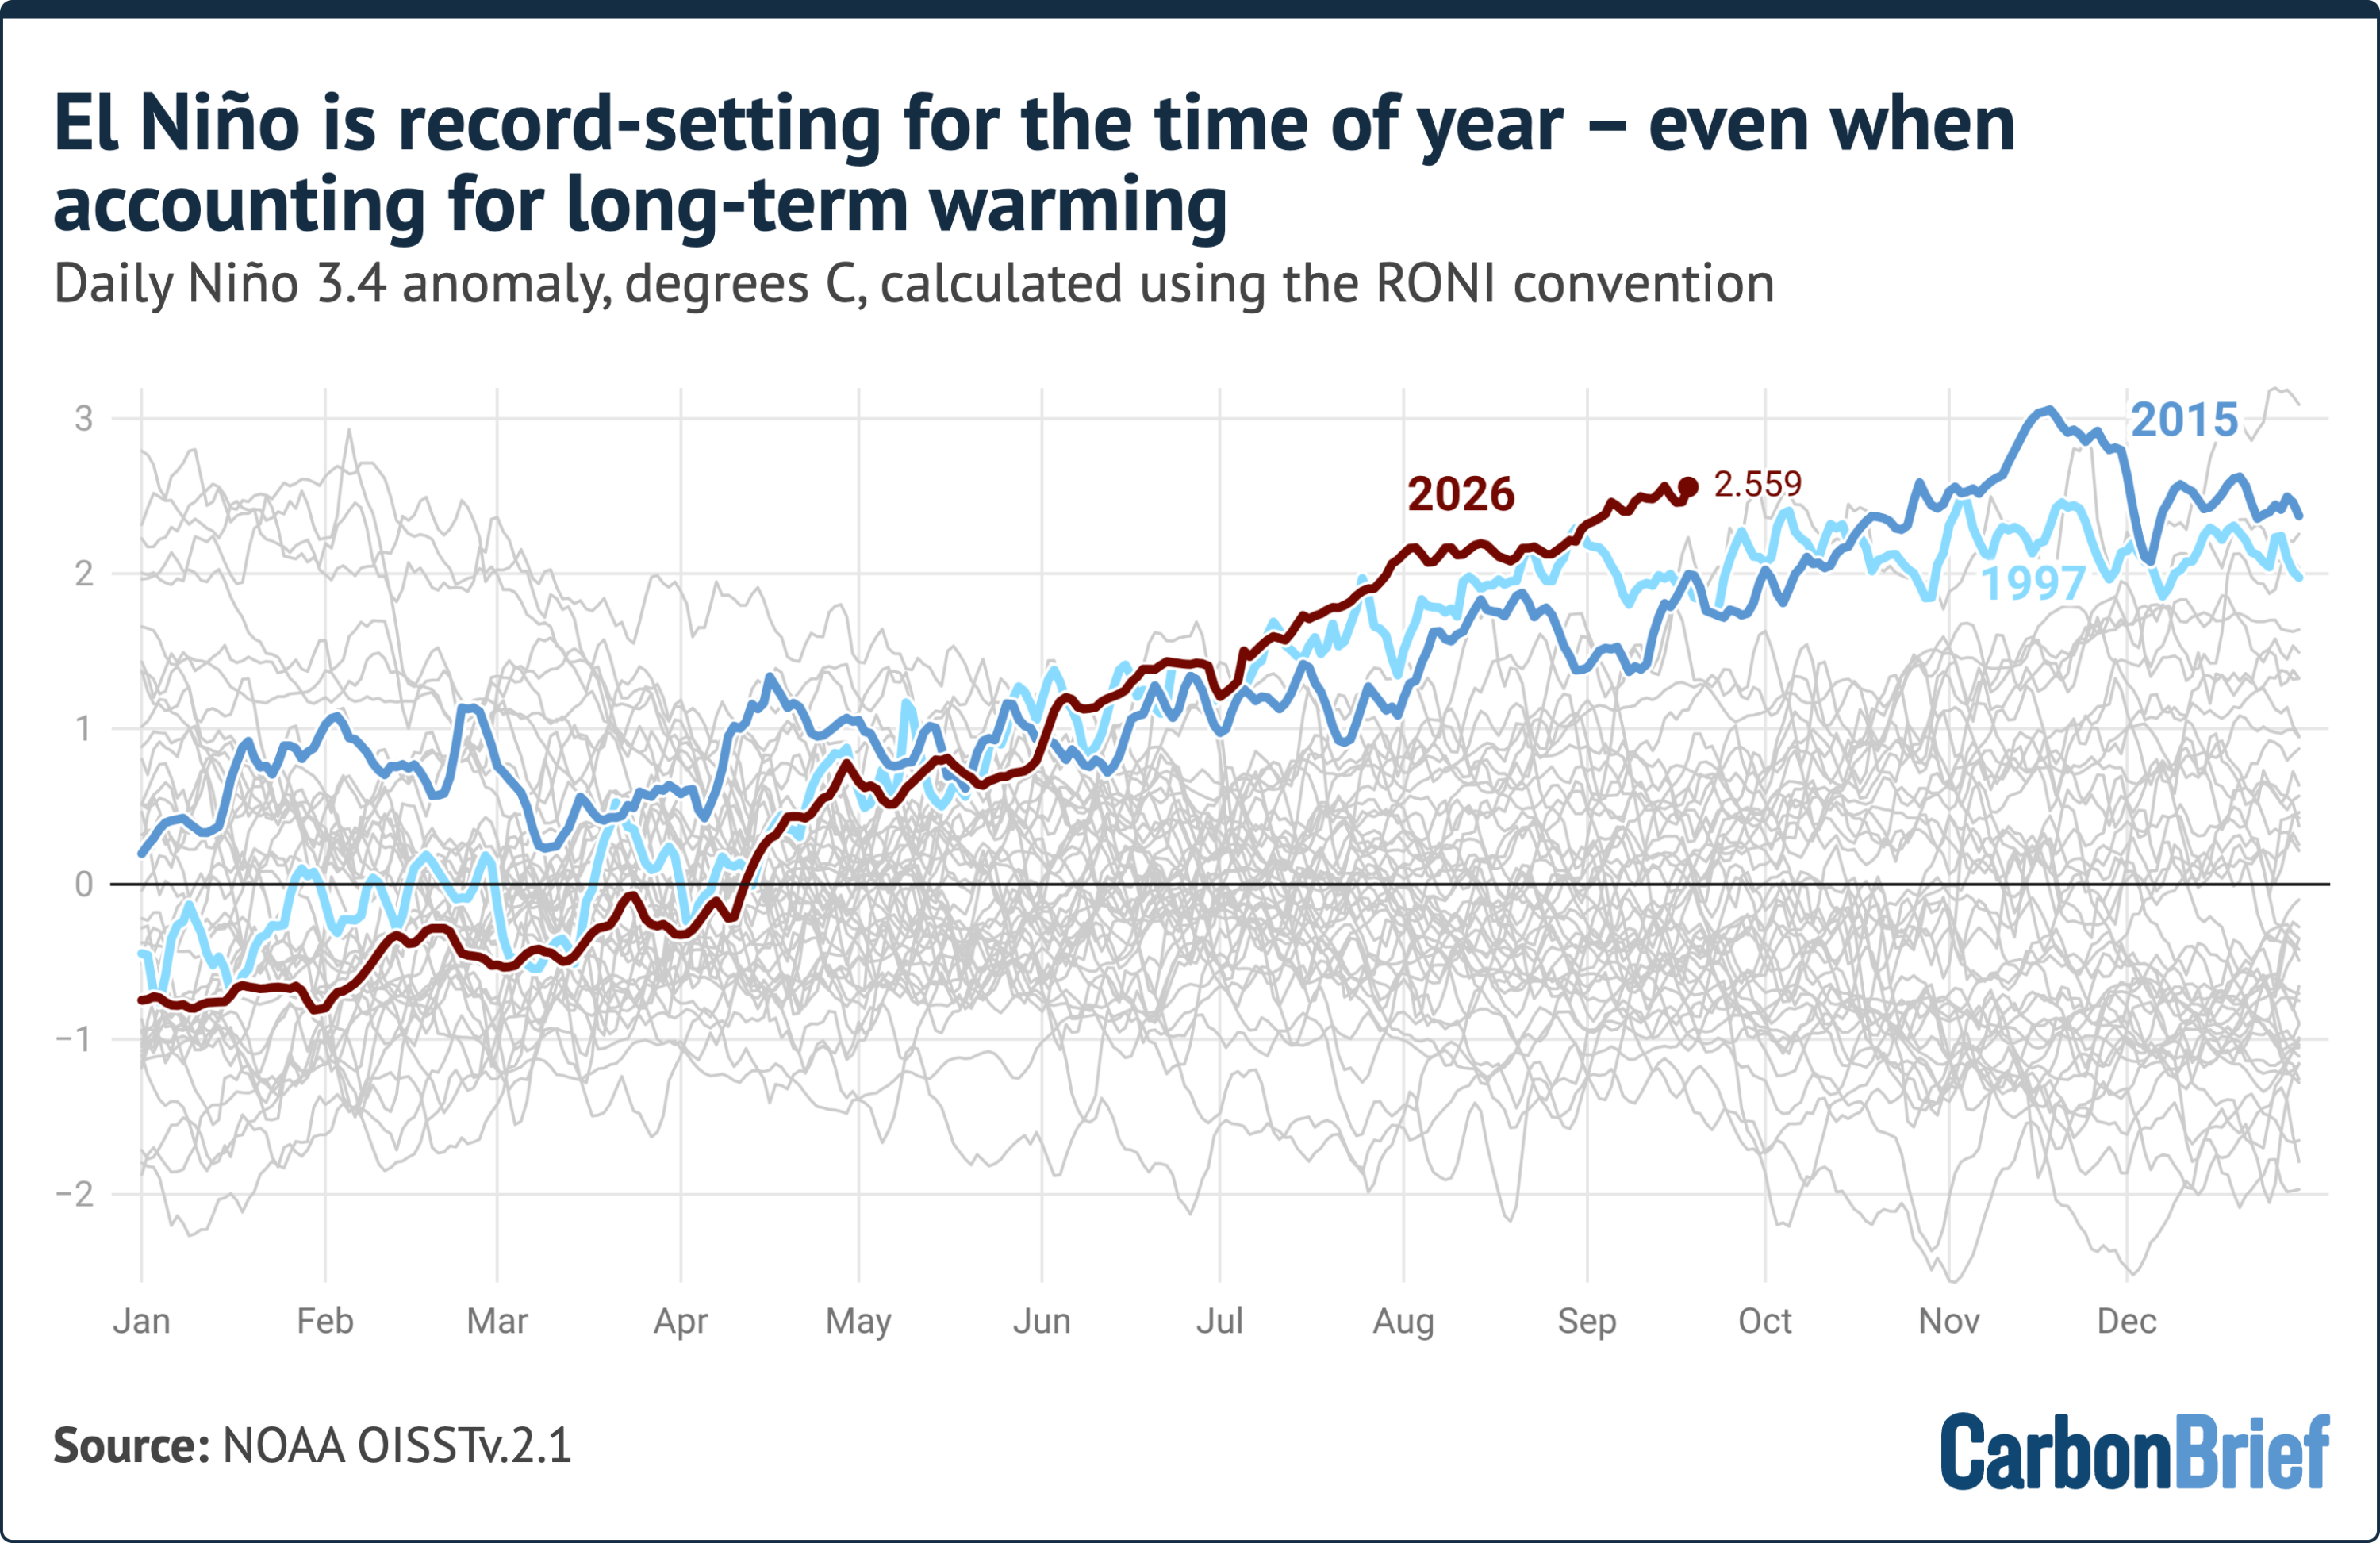
To further refine the signal, NOAA introduced the Relative Oceanic Niño Index (RONI) in 2024. RONI calculates the temperature anomaly in the Niño 3.4 zone relative to the broader tropical ocean standard (between 20°N and 20°S).
- By subtracting broader tropical anomalies, RONI removes general marine heatwave signals.
- In mid-September 2026, the daily RONI value hovered near 2.5°C.
- While this remains below the absolute RONI record set during the peak of the 1982–1983 El Niño (~3.2°C), it represents an all-time record for the month of September. Past major events typically added between 0.5°C and 1.9°C to their RONI metrics between mid-September and their winter peaks.
Official Statements & Analytical Nuance
Scientific Consensus on Event Trajectory
Meteorological analysts and oceanographers emphasize that every strong El Niño in recorded history has continued to intensify past mid-September. The persistent presence of anomalous westerly winds across the equatorial Pacific continues to suppress normal upwelling, feeding warm water into the surface layers.
Climate scientists analyzing the daily data noted via public updates that the sheer speed of development distinguishes 2026 from any prior analog. Using modern 1991–2020 baseline reference points, multiple research groups confirmed that daily anomalies in the central Pacific crossed into unprecedented statistical territory earlier in the year than ever observed.
Methodological Caveats in Predictive Modeling
While observational data confirms record-setting conditions today, scientists urge measured evaluation regarding predictive climate models projecting late-winter peaks.
Peak Monthly Anomaly Projections (Winter 2026–2027)
├── Historical Record (2015-16 Peak):  2.75°C
├── 2026 Ensemble Forecast Mean:       4.10°C  [+1.35°C over record]
└── 80% Model Confidence Band:        3.40°C to 4.60°C
A predictive synthesis combining 14 seasonal forecast models across 674 individual ensemble runs projects a mean peak monthly anomaly of 4.1°C between November 2026 and January 2027. Fully 80% of model iterations project peak anomalies between 3.4°C and 4.6°C, with every single model run exceeding the 2015–2016 record of 2.75°C.
However, forecasters stress two important technical caveats:

- Unprecedented Domain: Dynamical seasonal prediction systems have never been validated against an event of this magnitude. Model physics can experience non-linear biases when forced into extreme, unobserved states.
- Summer Initialization Drift: Real-world observations during August 2026 tracked roughly 0.3°C below the most aggressive model forecasts initialized earlier in the summer, indicating that while conditions are undeniably extreme, models may maintain a slight warm bias.
Future Outlook & Global Downstream Impacts
The implications of a super El Niño of this magnitude extend far beyond marine metrics in the Pacific. Because El Niño alters the Walker Circulation—the primary atmospheric heat engine of the tropics—it triggers planetary-scale teleconnections that disrupt weather patterns across every continent.
       GLOBAL DOWNSTREAM IMPACT MATRIX (2026–2027)

  +-----------------------+     +-----------------------+
  |  Southeast Asia/Indo  |     |   The Americas        |
  |  - Severe Drought     |     |  - Torrential Rains   |
  |  - Peatland Fires     |     |  - Coastal Flooding   |
  |  - Record Emissions   |     |  - Atmospheric Rivers |
  +-----------+-----------+     +-----------+-----------+
              |                             |
              +--------------+--------------+
                             |
                 +-----------v-----------+
                 | Planetary Heat Spike  |
                 | - Delayed Global Peak |
                 | - 2027 Temp Overshoot |
                 | - Ecosystem Stress    |
                 +-----------------------+
1. Fire Emissions and Drought in Southeast Asia
The immediate impact of the 2026 event is already severe in Southeast Asia, particularly across Indonesia and Malaysia. The displacement of atmospheric convection away from the western Pacific brings severe drought to the region. Indonesian peatlands and tropical forests are experiencing intense drying, driving wildfire activity. Early monitoring metrics indicate that Indonesian fire emissions in 2026 are on track to rival or surpass the century records set during the devastating 2015 fire season, releasing immense quantities of carbon dioxide and hazardous particulate matter into the atmosphere.
2. Global Surface Temperature Lag into 2027
Global surface temperatures historically peak several months after an El Niño reaches its oceanographic apex, as massive quantities of heat stored in the ocean are released into the atmosphere.
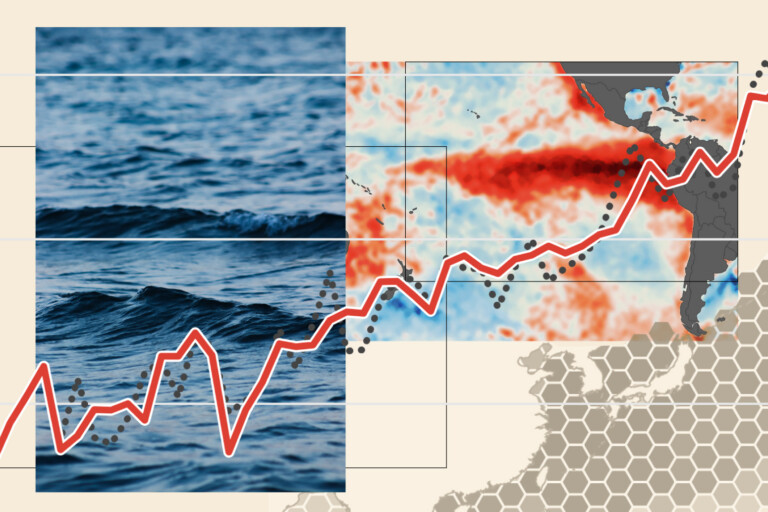
- Current quarterly analyses place 2026 on track to be the warmest or second-warmest year on record, driven by background global warming combined with early El Niño conditions.
- The primary thermal overshoot, however, will occur in 2027. If the current ocean warming trajectory continues through the winter, 2027 could experience unprecedented global temperature spikes, pushing the planetary annual mean anomaly significantly above pre-industrial baselines and testing international climate mitigation limits.
3. Extreme Weather and Agricultural Disruption
As the system approaches its winter peak, teleconnection patterns are expected to trigger:
- The Americas: Heightened risk of severe atmospheric rivers, heavy precipitation, and mudslides across western South America and the southern United States.
- Marine Ecosystems: Severe coral bleaching events across the Pacific basin, collapsing local fisheries through thermal stress and nutrient starvation.
- Global Agriculture: Disrupted monsoon patterns in South Asia and acute drought in Southern Africa, straining global food supply chains and commodity markets.
As scientists monitor the daily evolution of the Niño 3.4 region heading into the fourth quarter of 2026, the global community faces an unprecedented climate test—one where ocean temperatures have entered unchartered territory, setting the stage for profound environmental and socioeconomic disruptions through 2027.