Global climate modeling is undergoing its most significant structural evolution in a decade. As climate modeling groups around the world prepare simulations for the Intergovernmental Panel on Climate Change (IPCC) Seventh Assessment Report (AR7), a newly published framework of greenhouse gas emissions pathways marks a fundamental departure from past practice.
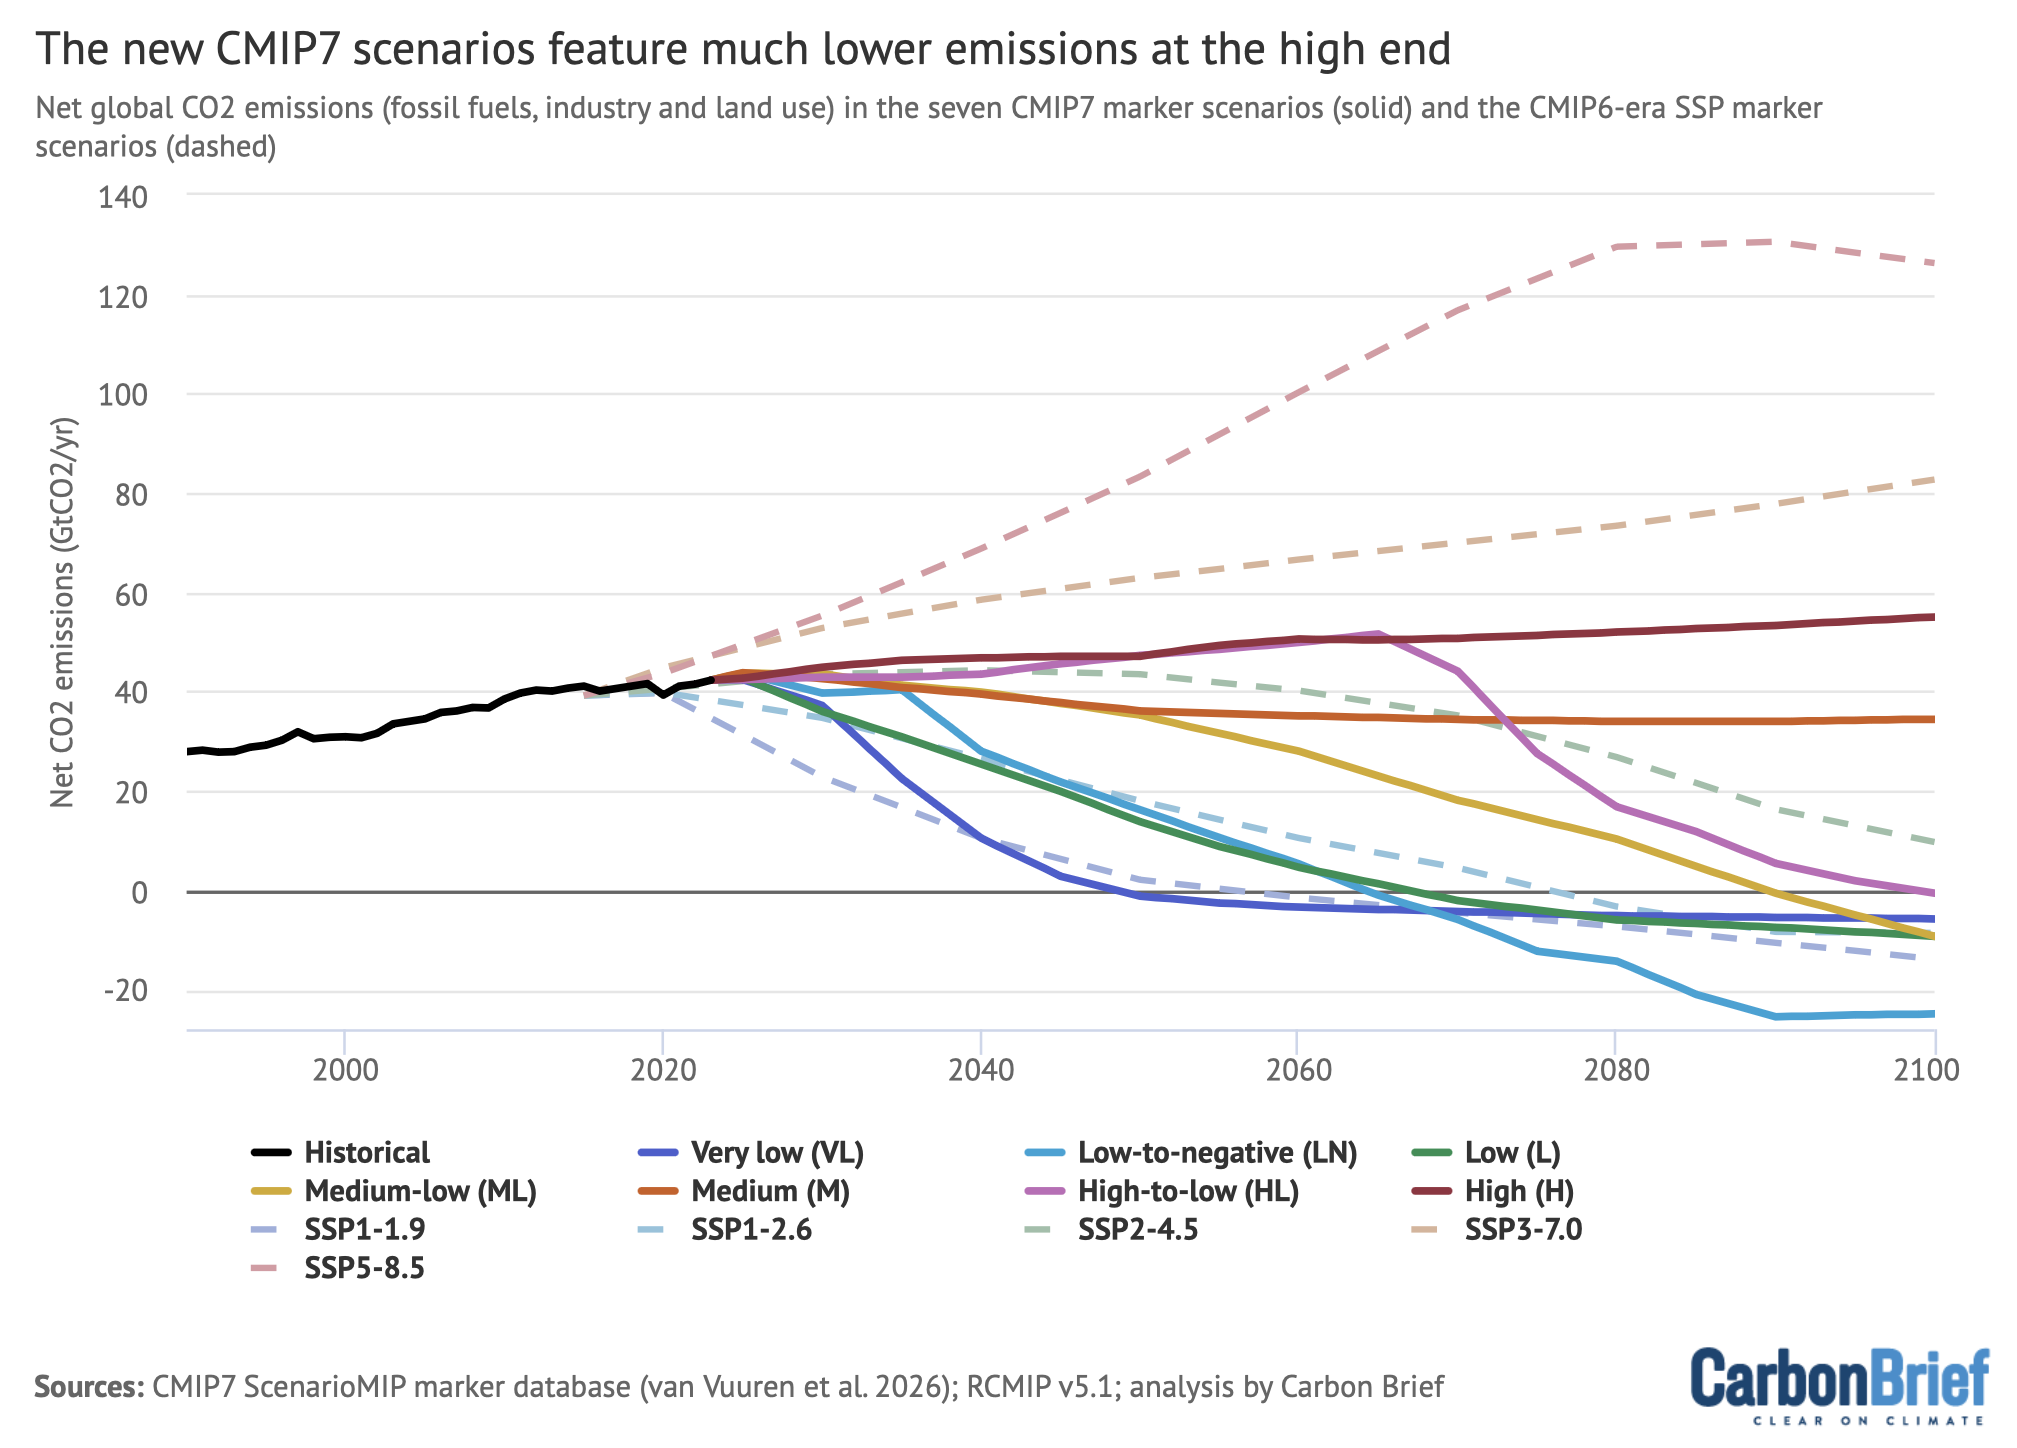
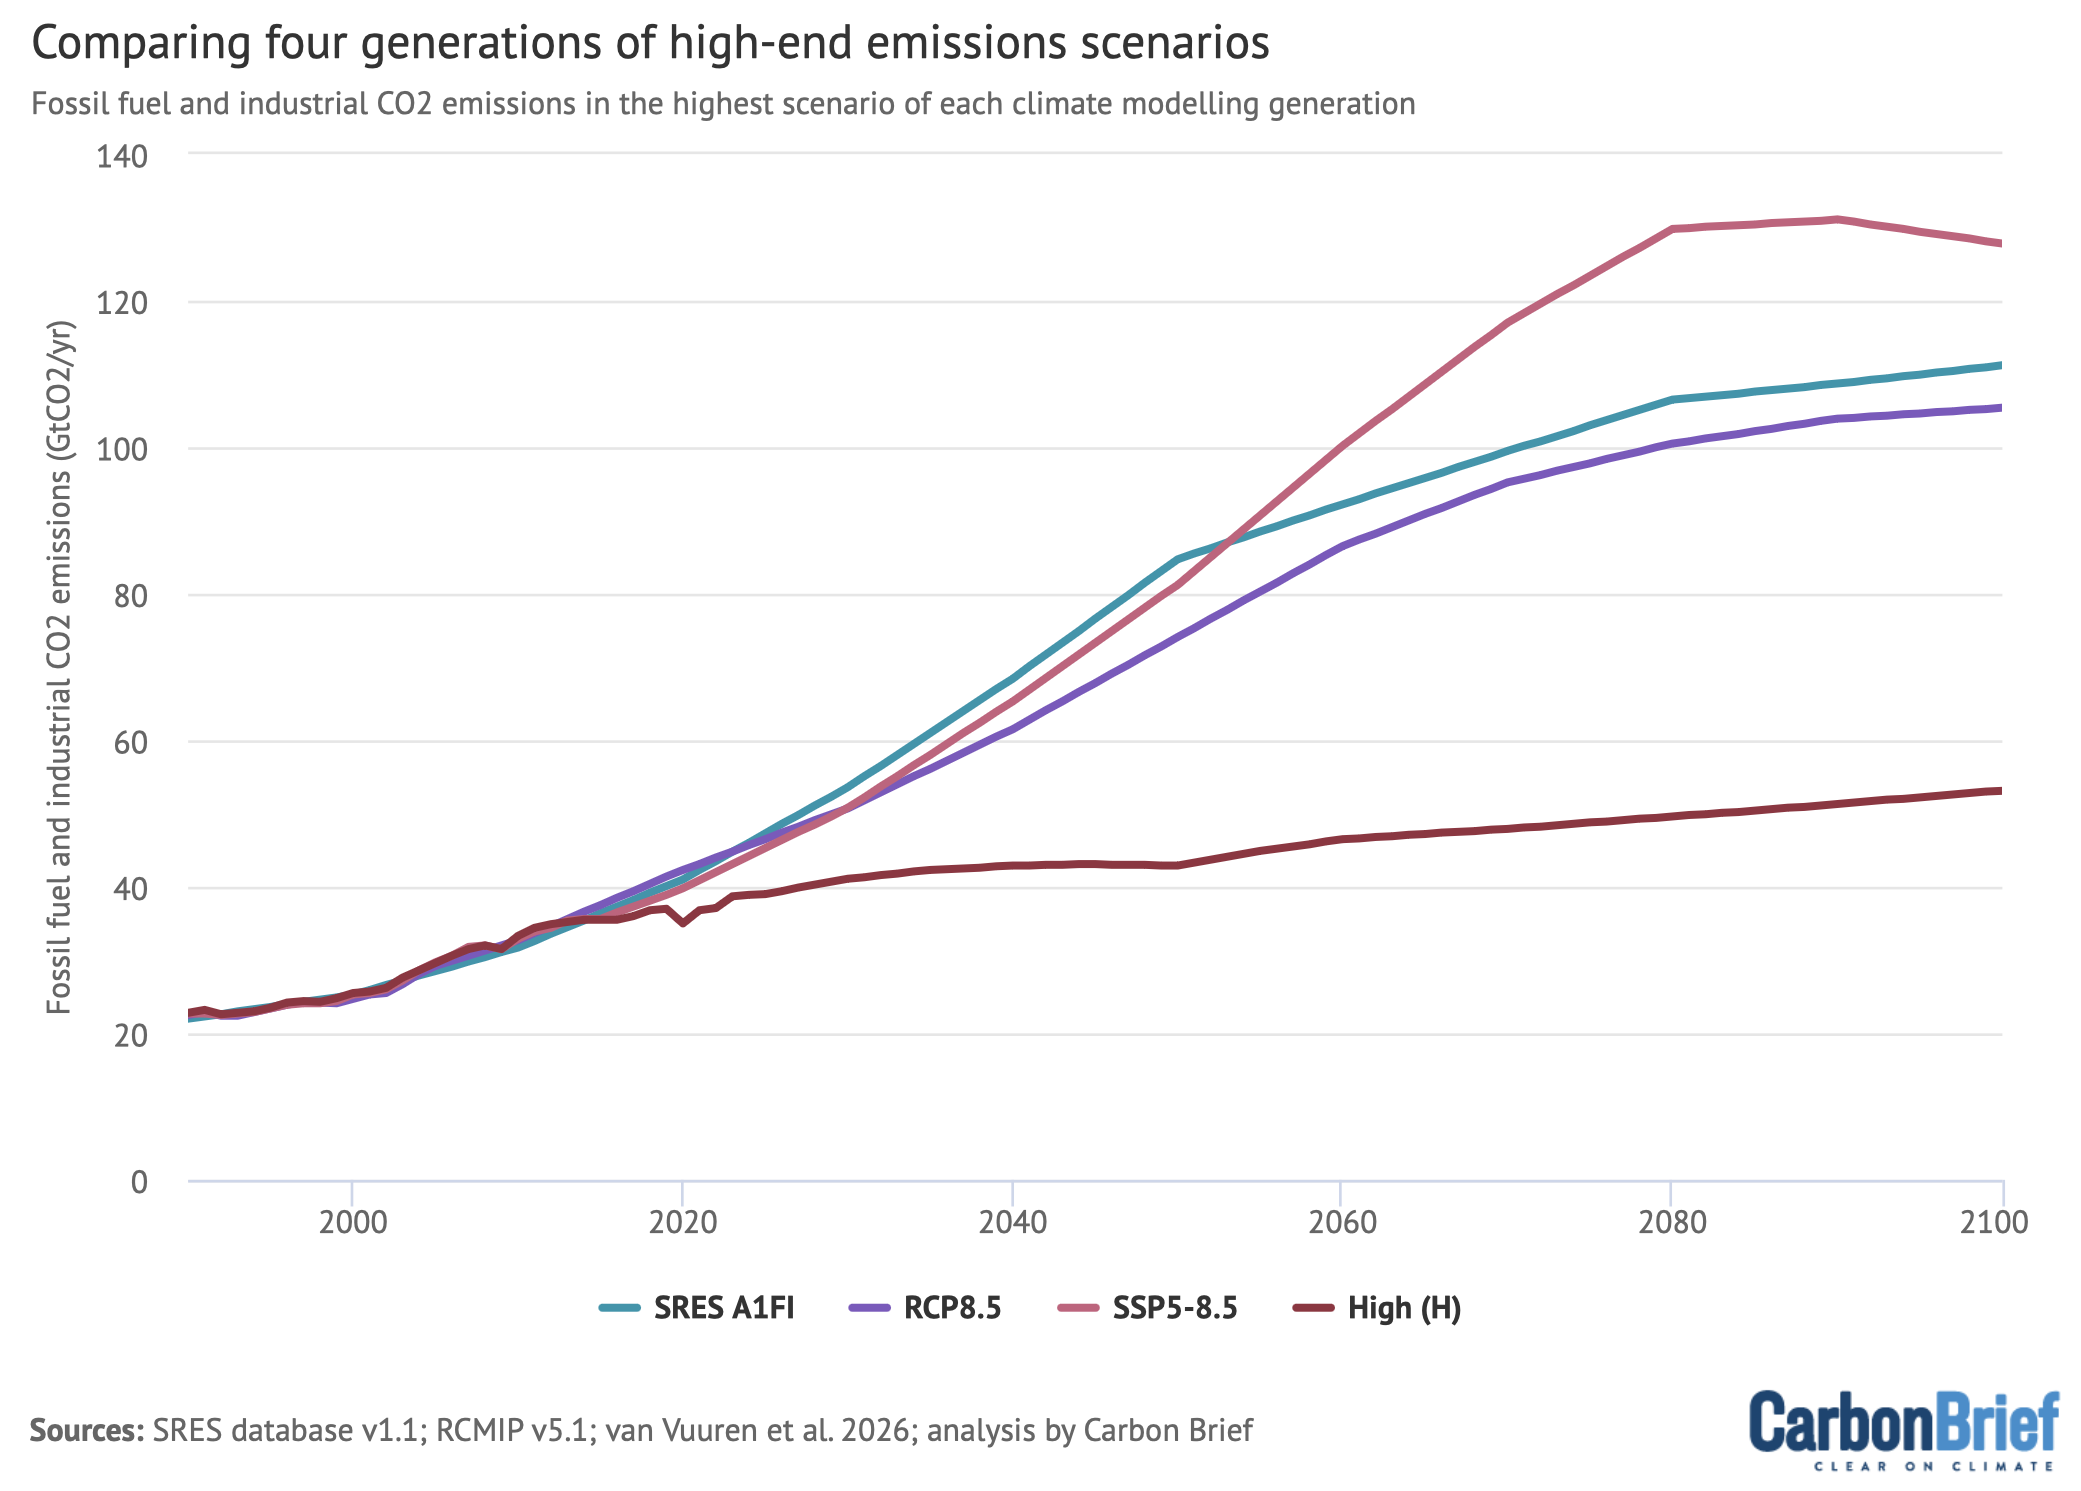
Developed under the seventh phase of the Coupled Model Intercomparison Project (CMIP7) and coordinated by the Scenario Model Intercomparison Project (ScenarioMIP), the new scenarios replace the aging Shared Socioeconomic Pathways (SSPs) finalized in the mid-2010s. The updated suite of seven pathways dismantles several longstanding conventions of climate projection. Most notably, modellers have officially retired theoretical "no-climate-policy" doomsday baselines—such as the extreme RCP8.5 and SSP5-8.5 scenarios—which assumed an unrelenting, 21st-century expansion of unmitigated coal combustion.
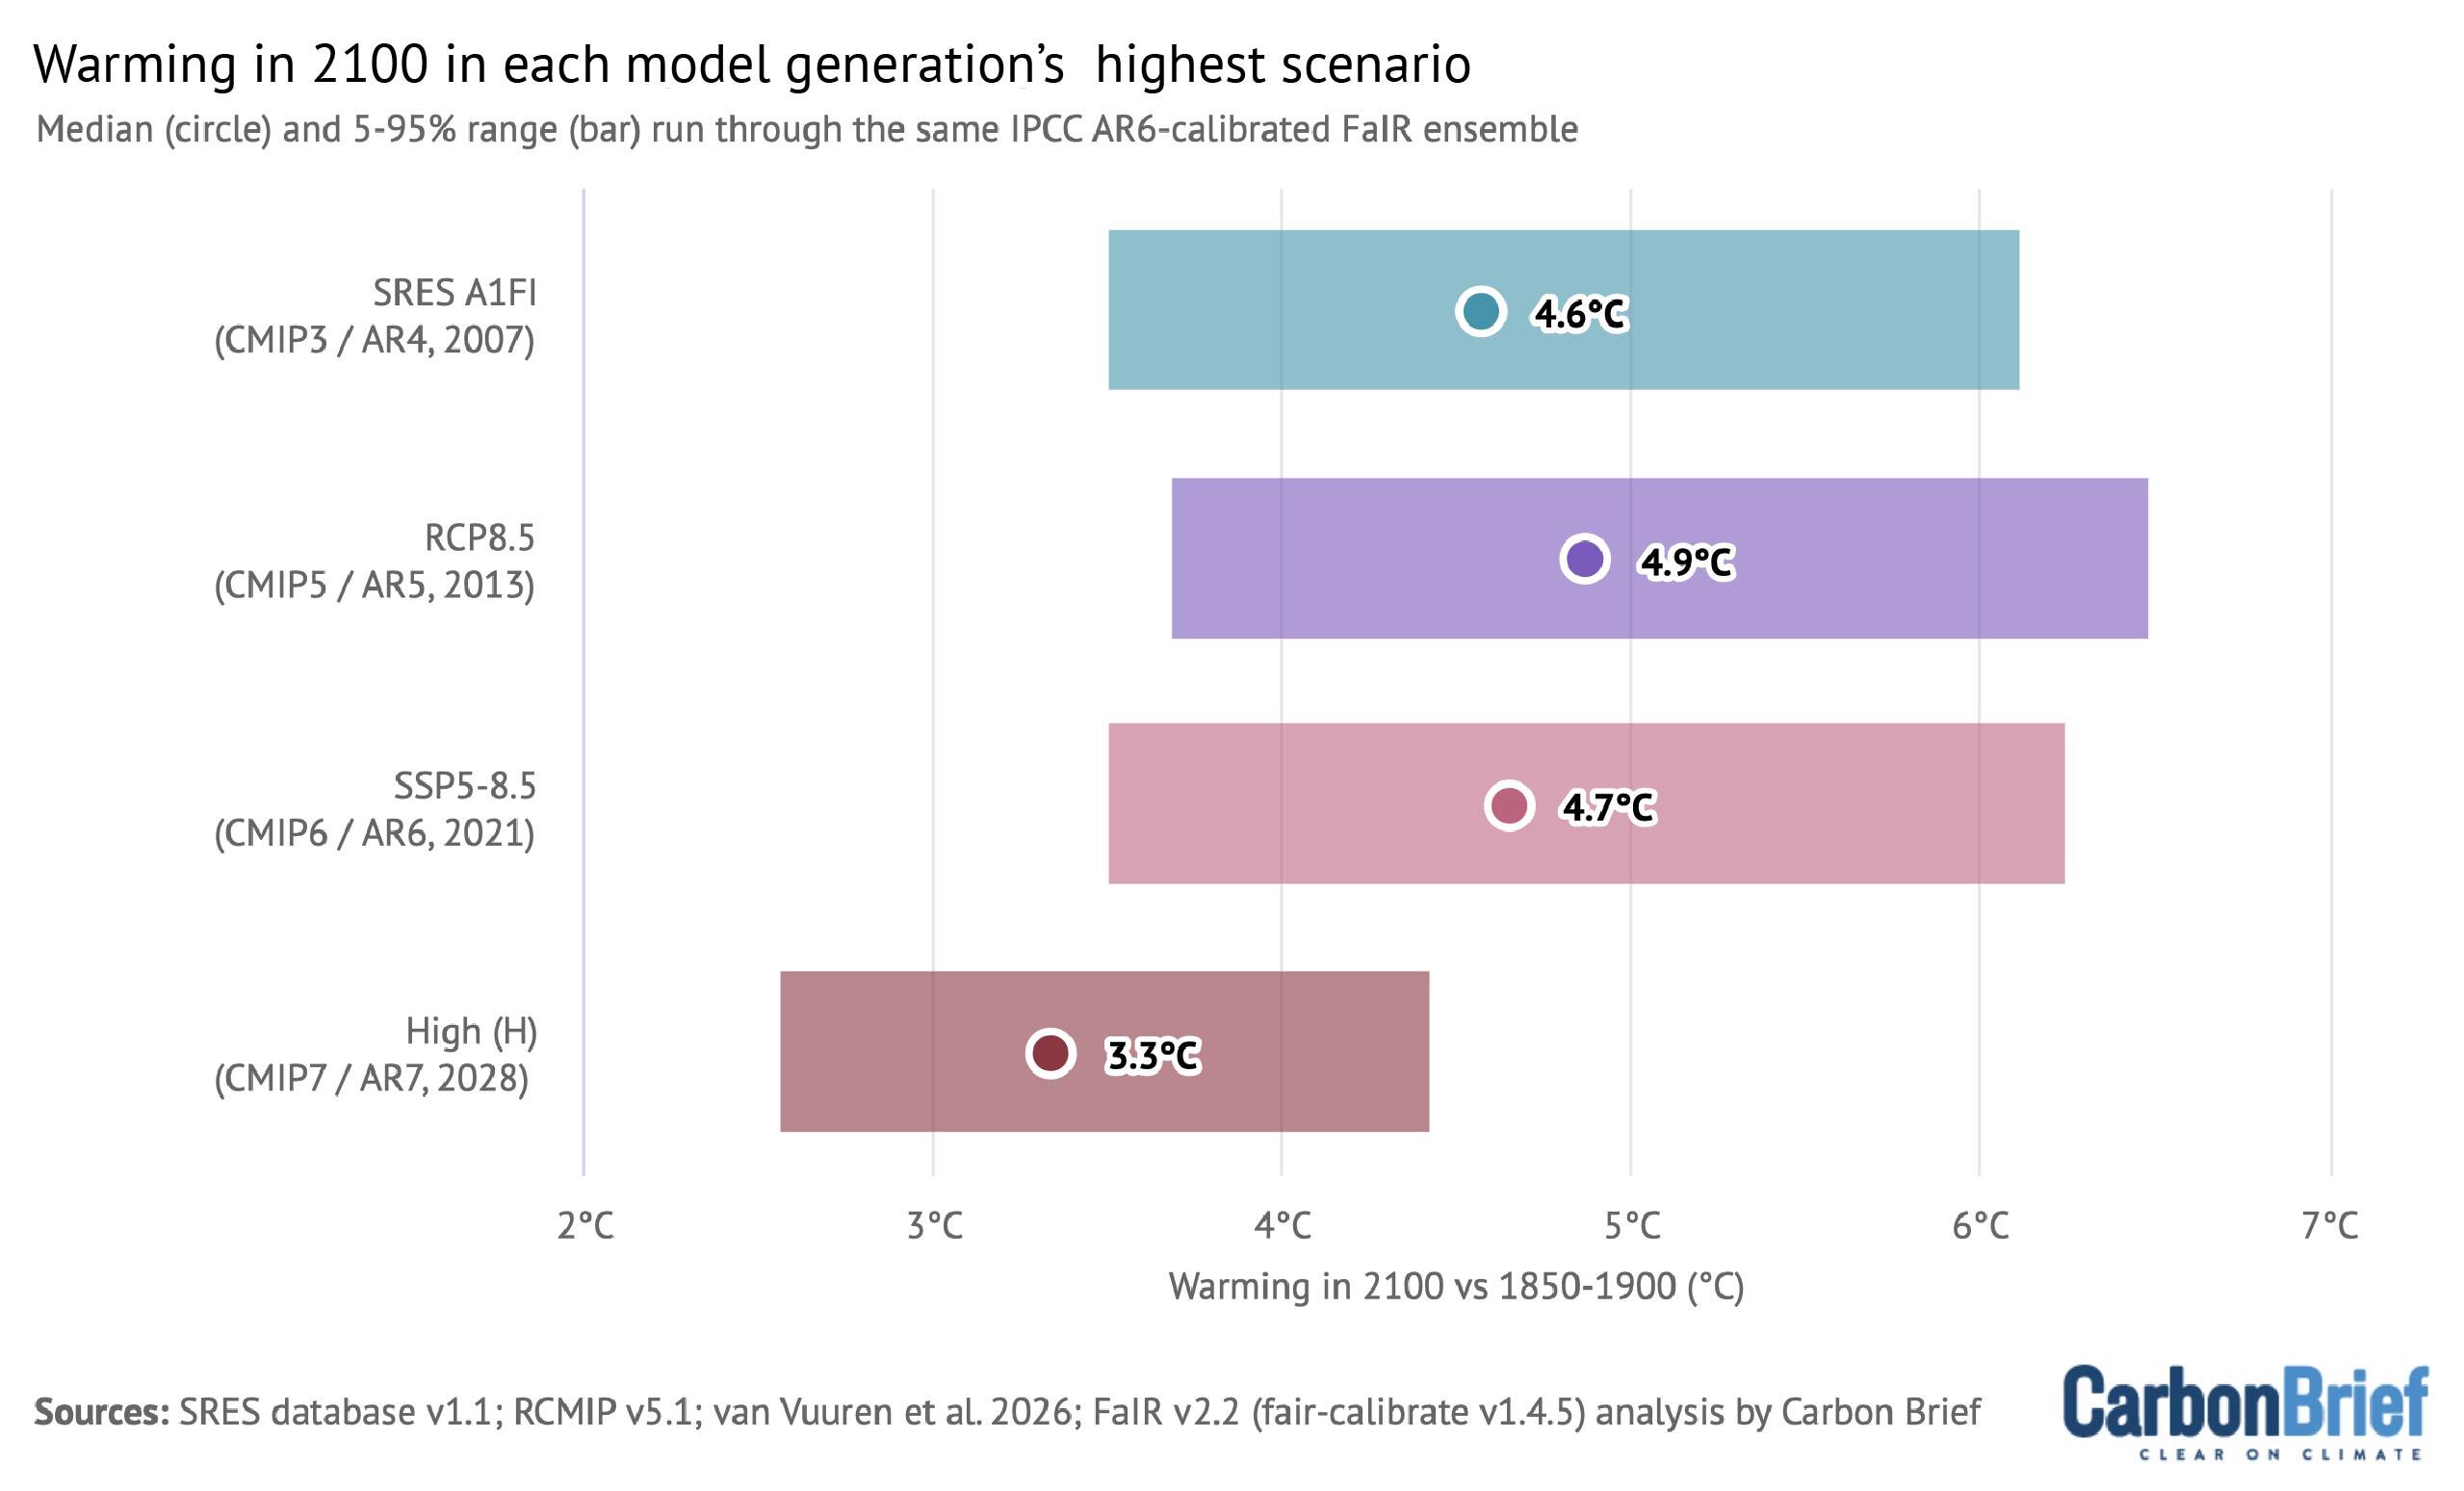
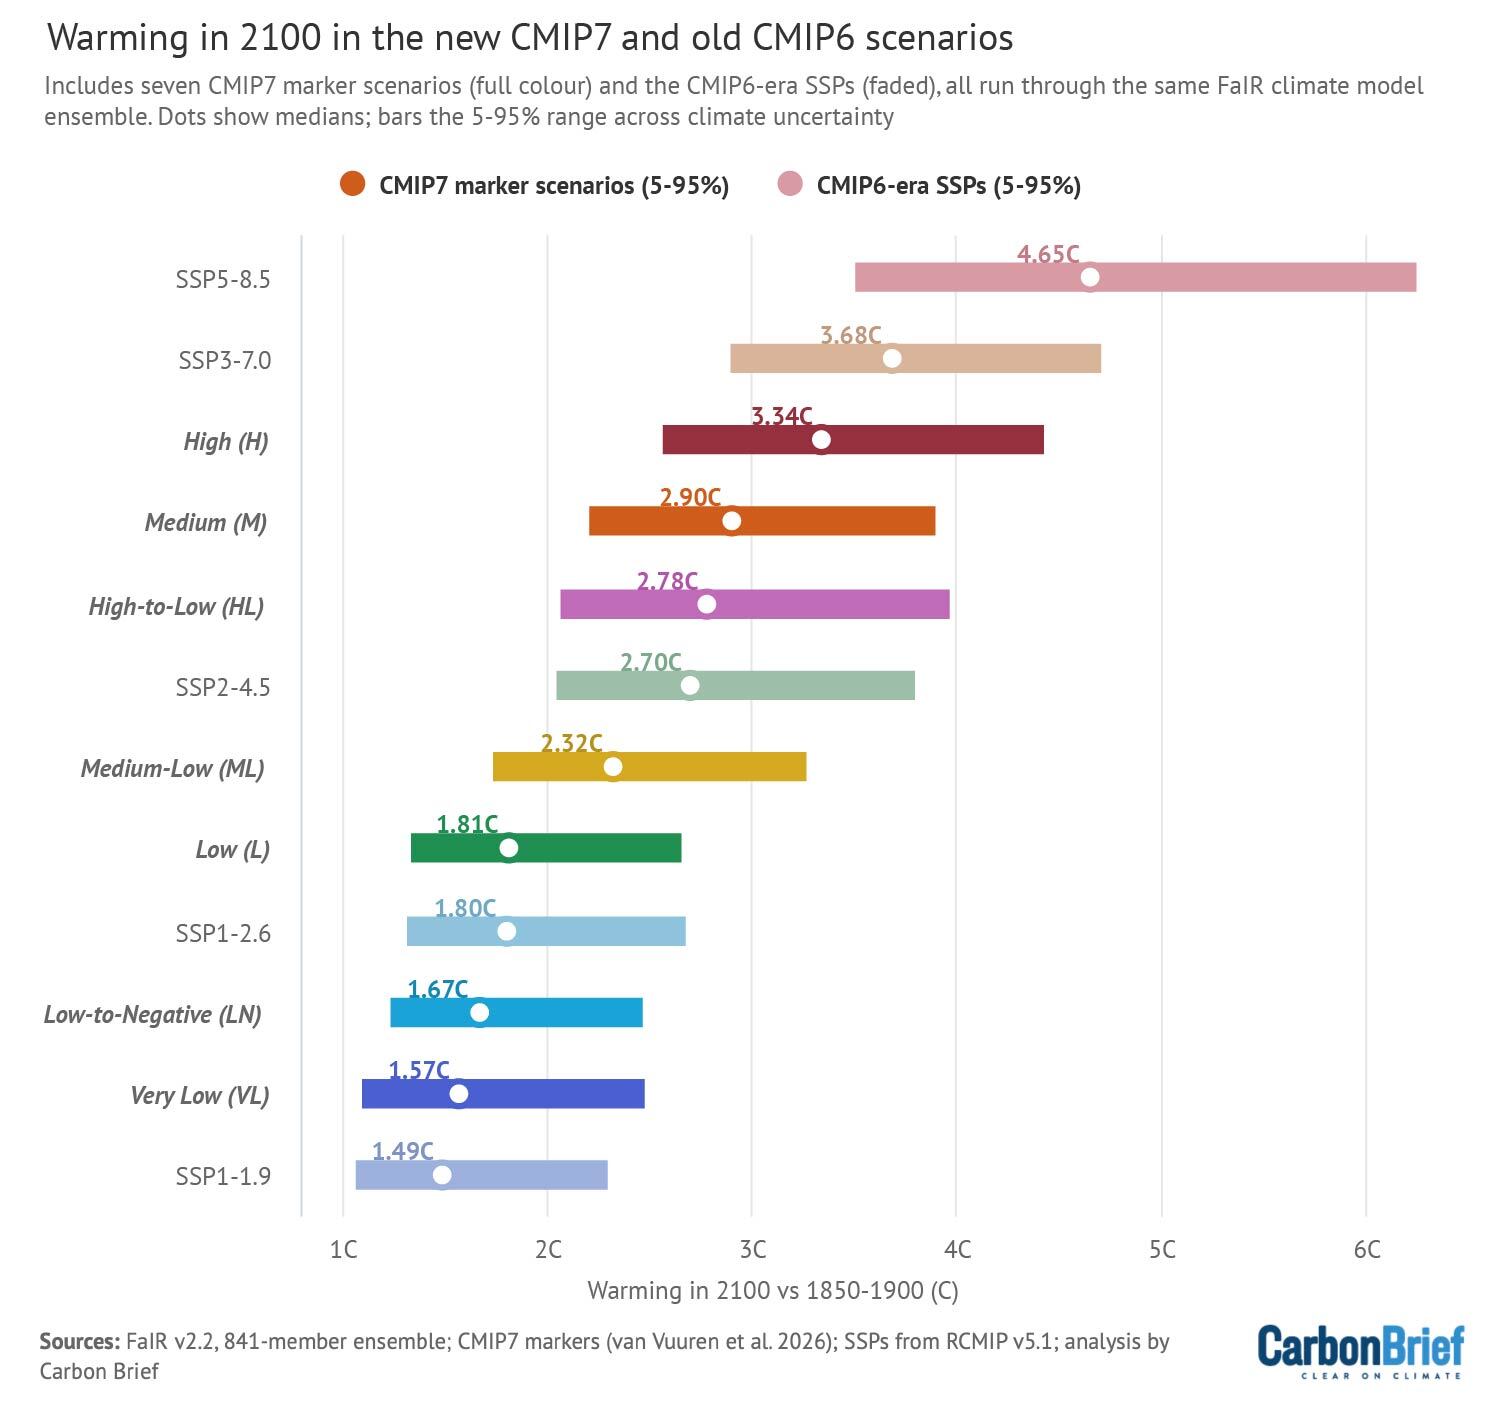
Instead, the CMIP7 framework grounds its high-end emissions scenario in a world where current climate policies are rolled back, projecting a peak end-of-century warming median of 3.3°C above pre-industrial levels—far below the ~4.5°C to 5.0°C worst-case outcomes featured in previous IPCC cycles. Simultaneously, the framework revises low-emissions pathways to account for delayed global action over the past decade, formally acknowledging that a temporary "overshoot" of the Paris Agreement’s 1.5°C target is now virtually unavoidable.
Beyond policy assumptions, CMIP7 introduces crucial technical advances: simulations will now be "emissions-driven" rather than "concentration-driven," forcing Earth-system models to calculate interactive carbon-cycle feedbacks directly. Furthermore, projection horizons have been formally extended from 2100 to 2150 and beyond, offering crucial insight into long-term environmental commitments like ice-sheet degradation and sea-level rise.
Detailed Chronology: The Evolution of Climate Modeling Frameworks
The release of the CMIP7 pathways represents the culmination of a multi-year effort to synchronize climate modeling with real-world energy transitions and updated socioeconomic data.
+------------------+     +------------------+     +------------------+     +------------------+
|    2013-2017     |     |       2024       |     |    April 2026    |     |  September 2026  |
|  CMIP6 Framework | --> | Socioeconomic    | --> | GMD Methodology  | --> | Public Data      |
|  SSPs Finalized  |     |  Data Updated    |     | Paper Published  |     |  Release         |
+------------------+     +------------------+     +------------------+     +------------------+
                                                                                 |
                                                                                 v
                                                                        +------------------+
                                                                        |    2026-2028     |
                                                                        |  CMIP7 Modeling  |
                                                                        |  & IPCC AR7 Runs |
                                                                        +------------------+
The Legacy Era (2013–2021)
The prior generation of climate models (CMIP6), which heavily informed the IPCC Sixth Assessment Report (AR6), relied on scenarios formulated between 2013 and 2017 using historical data that ended in 2015. These Shared Socioeconomic Pathways paired narrative storylines (SSP1 through SSP5) with arbitrary end-of-century radiative forcing targets (e.g., 8.5, 7.0, 4.5, 2.6, and 1.9 Watts per square meter).
By the time AR6 concluded in 2023, several years of projected data in the SSP pathways were already in the past. Real-world trends had diverged sharply from the underlying assumptions: clean energy costs dropped precipitously, renewable adoption surged, and global coal expansion slowed. Despite these shifts, climate science remained tied to outdated baseline models, leading to frequent misinterpretations of high-end risk among policymakers and the general public.
The Realignment Phase (2024–2026)
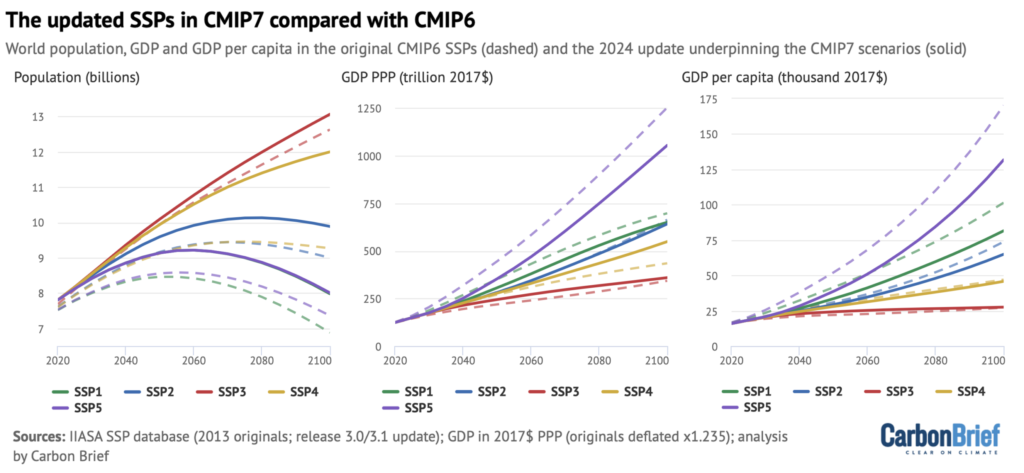
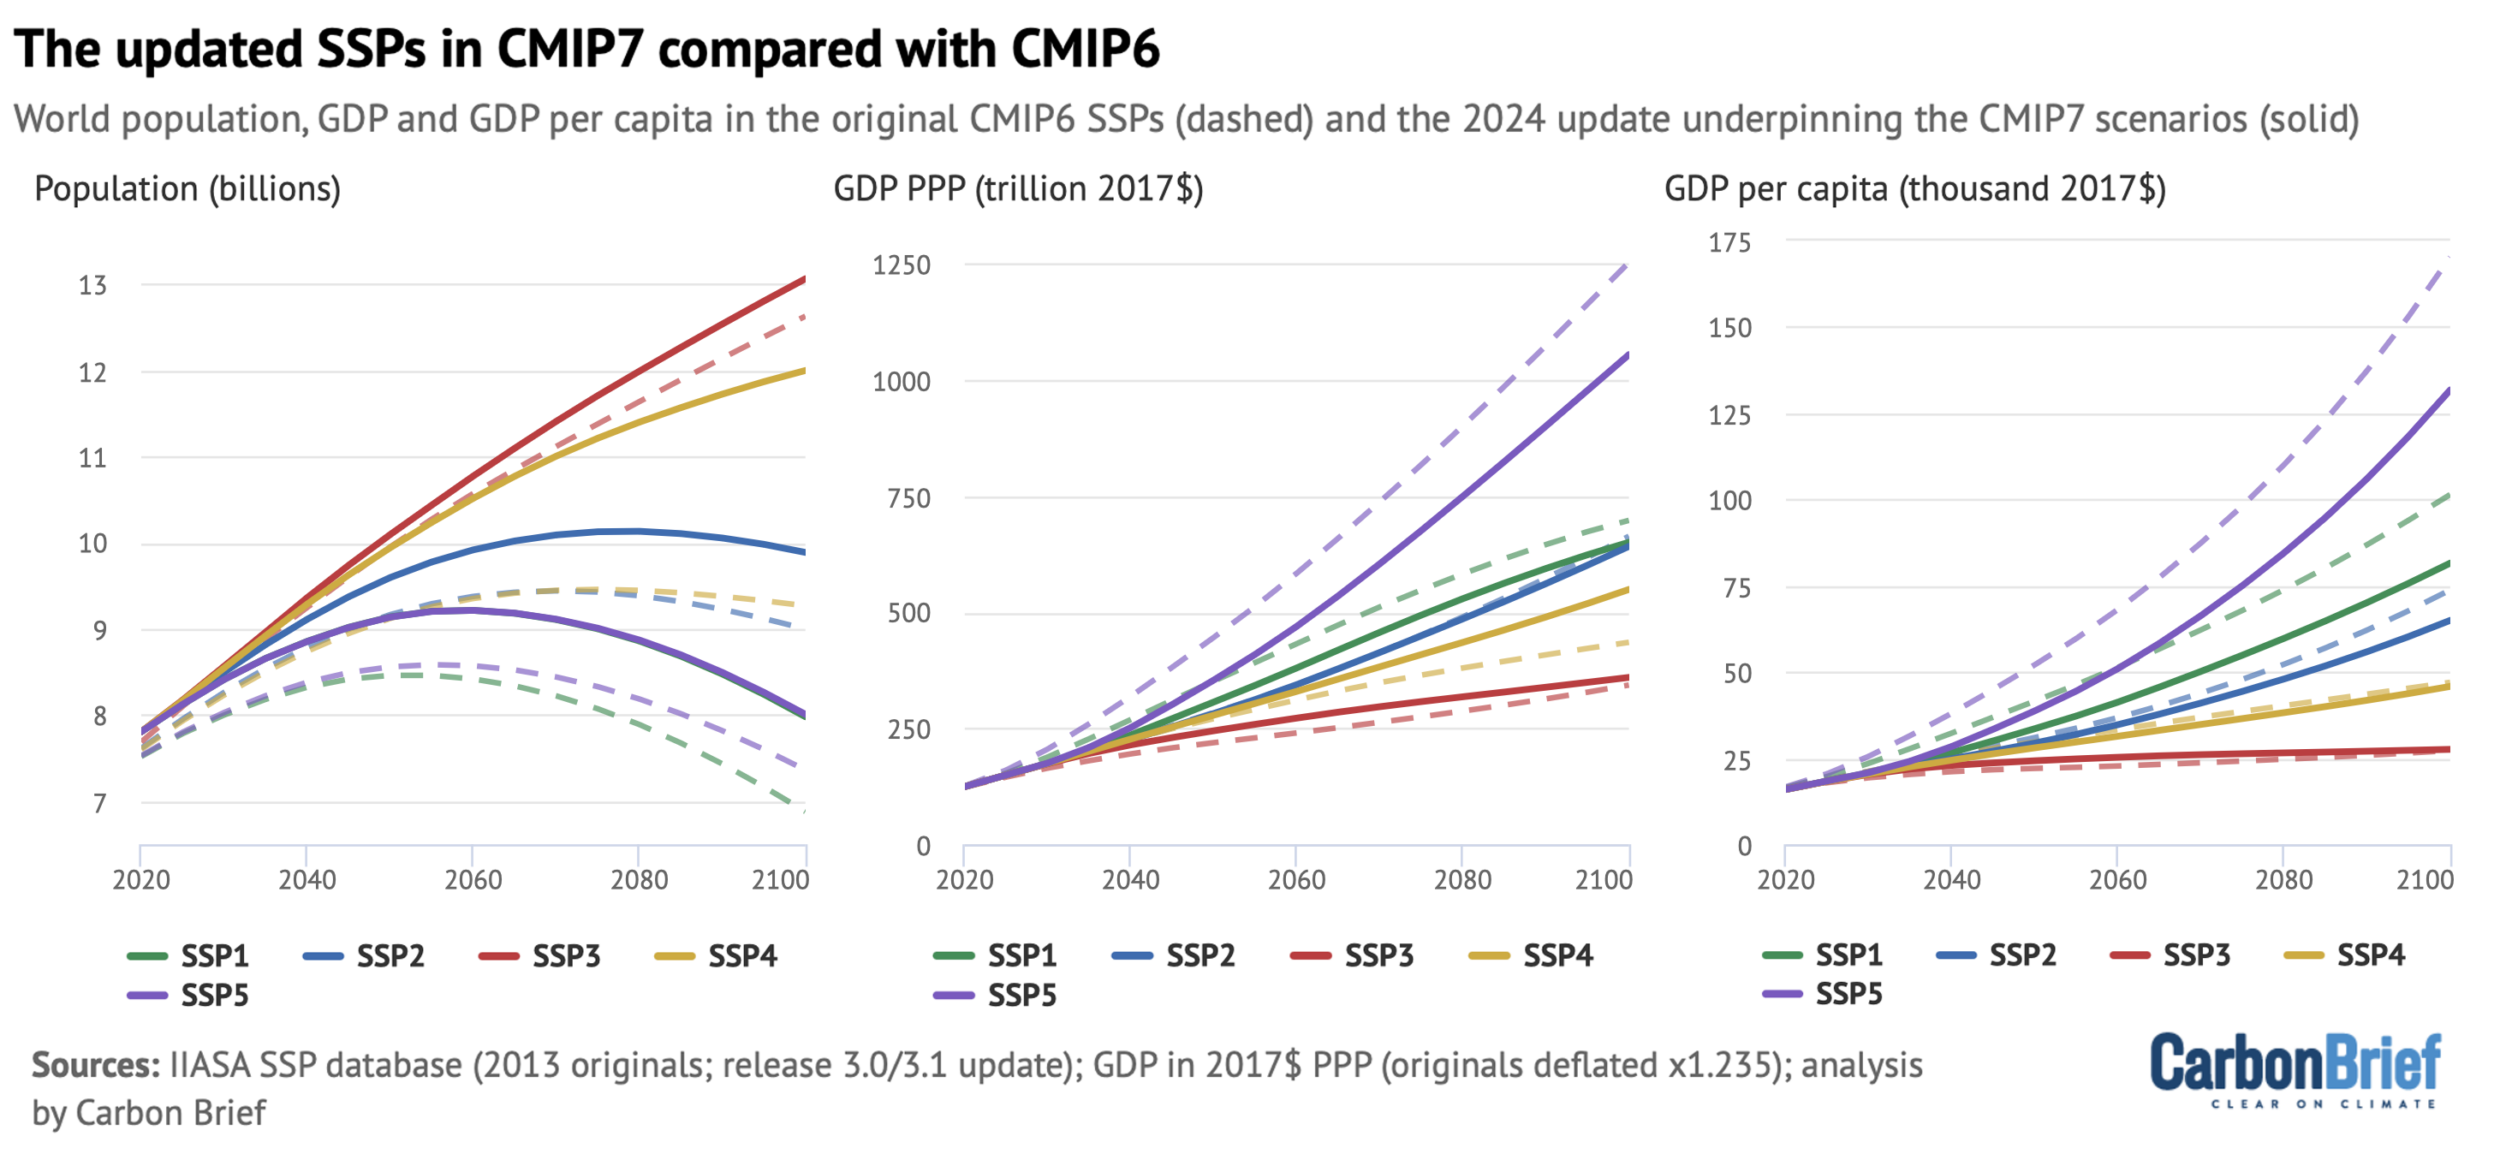
To address this gap, ScenarioMIP updated its core socioeconomic drivers in 2024. Updated projections revealed a world that is demographic and economic structurally distinct from 2013 forecasts:
Demographics: Global population was revised upward across nearly all scenarios. Under the "Middle of the Road" narrative (SSP2), population is now projected to reach 9.9 billion by 2100—an increase of 1 billion people compared to 2013 projections.
Economics: End-of-century GDP figures were adjusted downward for rapid-growth scenarios (SSP1 and SSP5). Consequently, global income per capita across most updated storylines is 10% to 25% lower than originally assumed.
Formal Release of CMIP7 (April–September 2026)
In April 2026, high-level methodological specifications were published in Geoscientific Model Development (GMD) by an international team led by Prof. Detlef van Vuuren. On September 1, 2026, the complete emissions datasets were released into the public domain. Earth-system modeling teams worldwide have begun deploying these inputs, with initial CMIP7 climate model outputs anticipated by late 2026 to support the IPCC AR7 assessment cycle.
Supporting Context & Metrics: Structural Analysis of the Seven Pathways
The CMIP7 framework abandons cryptic numeric codes in favor of direct descriptions of emissions trajectories. Six of the seven pathways are built on integrated assessment model (IAM) marker runs mapping across updated socioeconomic storylines.
Scenario
Marker IAM
Underlying SSP
Narrative Summary
Net CO₂ in 2100 (GtCO₂/yr)
Cumulative Net CO₂ 2024–2100 (GtCO₂)
Median Warming in 2100 (5–95% Range)
High (H)
GCAM 8s
SSP3 (Regional Rivalry)
Mitigation policy rollback; resurgence of high fossil intensity
+55
3,820
3.3°C (2.6–4.4°C)
High-to-Low (HL)
WITCH 6.0
SSP5 (Fossil Development)
High emissions to mid-century, followed by rapid post-2050 decarbonization
-1
2,566
2.8°C (2.1–4.0°C)
Medium (M)
IMAGE 3.4
SSP2 (Middle of the Road)
Current 2025 policies frozen; no implementation of unlegislated pledges
+34
2,814
2.9°C (2.2–3.9°C)
Medium-Low (ML)
COFFEE 1.6
SSP2 (Middle of the Road)
Moderate emissions through 2040, then steep decline to net-zero by 2100
-9
1,757
2.3°C (1.7–3.3°C)
Low (L)
MESSAGEix-GLOBIOM 2.1
SSP2 (Middle of the Road)
Rapid policy strengthening aiming to keep warming likely below 2°C
-9
673
1.8°C (1.3–2.7°C)
Very-Low (VL)
REMIND-MAgPIE 3.5-4.11
SSP1 (Sustainability)
Immediate, aggressive mitigation targeting 1.5°C with minimal overshoot
-6
310
1.6°C (1.1–2.5°C)
Low-to-Negative (LN)
AIM 3.0
SSP2 (Middle of the Road)
Delayed deep cuts leading to 1.5°C overshoot, followed by massive net-negative CDR
-25
384
1.7°C (1.2–2.5°C)
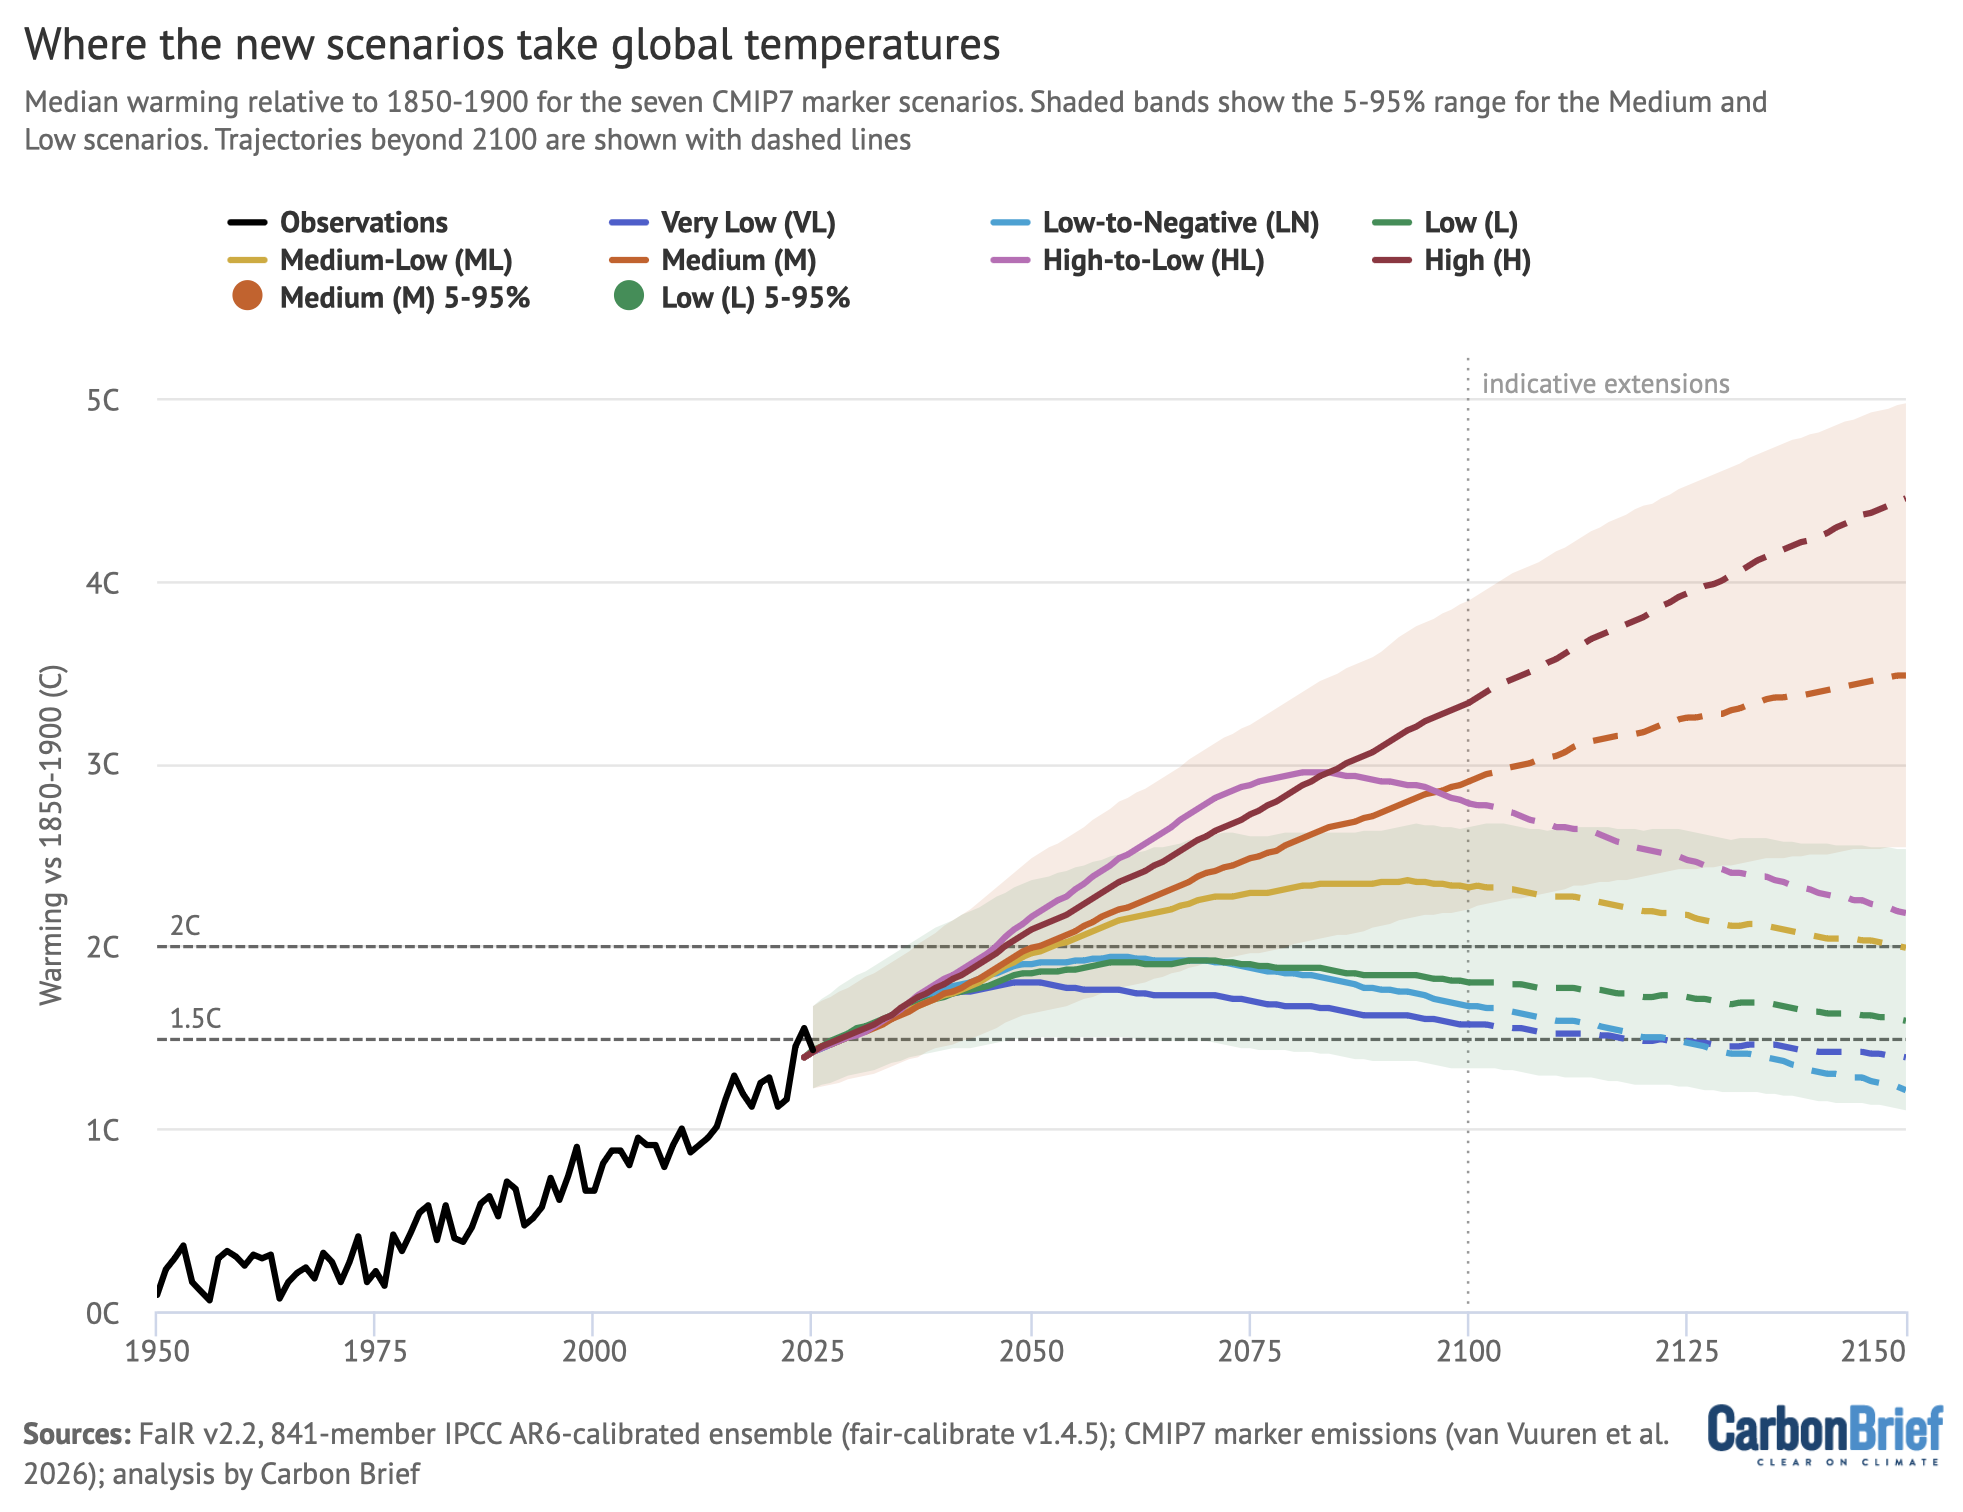
Note: Warming estimates are derived from an 841-member FaIR simple climate model ensemble calibrated to IPCC AR6 standards.
The Collapse of the High-End Baseline
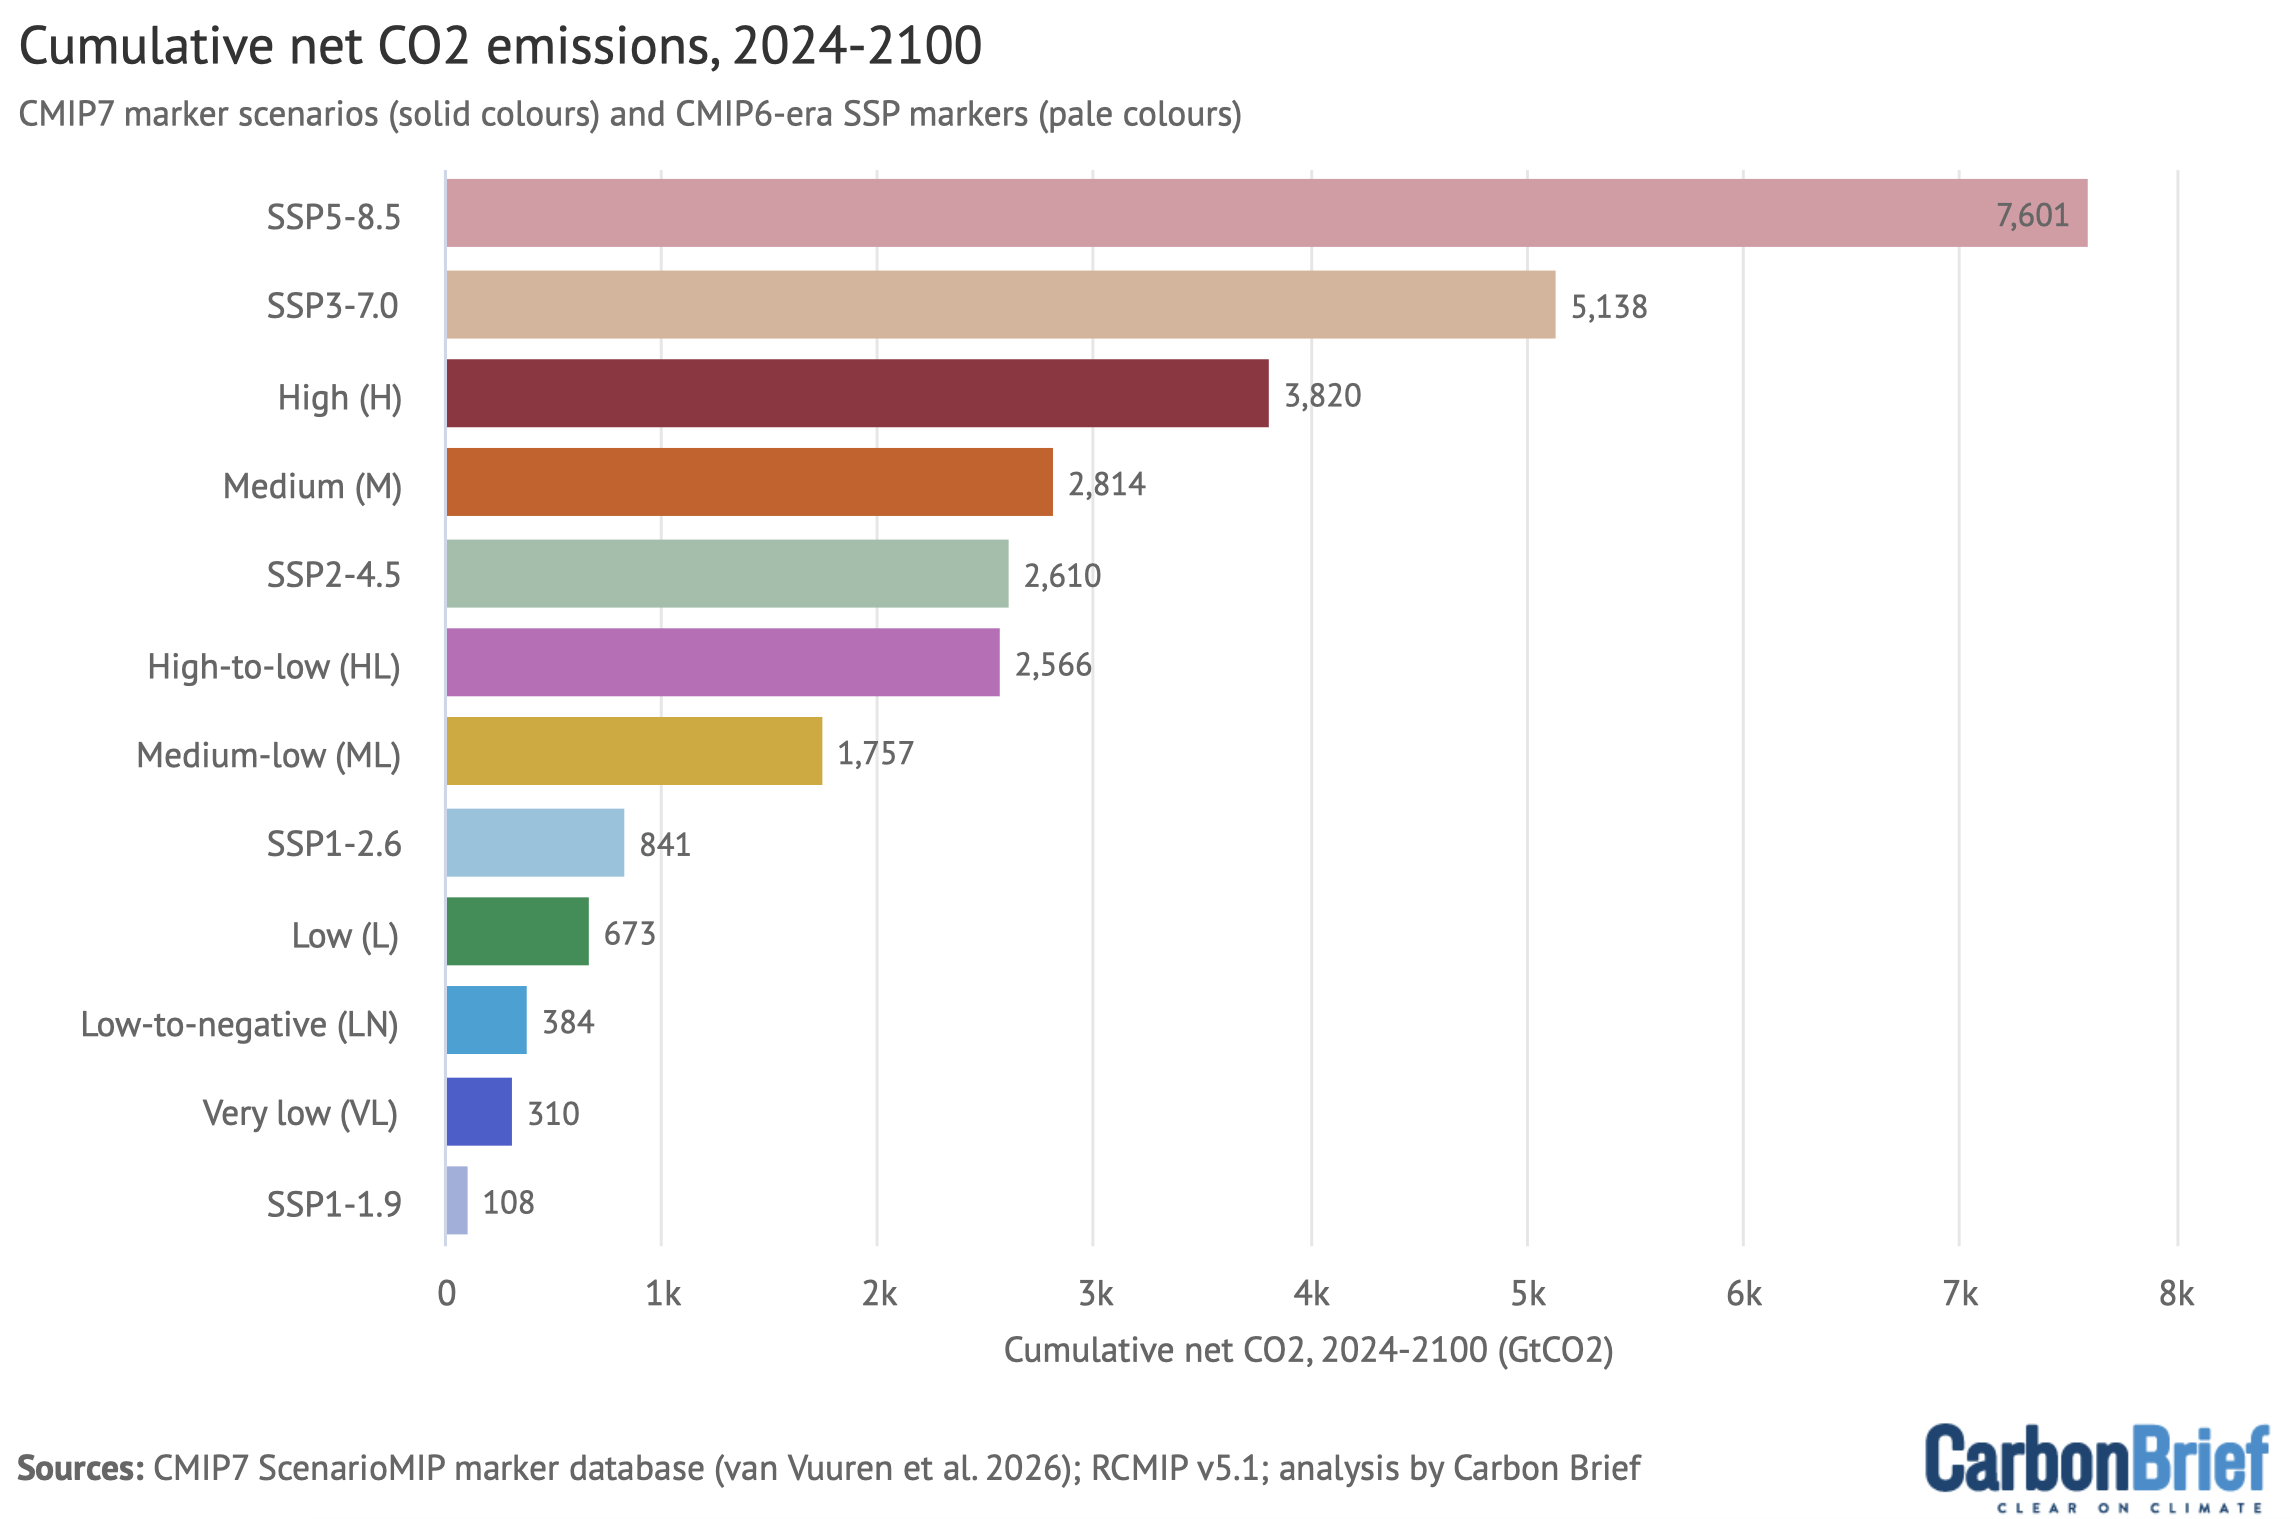
The shift from CMIP6’s SSP5-8.5 to CMIP7’s "High" scenario represents a decisive recalibration. Under SSP5-8.5, annual CO₂ emissions soared to 126 GtCO₂/year by 2100, accumulating ~7,600 GtCO₂ between 2024 and 2100. The CMIP7 High scenario caps end-of-century annual emissions at 55 GtCO₂/year and cumulative emissions at 3,820 GtCO₂—a 50% reduction in cumulative carbon burden relative to SSP5-8.5.
       CUMULATIVE NET CO2 EMISSIONS (2024–2100) IN GIGATONNES

  CMIP6 SSP5-8.5  |==================================================| 7,600 Gt
  CMIP6 SSP3-7.0  |===================================| 5,140 Gt
  CMIP7 High      |========================| 3.820 Gt
  CMIP7 Medium    |==================| 2,814 Gt
  CMIP7 Low       |====| 673 Gt
  CMIP7 Very-Low  |==| 310 Gt
                  +------------+------------+------------+-----------+
                  0 Gt         2,000 Gt     4,000 Gt     6,000 Gt    8,000 Gt
This structural shift reflects two primary factors:
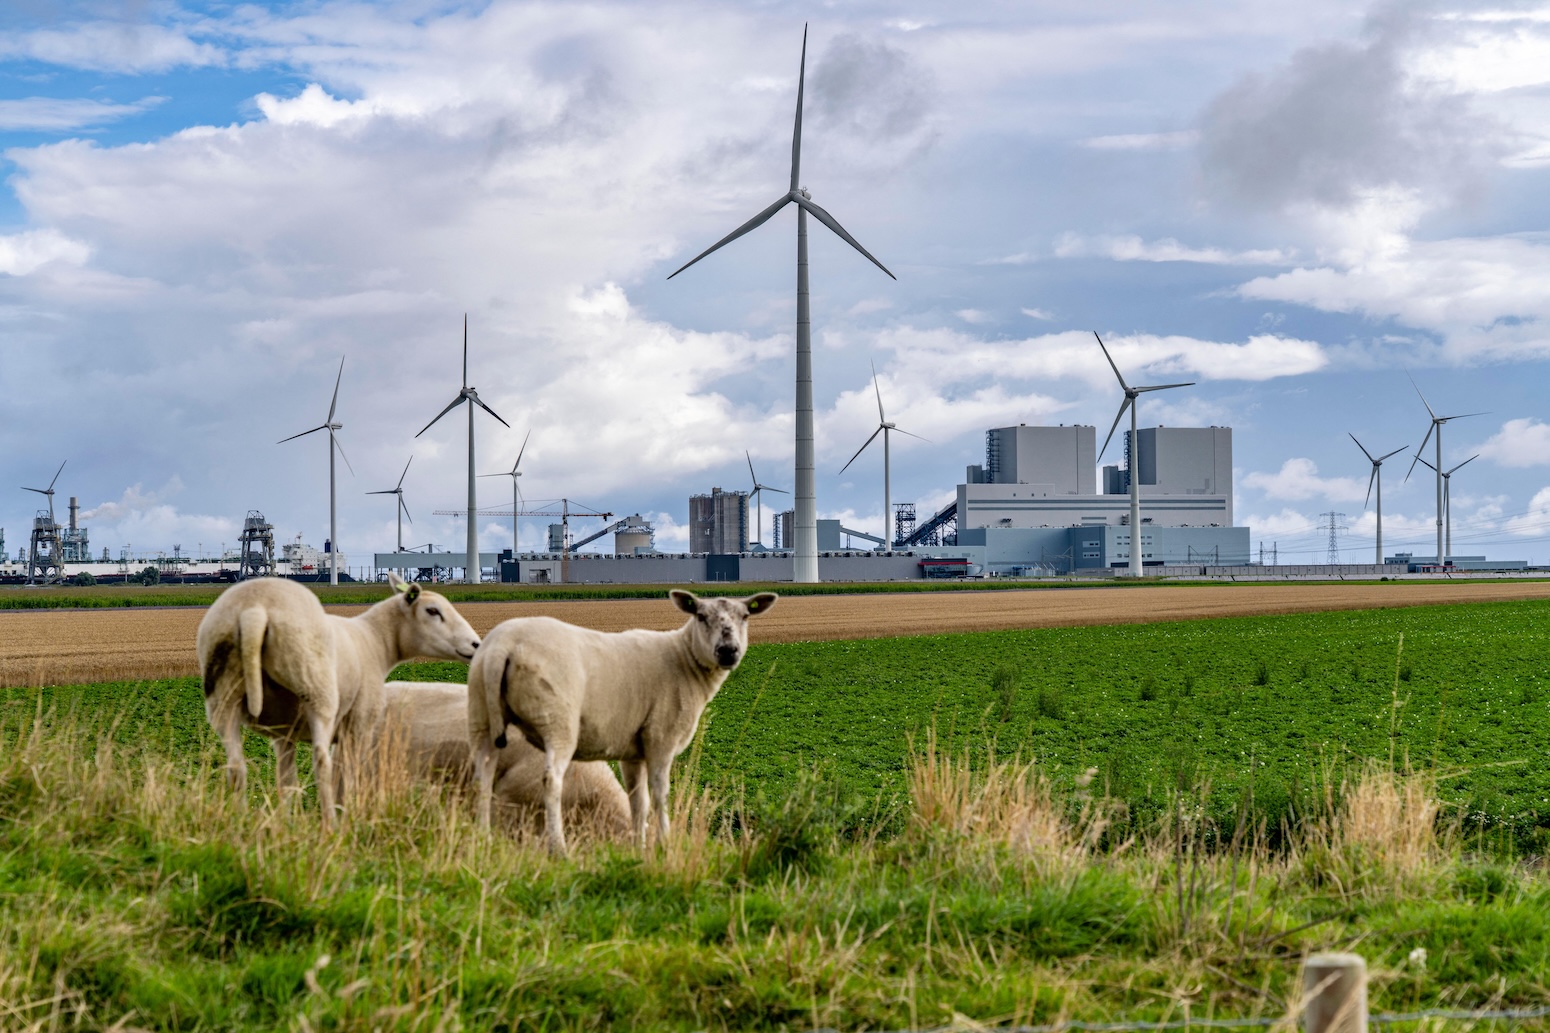
Technological Realities: Over $2 trillion per year is currently invested in clean energy globally. The rapid fall in the cost of solar, wind, and battery technologies, alongside a global plateau in coal demand, makes 19th-century-style coal expansion structurally and economically unfeasible.
Methodological Correction: Previous high-end scenarios reflected extreme worst-case upper bounds rather than probable baselines. Real-world decarbonization progress accounts for approximately 0.7°C of the difference between SSP5-8.5 and current trajectories, while the remaining ~0.9°C to 1.0°C difference stems from correcting unrealistically high baseline assumptions.
Technical Innovations in CMIP7
The CMIP7 framework introduces three critical modeling enhancements designed to improve policy relevance:
Emissions-Driven Carbon Cycles: Previous model generations prescribed fixed atmospheric CO₂ concentrations. CMIP7 requires Earth-system models to run in "emissions-driven" mode. Models will calculate atmospheric CO₂ concentrations internally based on greenhouse gas input vectors, allowing carbon-cycle feedbacks—such as reduced ocean uptake or thawing permafrost—to directly influence temperature output distributions.
Observation Harmonization: Scenarios are anchored to real-world emissions data through 2023, with constrained projections through 2025. Pathways diverge only after 2026, eliminating historical divergence errors.
Extended Horizons (2150 & 2500): Standard runs now extend to 2150, providing projections tailored to the life expectancy of children born today. Long-term extension protocols run through the year 2500 to evaluate irreversible Earth-system commitments, such as thermal ocean expansion and ice-sheet loss.
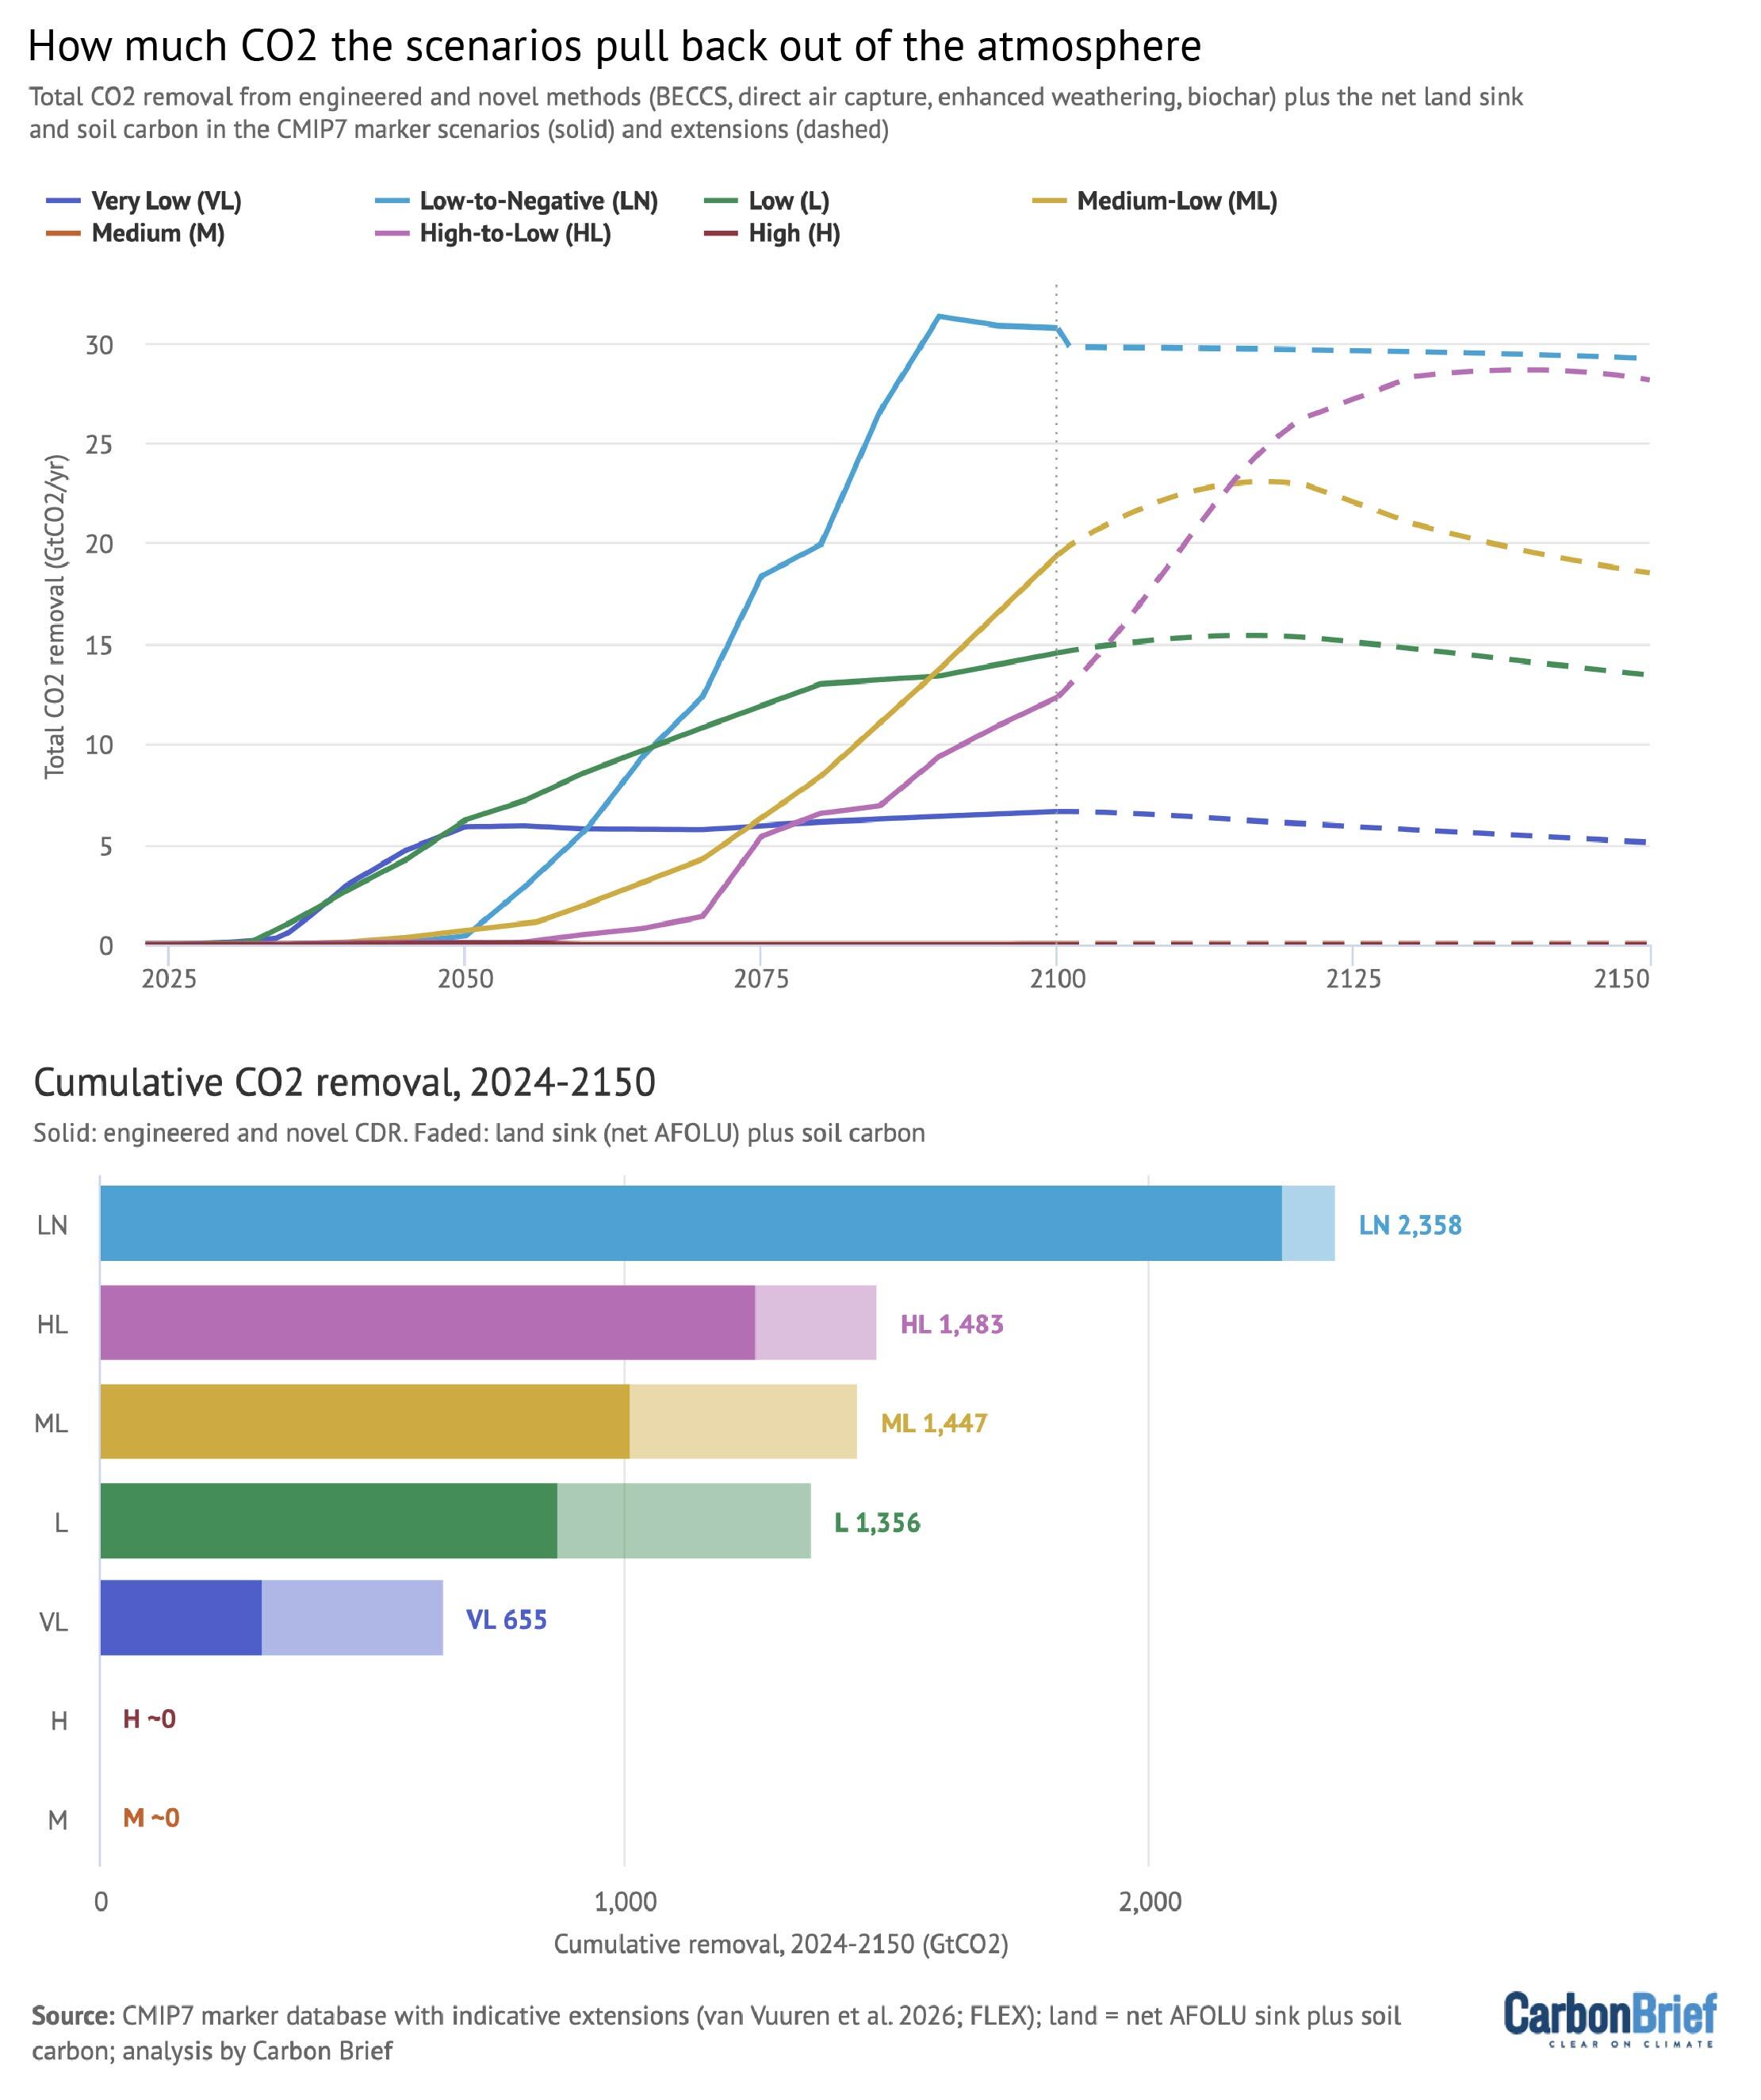
A central finding of the CMIP7 framework is its heavy reliance on Carbon Dioxide Removal (CDR) to achieve temperature stabilization or reversal across almost all pathways.
The scale of negative emissions built into these pathways presents immense technological and logistical challenges:
The Low-to-Negative Pathway: Requires pulling a cumulative 2,360 GtCO₂ out of the atmosphere by 2150—roughly equivalent to 60 years of current global carbon emissions operating in reverse. Direct Air Capture (DAC) alone reaches an extraction rate of 16 GtCO₂/year by 2100 in this scenario.
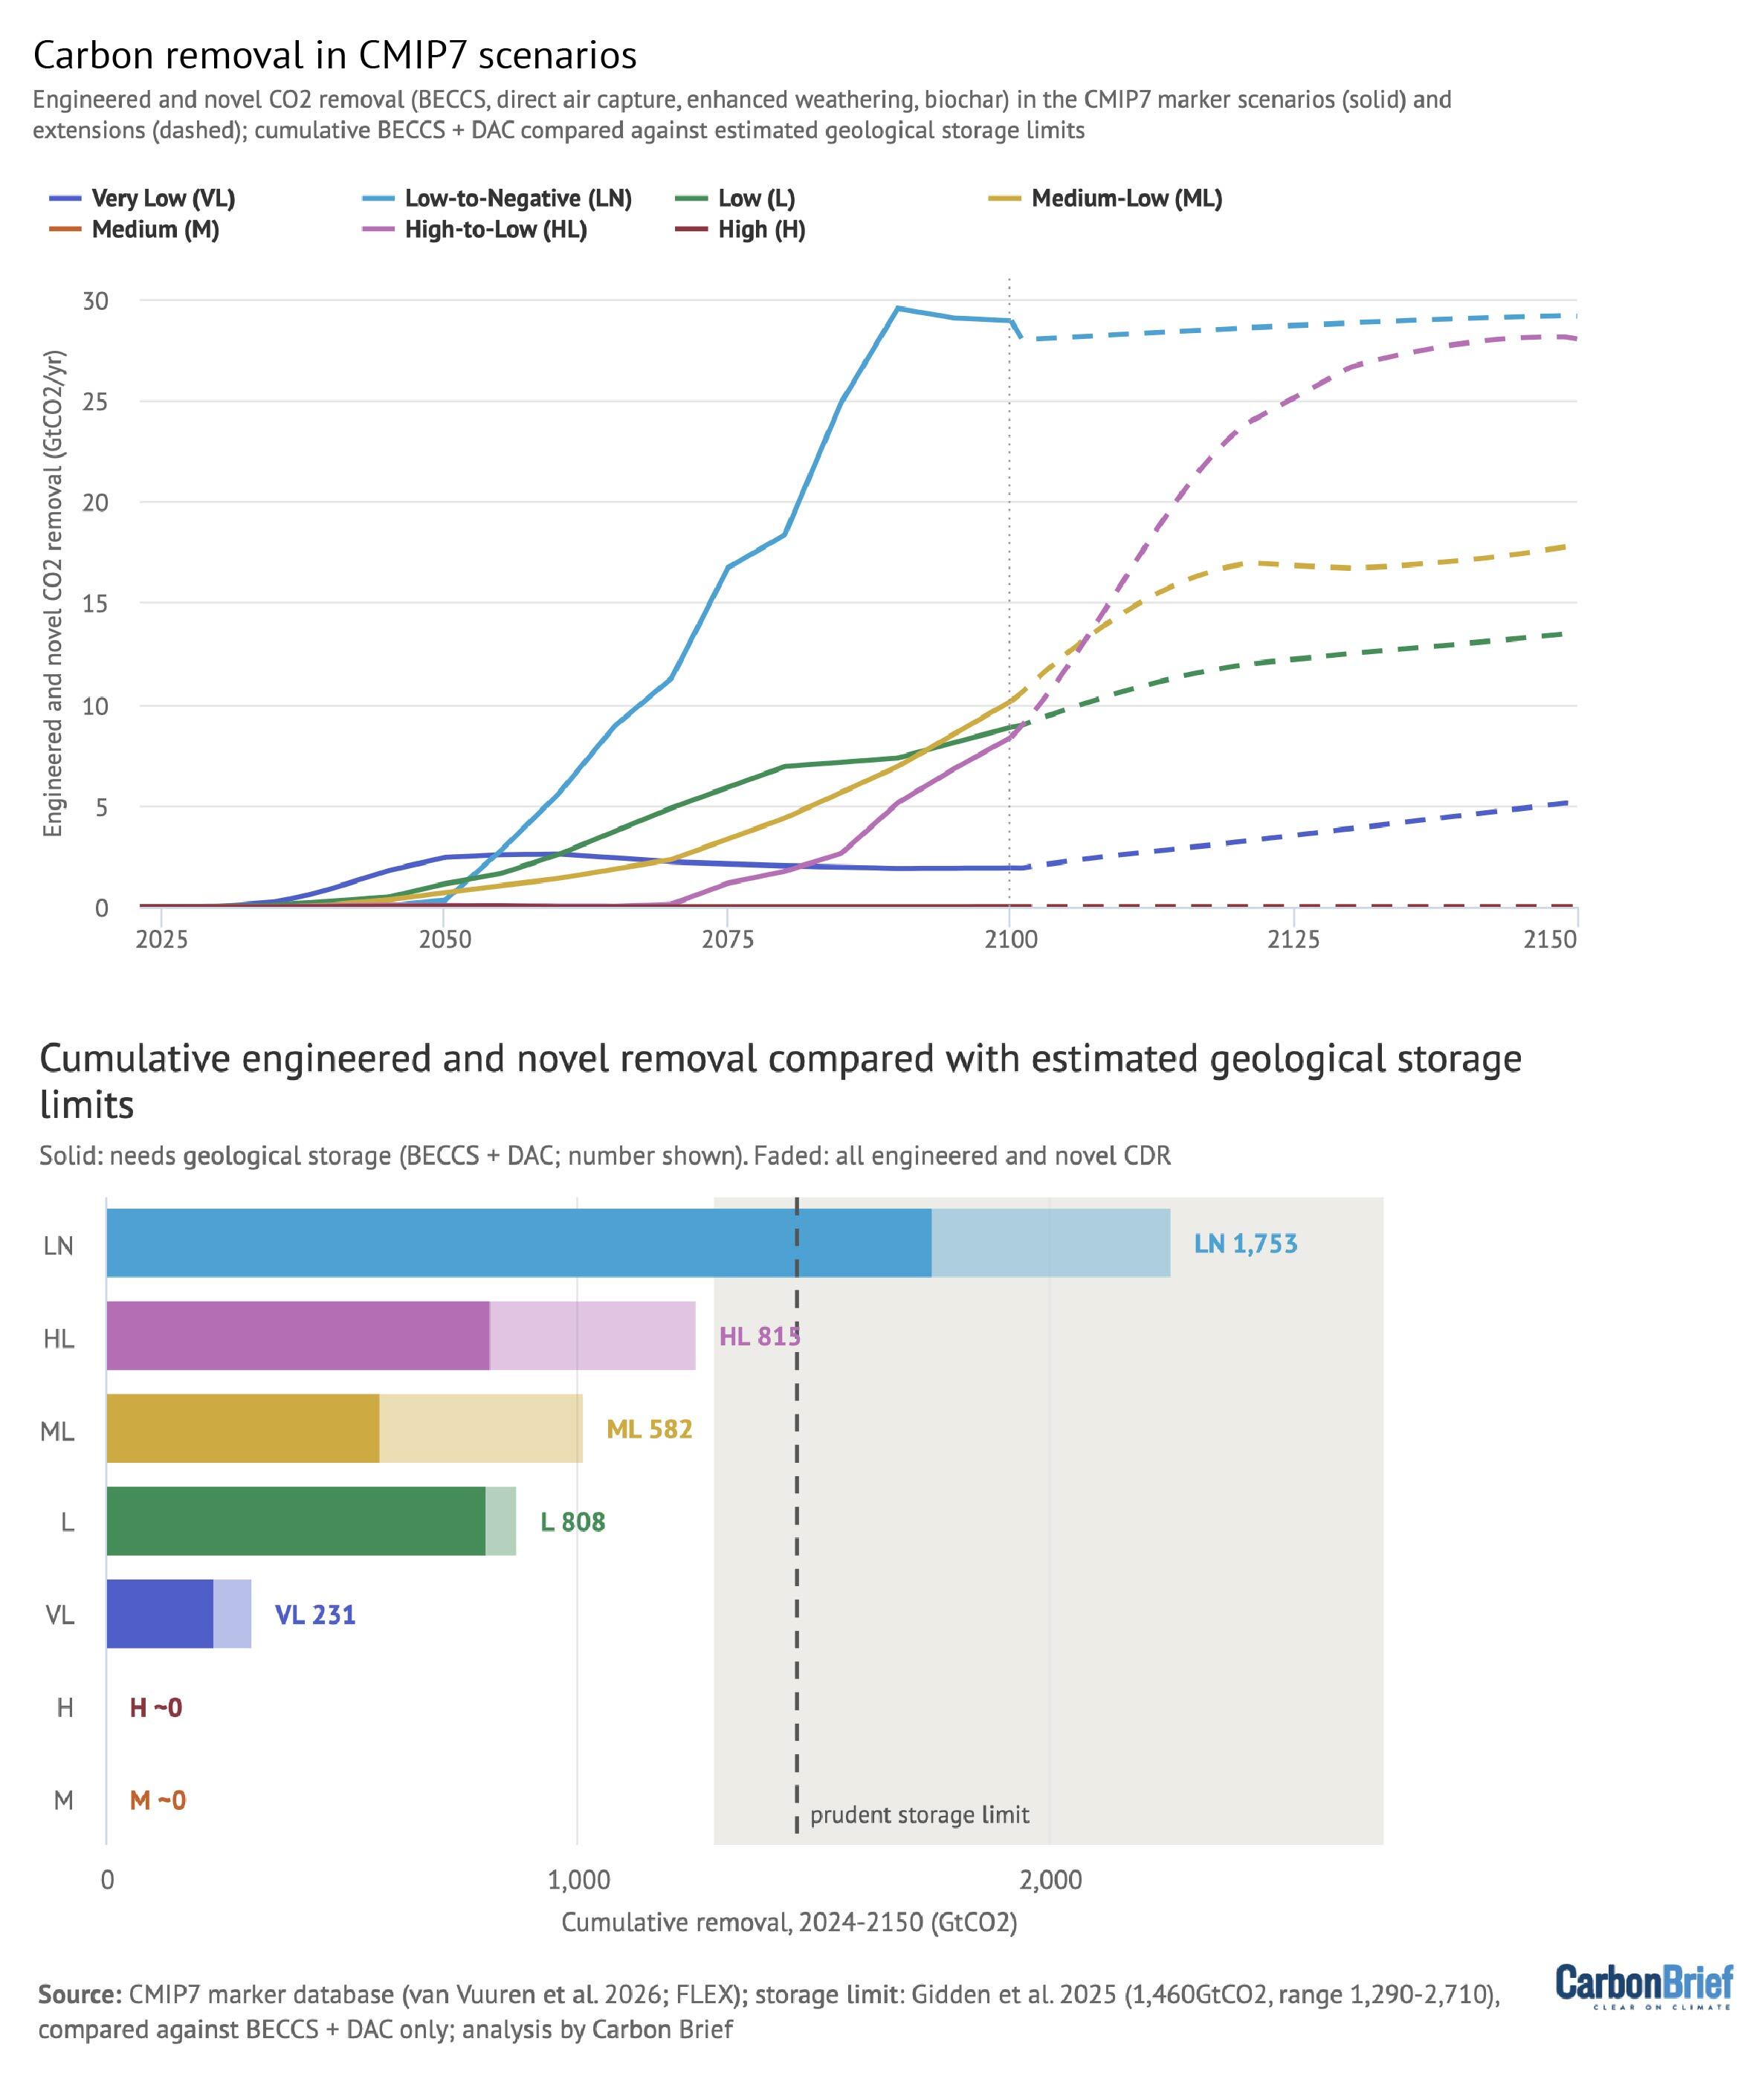
Geological Storage Feasibility: Technologies relying on permanent underground injection—such as Bioenergy with Carbon Capture and Storage (BECCS) and Direct Air Carbon Capture and Storage (DACCS)—are benchmarked against geological capacity constraints. The Low-to-Negative pathway allocates approximately 1,750 GtCO₂ to geological storage by 2150. This exceeds recent estimates for a "prudent" global storage threshold (~1,460 GtCO₂), highlighting potential resource limits.
To meet these extraction targets without exceeding sub-surface storage limits, models rely on alternative negative-emissions strategies. These include enhanced rock weathering, biochar application, surface mineralization, and ocean alkalinity enhancement, alongside land-based sinks like afforestation and soil management.
Official Statements & Expert Analysis
The publication of the CMIP7 scenario suite triggered widespread discussion within the climate science community regarding how risk, uncertainty, and policy success are communicated.
In their foundational paper published in Geoscientific Model Development, lead author Prof. Detlef van Vuuren and the ScenarioMIP coordination team addressed the retirement of extreme baseline scenarios:
"High-emission levels corresponding to the old SSP5-8.5 have become implausible based on trends in the costs of renewables, the emergence of climate policy, and recent emission trends… Scenarios should no longer explore worlds completely devoid of climate policy as a counterfactual, but should instead evaluate the consequences of maintaining, strengthening, or rolling back the policies implemented in the real world."
Responding to potential misunderstandings of the revised figures, scenario architects emphasized that lower peak warming estimates should not be interpreted as a clean bill of health for the planet.
In supplementary commentary released alongside the underlying data, members of the ScenarioMIP bureau emphasized:
"The retirement of 5°C warming scenarios reflects genuine progress in deploying clean energy technologies, but it also reflects a long-overdue cleanup of modeling methodology. A world warming by 2.9°C or 3.3°C under current or weakened policies remains catastrophic for ecosystems, infrastructure, and human life. We have moved from a trajectory of absolute existential catastrophe to one of severe, persistent global disruption."
Addressing the practical realities of the Paris Agreement targets, the GMD author team noted:
"Given the trajectory of global emissions through 2025, an overshoot of the 1.5°C threshold is now an inescapable reality across all plausible pathways. The focus of modern climate science must shift toward understanding the duration, peak magnitude, and potential environmental reversibility of that overshoot period."
Future Outlook & Strategic Implications
The deployment of the CMIP7 framework will shape climate science, corporate risk reporting, and international policy through the late 2020s and into the 2030s.
Re-calibration of Stress-Testing Protocols:
Central banks, financial institutions, and corporate boards using scenario analysis (such as TCFD and NGFS frameworks) will need to adjust their benchmark inputs. Physical risk stress-testing will shift away from 5°C warming outcomes toward high-end risk bounds of 3.0°C to 4.0°C. However, transition risk assessments must now grapple with the massive deployment of negative emissions built into low-carbon pathways.
Managing Carbon Cycle Uncertainties:
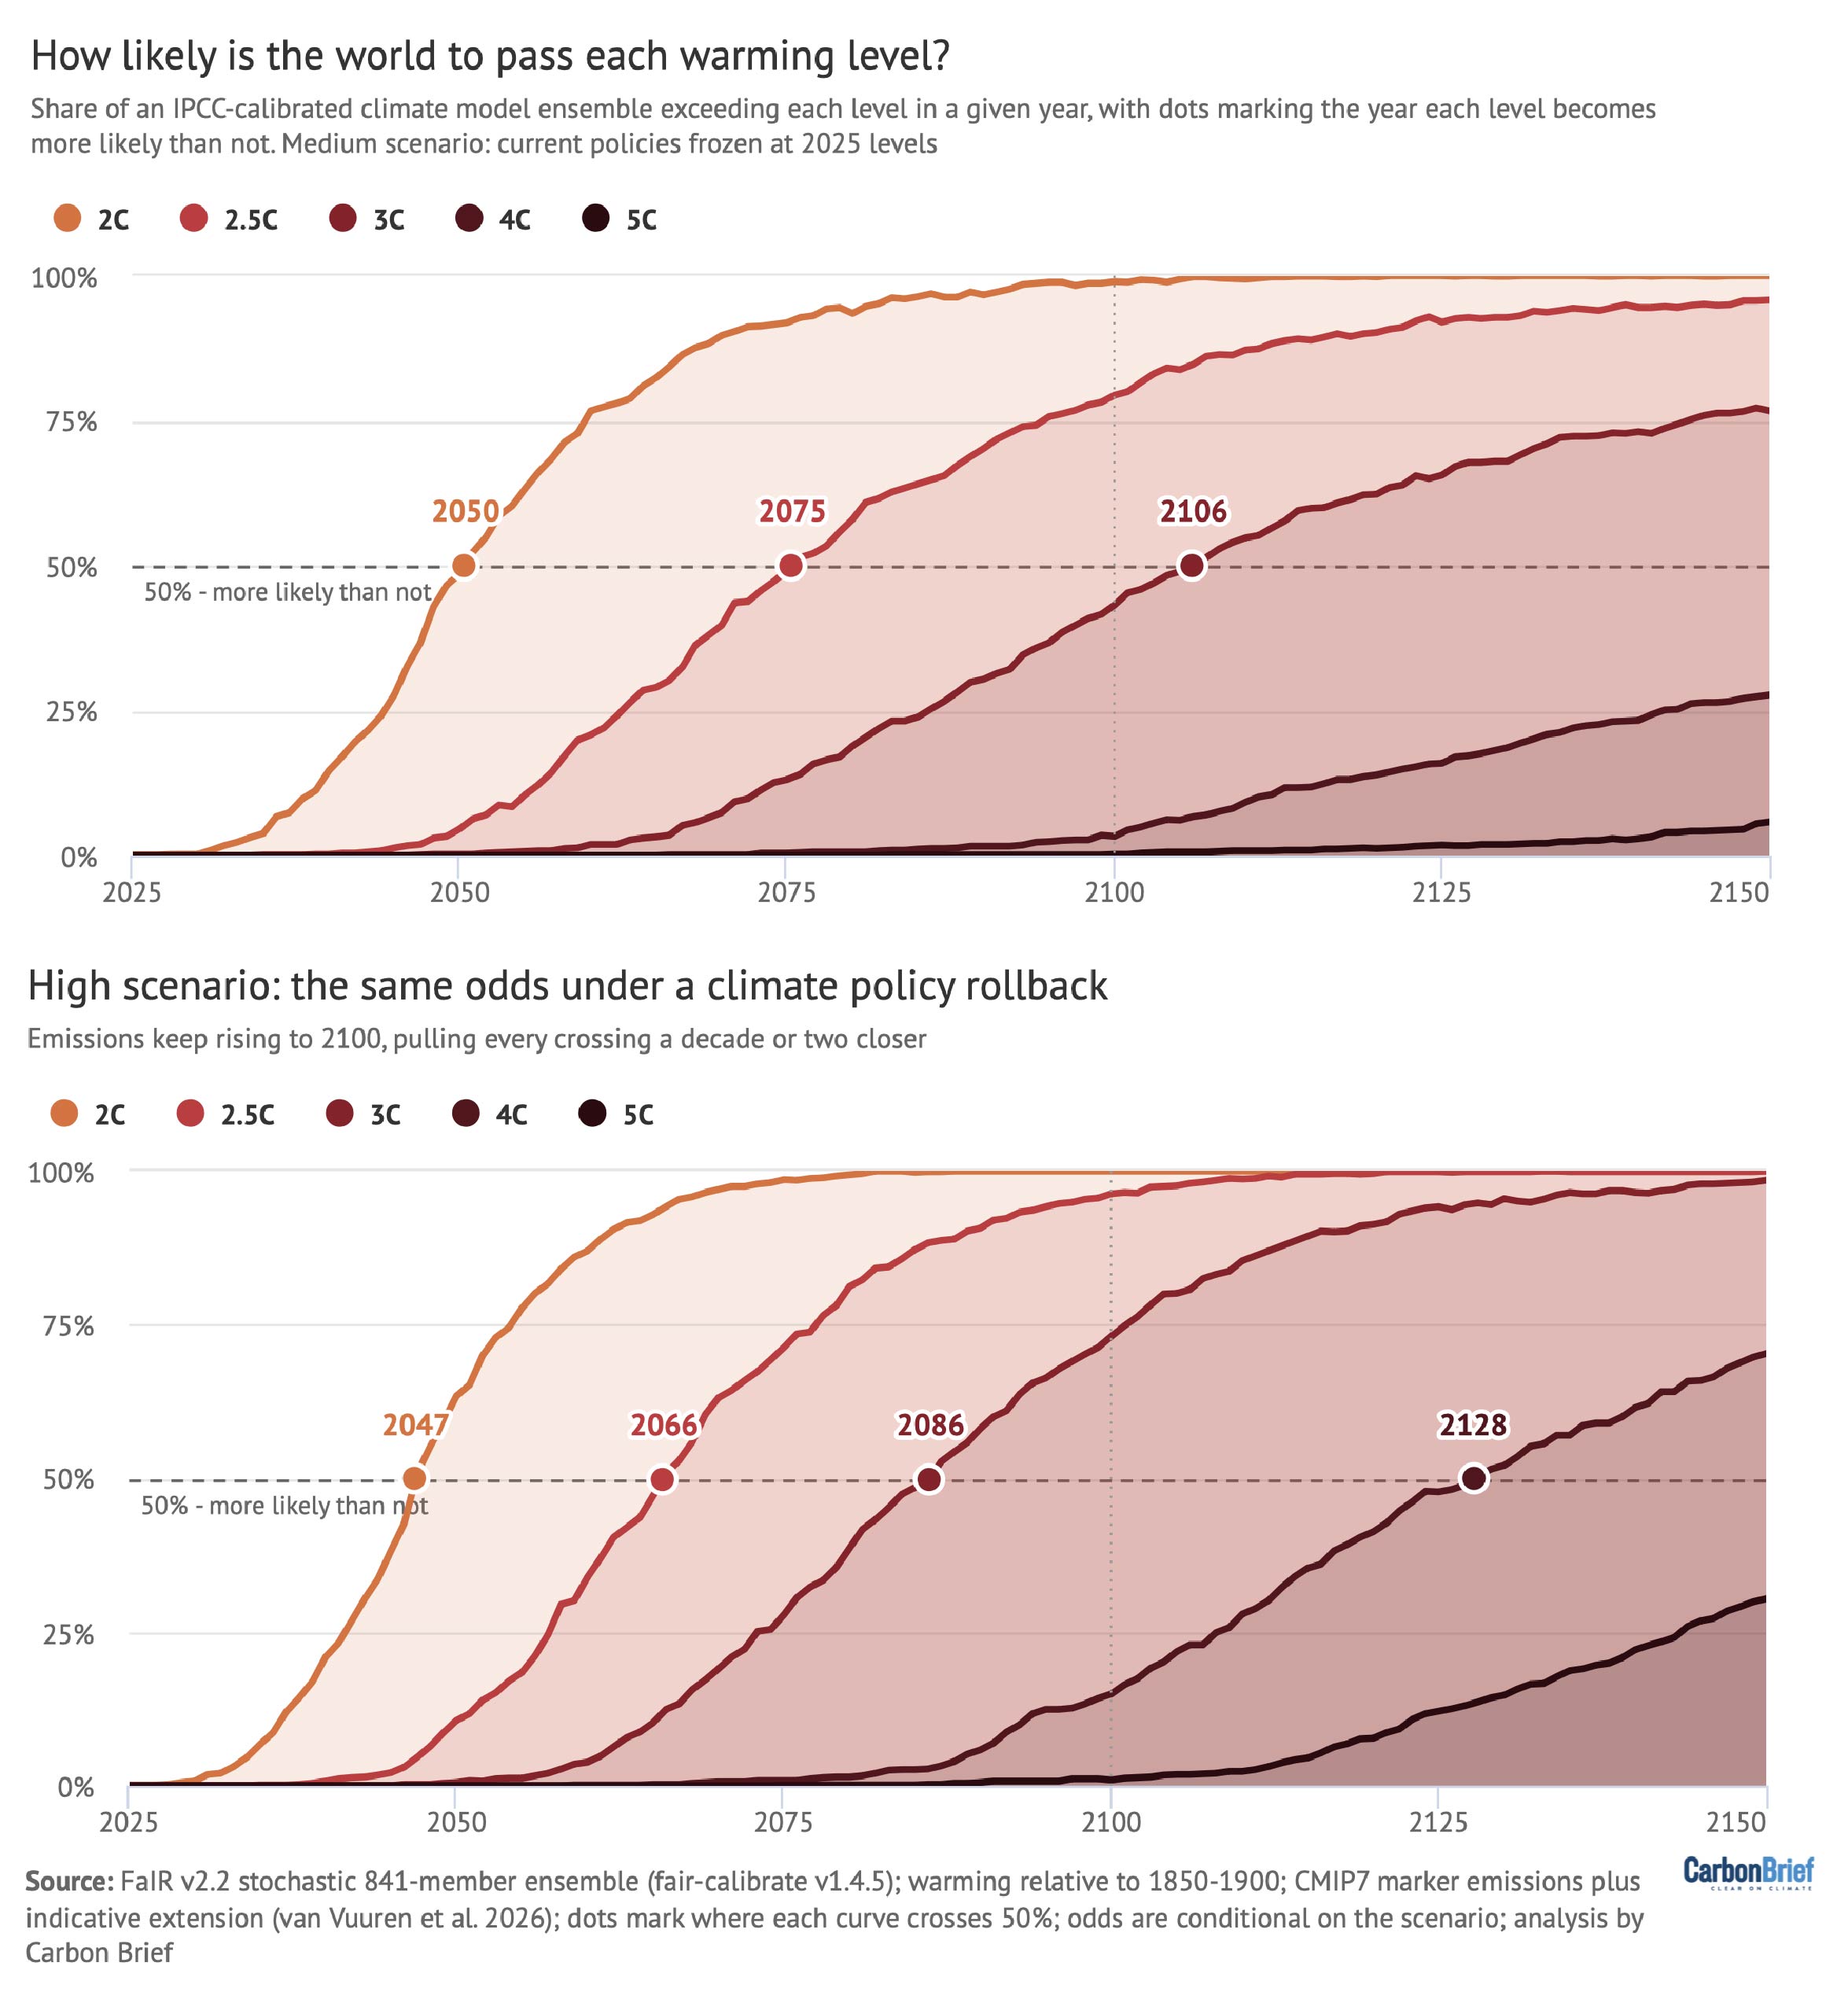
By transitioning to emissions-driven runs, CMIP7 climate models will naturally show a wider spread of potential warming outcomes for a given scenario. Even under the current-policy "Medium" scenario (median 2.9°C), carbon-cycle feedback uncertainties yield a 3% chance of warming exceeding 4.0°C by 2100, rising to 25% by 2150 if emissions continue.
The Scale of the Overshoot Challenge:
Because all plausible pathways exceeding 1.5°C require massive, multi-generational carbon removal efforts to lower global temperatures, political and financial leaders face a key challenge: developing governance framework and capital markets capable of funding trillion-dollar negative-emissions programs through the second half of the 21st century.
As Earth-system modeling teams run the CMIP7 suite through 2027, the resulting data will offer humanity a clearer picture of its future options. While the retirement of doomsday coal baselines confirms that early clean energy transitions are making a difference, the CMIP7 pathways demonstrate that avoiding severe climate impacts will require far deeper structural decarbonization than today’s policies provide.