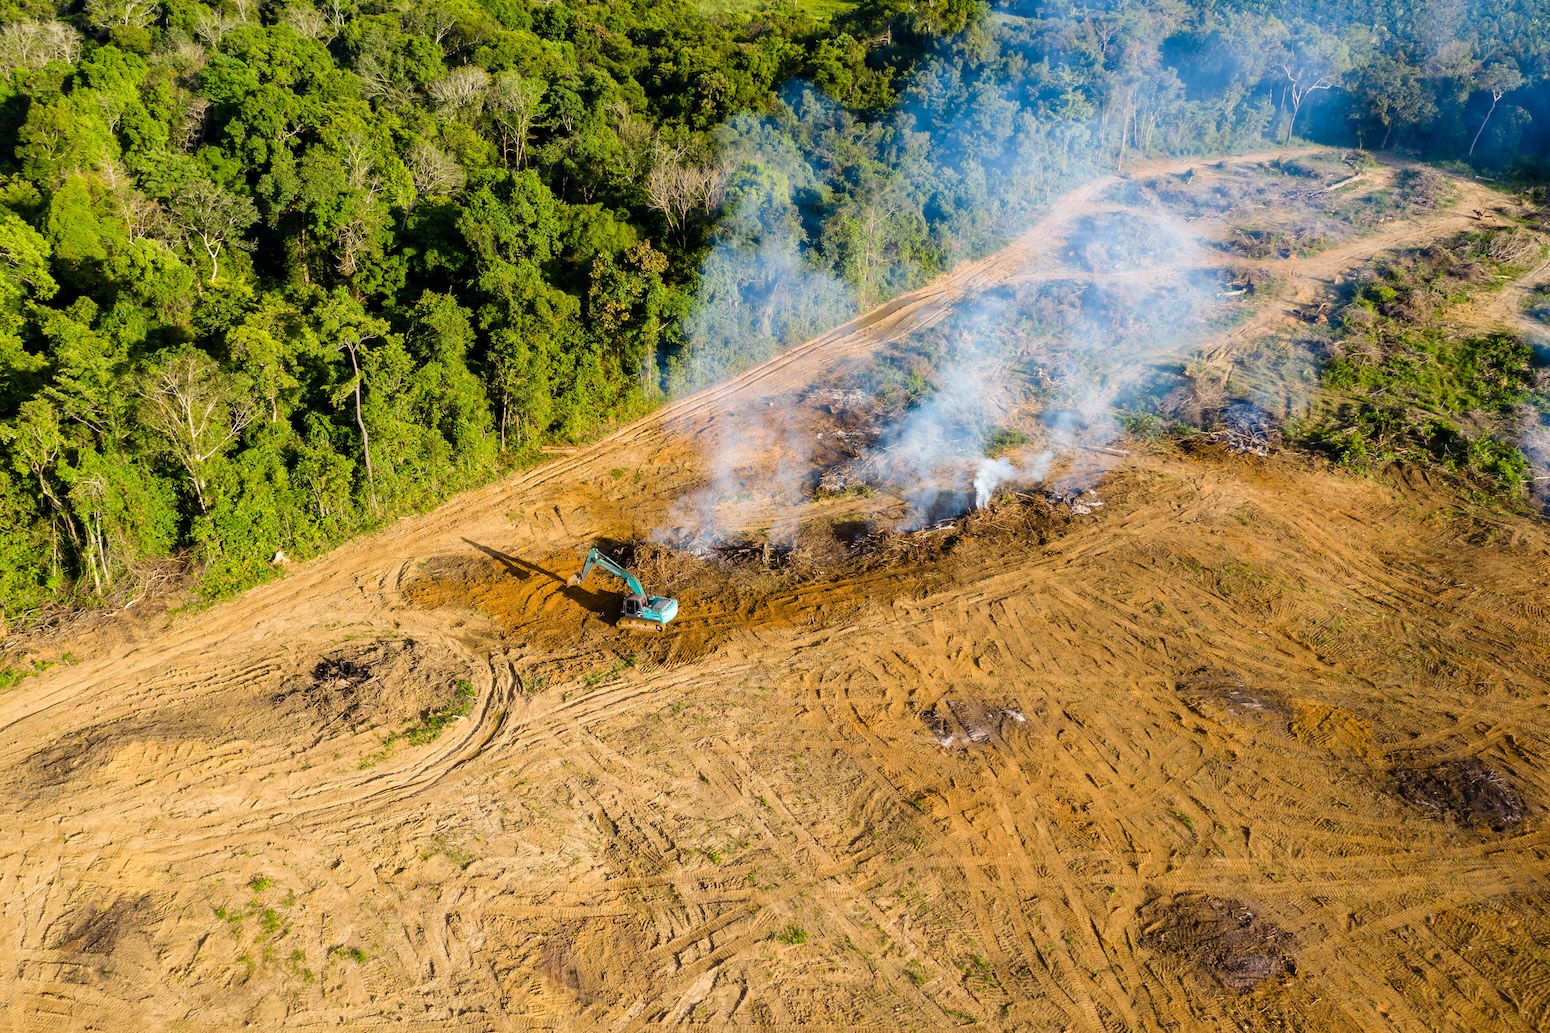
In a rare structural shift within the global carbon cycle, carbon dioxide ($textCO_2$) emissions from land-use change—comprising deforestation, forest degradation, and peatland destruction—have experienced a sustained and statistically significant decline throughout the first quarter of the 21st century.
According to the latest Global Carbon Budget report, formally published in Earth System Science Data, anthropogenic land-use emissions have broken away from decades of stagnation, accelerating into a steep downward trajectory after 2015.
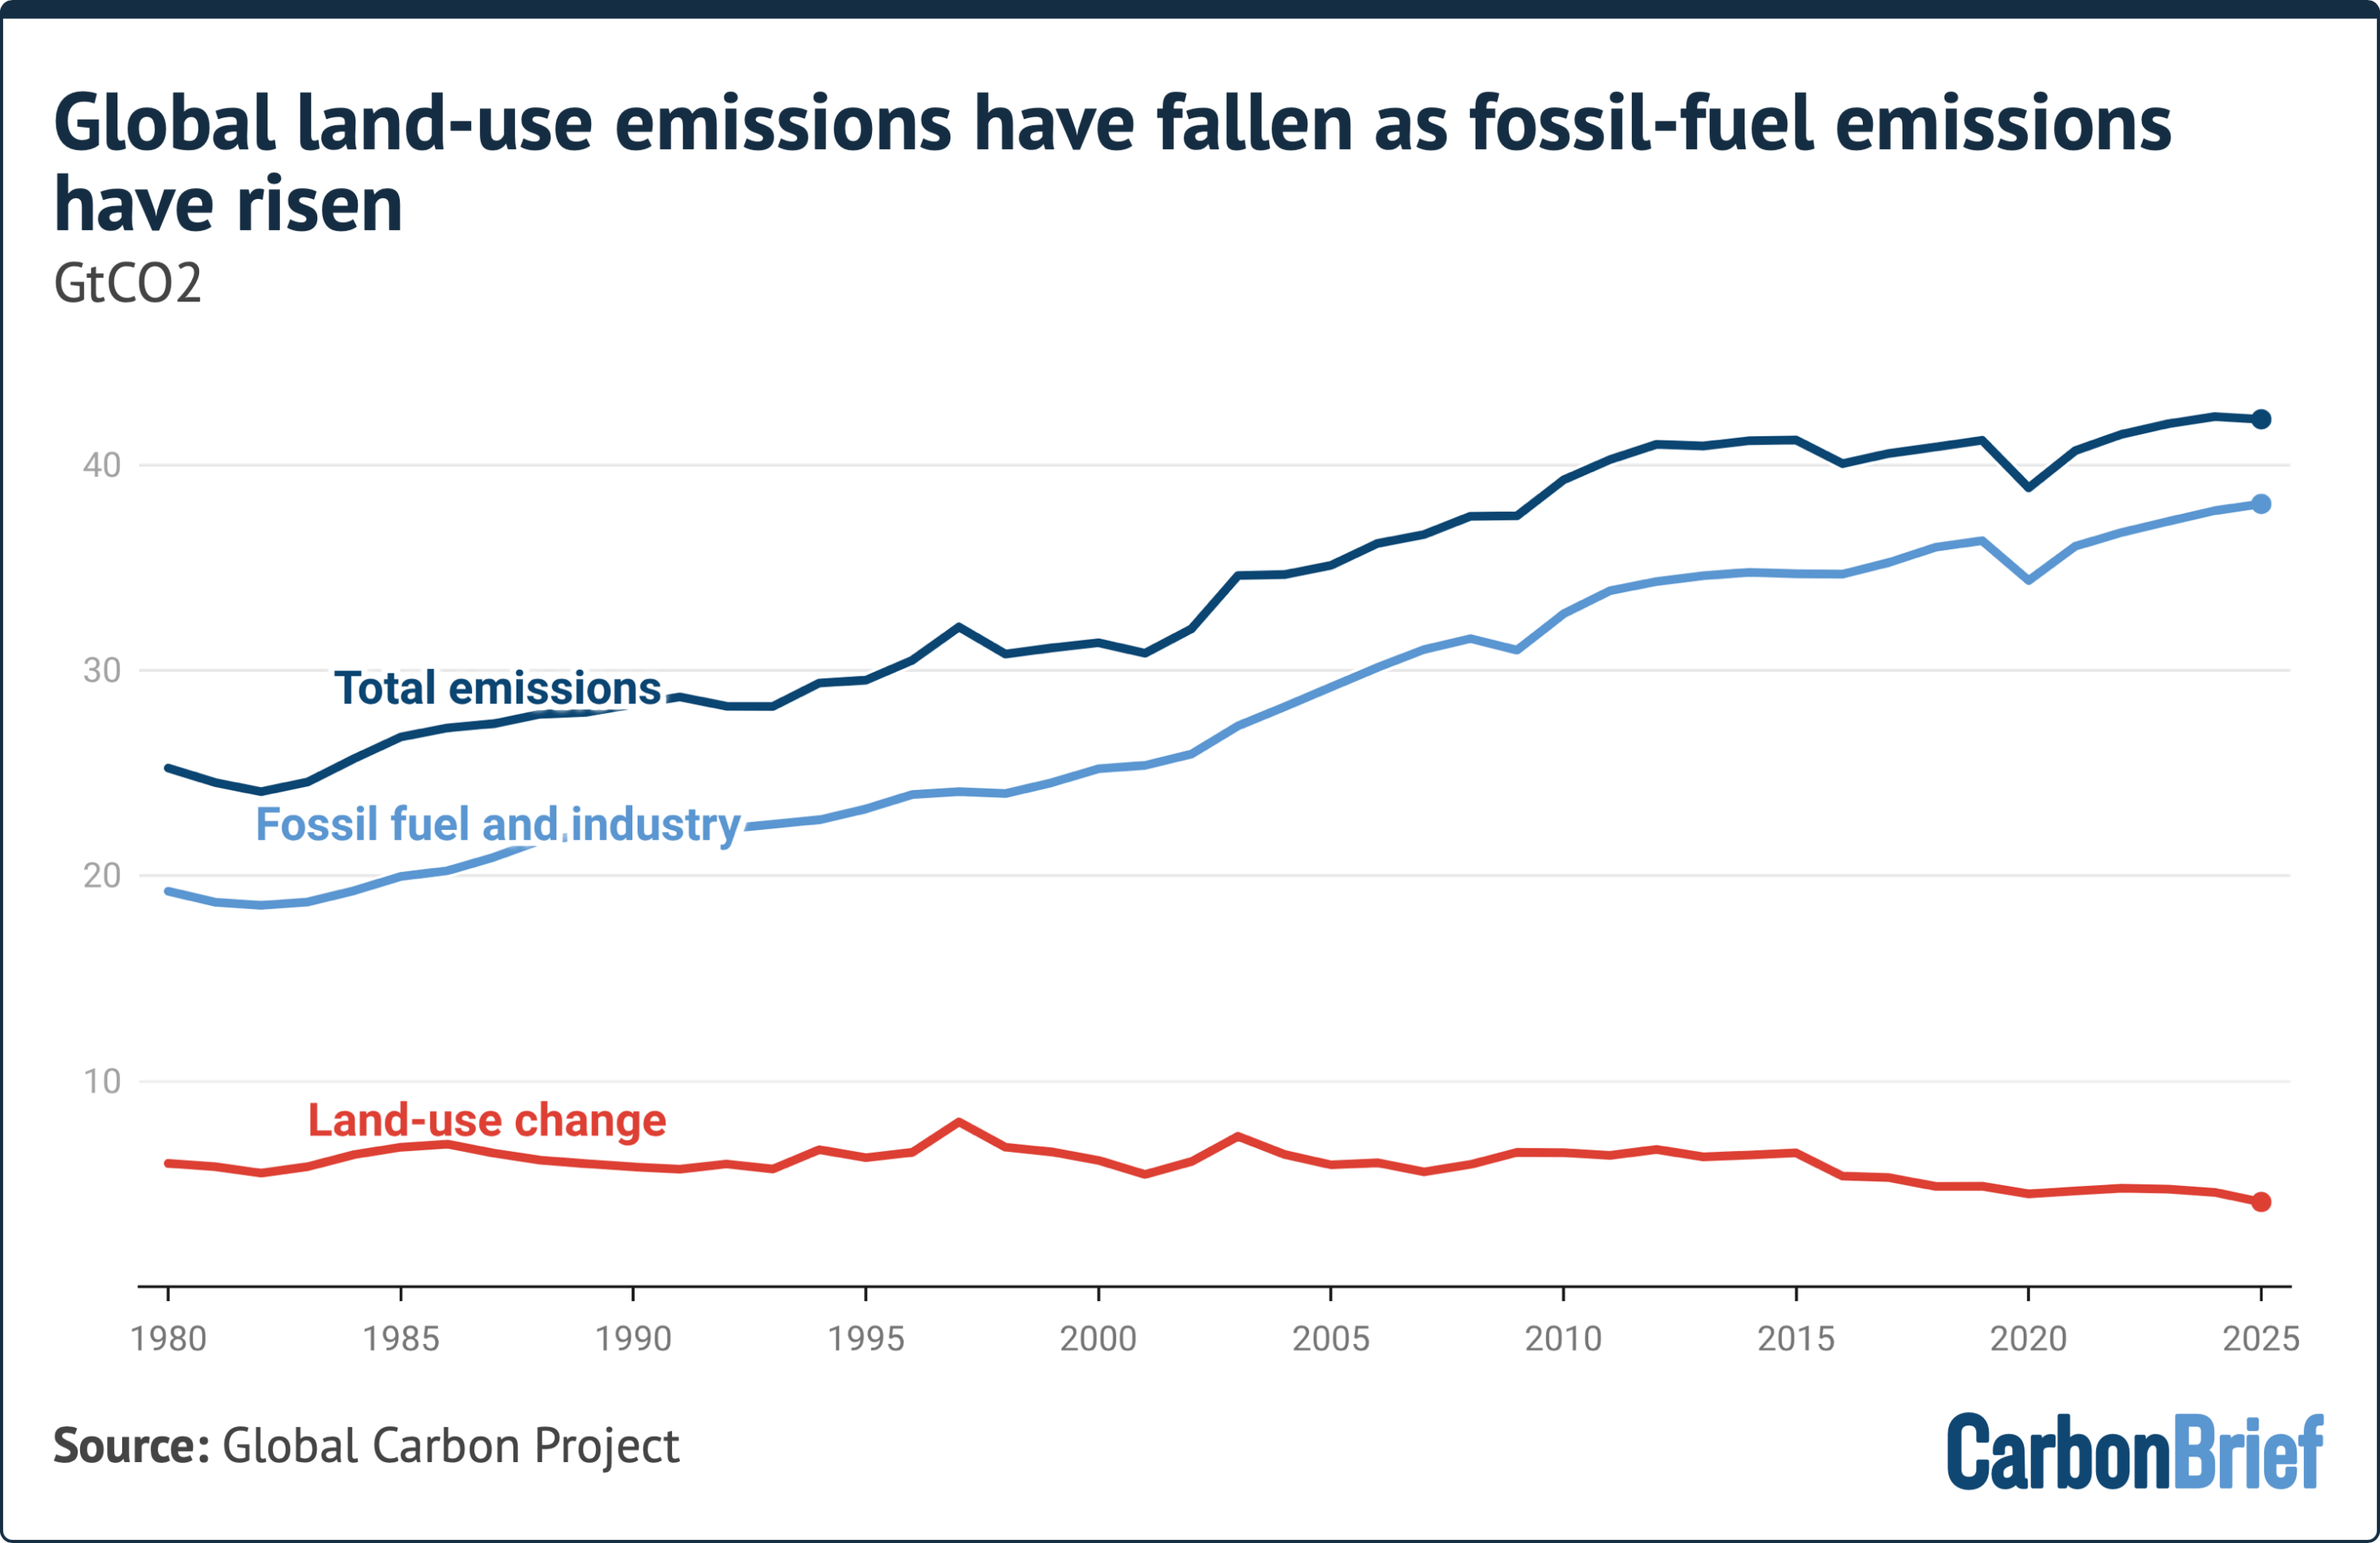
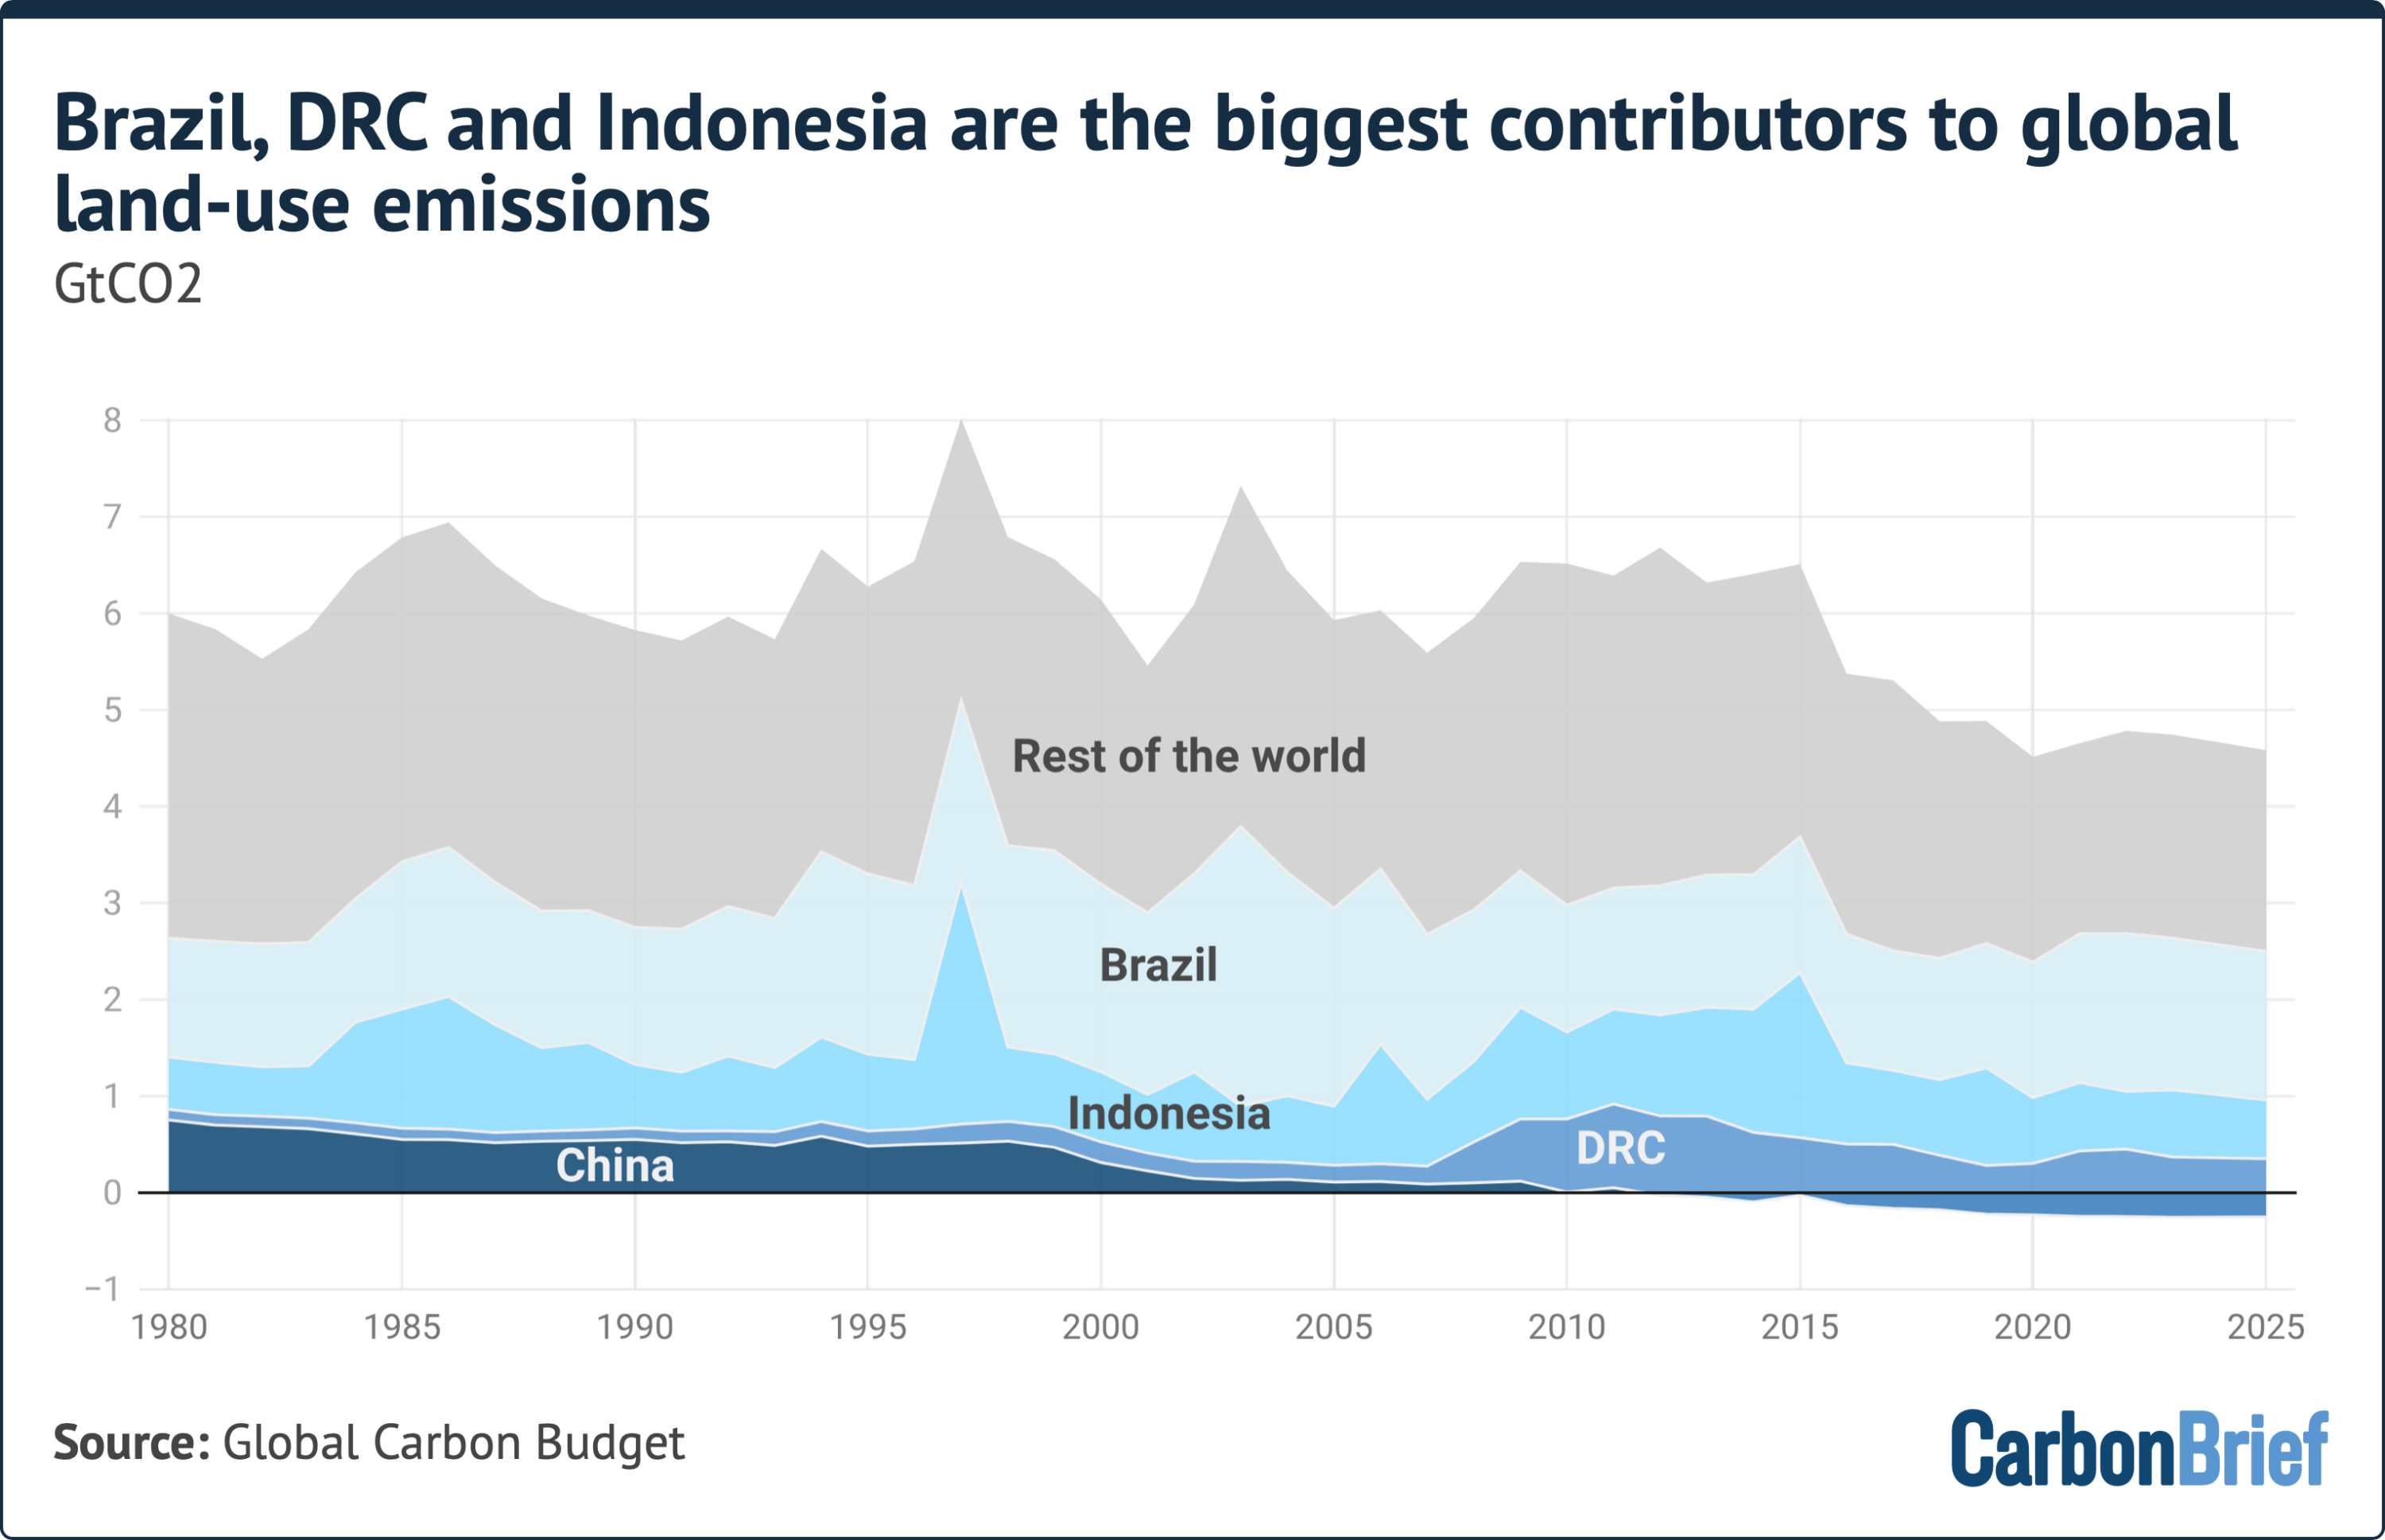
Data compiled by climate scientists reveals that annual land-use, land-use change, and forestry (LULUCF) emissions averaged 5.0 billion tonnes of carbon dioxide ($textGtCO_2$) per year over the decade spanning 2015 to 2024. This represents a 23% drop compared to the 1995–2004 average and a 19% reduction from the 2005–2014 period. Preliminary figures for 2025 place land-use emissions lower still, at an estimated 4.1 $textGtCO_2$—roughly 32% below the annual averages recorded in the 2000s.
This structural decline stands in stark contrast to global emissions from fossil fuels and cement manufacturing, which have continued their upward trajectory. Fossil emissions rose from an average of 11.0 $textGtCO_2$ per year in the 1960s to 35.9 $textGtCO_2$ during 2015–2024, touching a record high of 38.1 $textGtCO_2$ in 2025.
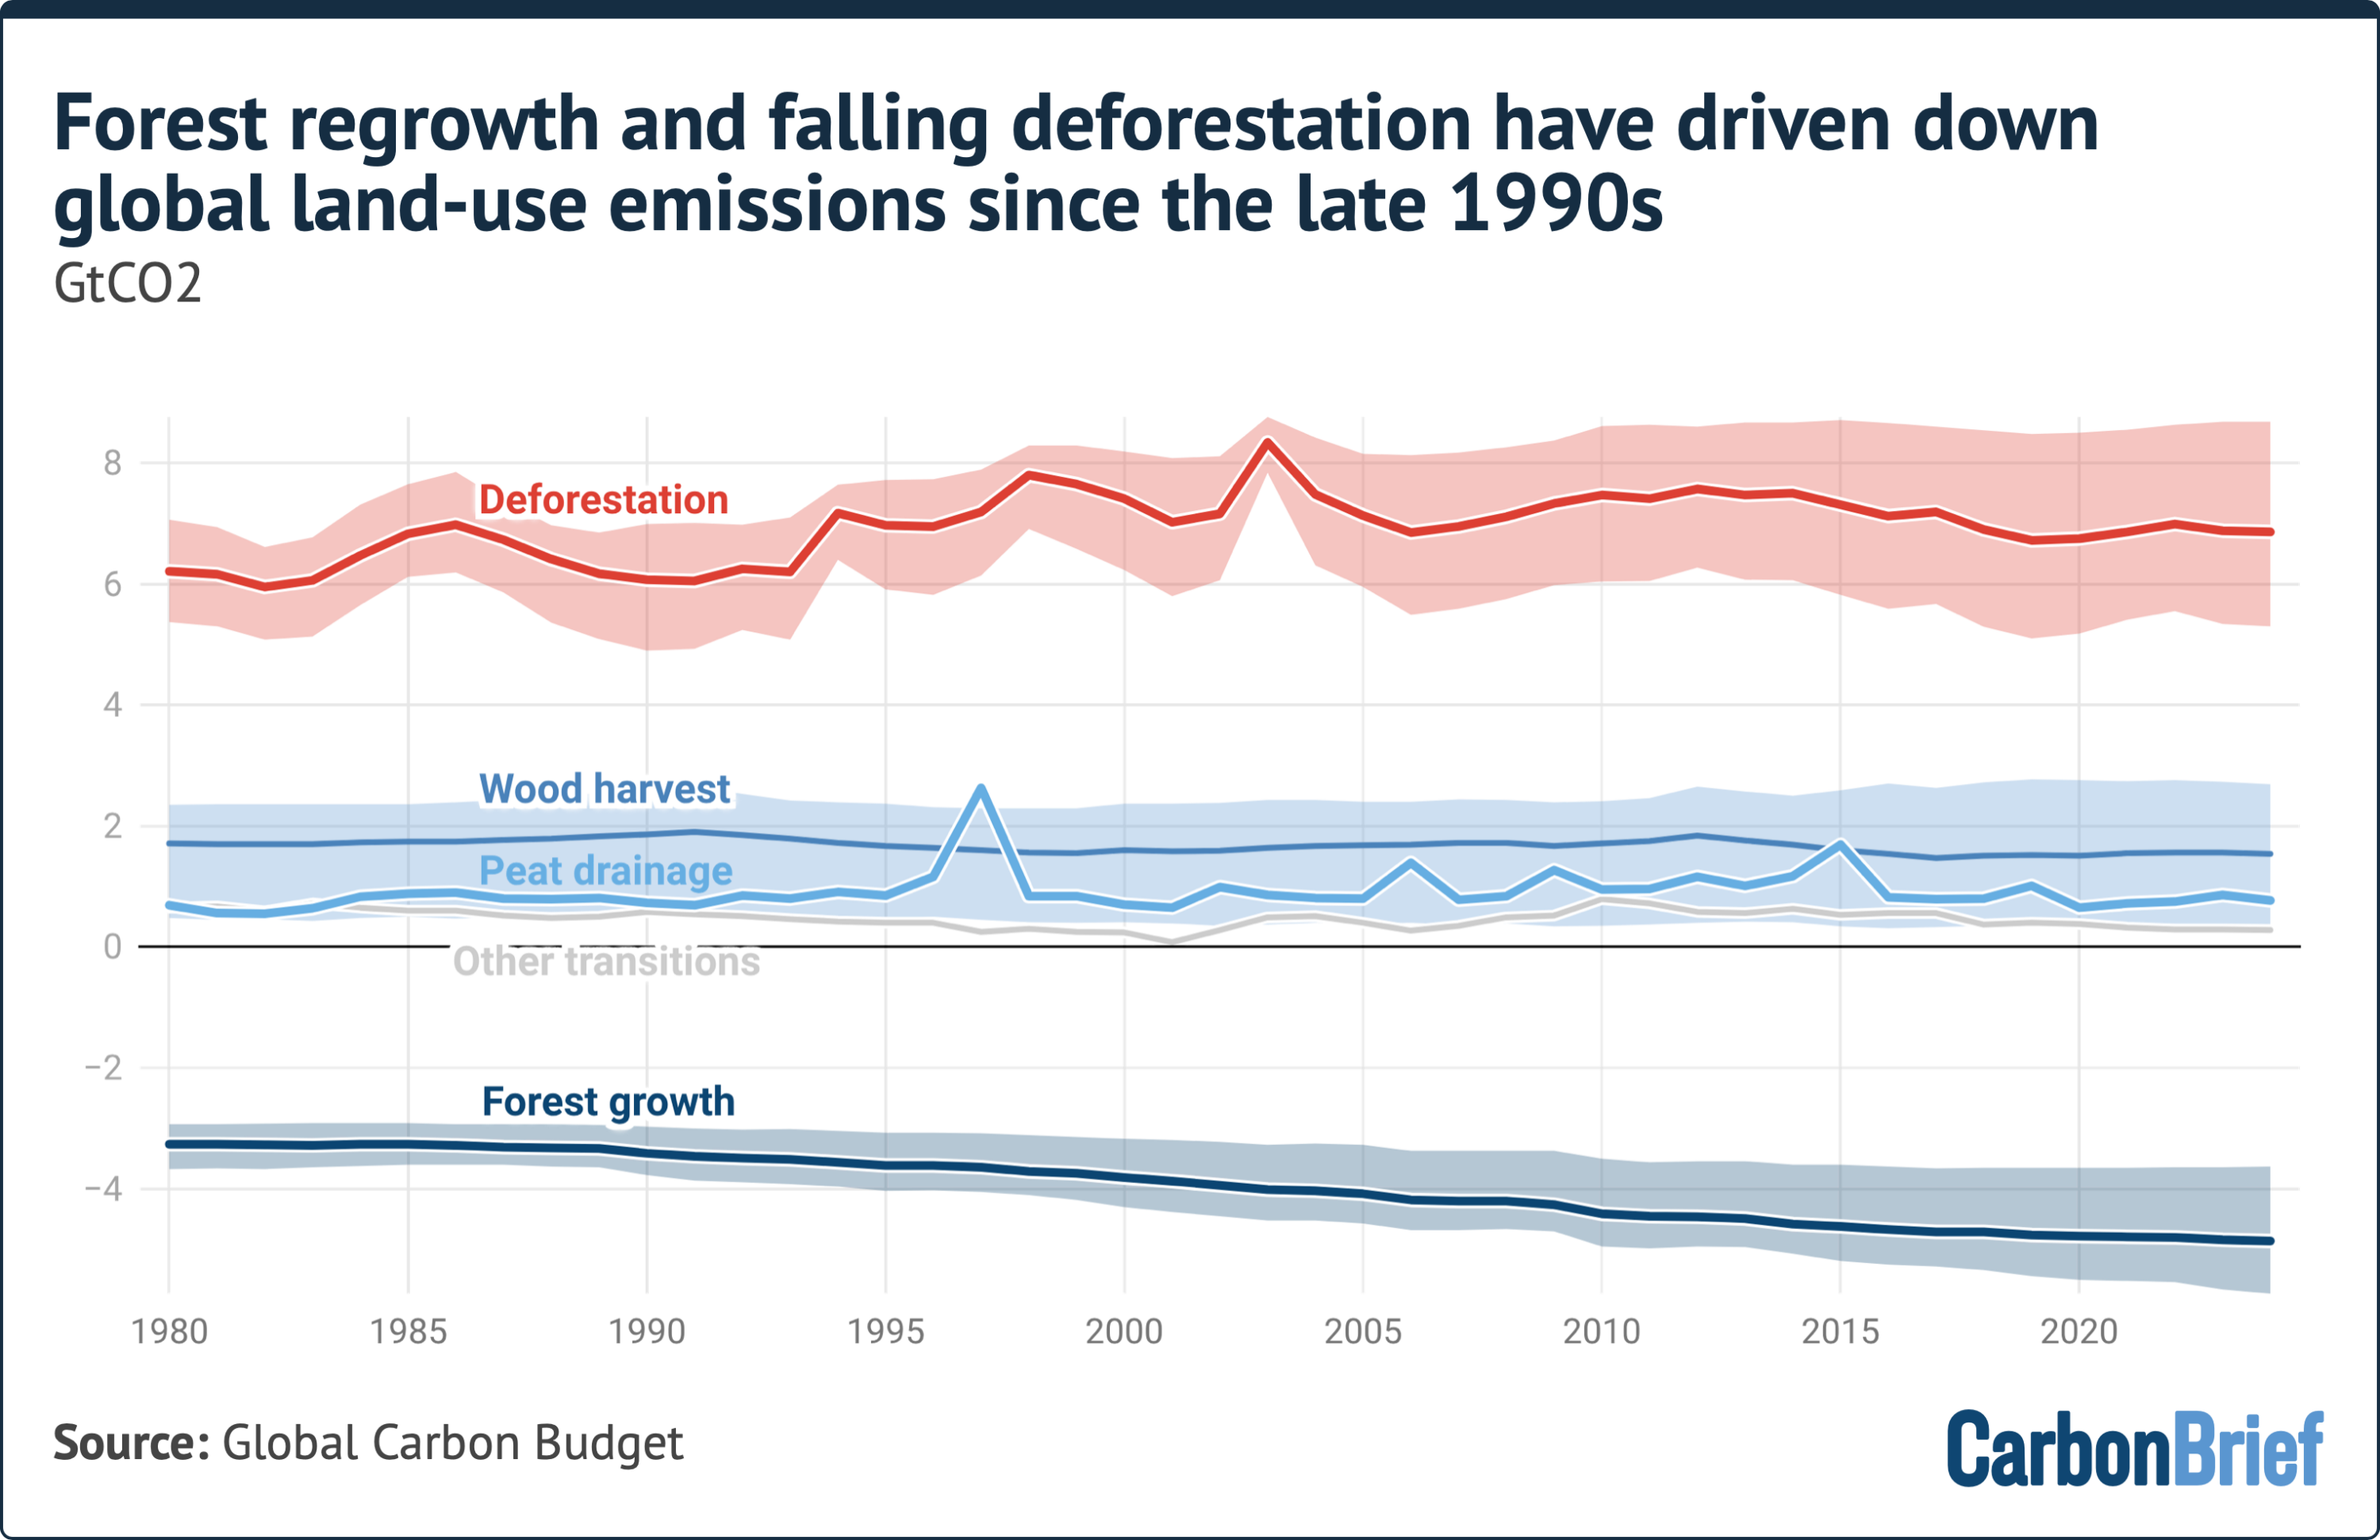
The decline in land-use emissions has provided a vital, albeit partial, break on total anthropogenic greenhouse gas output. The reduction is driven primarily by two major mechanisms: a long-term reduction in permanent tropical deforestation—led historically by Brazil and more recently by Indonesia—and a substantial increase in carbon sequestration achieved through targeted afforestation, reforestation, and natural forest recovery, dominated by initiatives across China, Europe, and the United States.
Detailed Chronology of a 25-Year Paradigm Shift
To understand the current decline in land-use emissions, it is necessary to examine how global land management, policy interventions, and climate phenomena have evolved over the last six decades.
CHRONOLOGY OF GLOBAL LAND-USE EMISSIONS (1960 - 2025)

1960s–1990s: THE PLATEAU ERA
  ├── Net emissions remain constant at ~6.6 GtCO2/year.
  └── High tropical clearing offset by steady temperate zone dynamics.

Late 1990s–2000s: THE FIRST PIVOT
  ├── Amazon deforestation reaches historical peak in Brazil.
  └── Implementation of Brazil's Action Plan (PPCDAm) and 2006 Soy Moratorium.

2010–2015: TRANSITIONAL TURBULENCE
  ├── Peak in global peat fires during severe El Niño events (notably 2015).
  └── Long-term decline in permanent deforestation takes root across tropical belts.

2015–2024: THE ACCELERATION PHASE
  ├── Average net land-use emissions drop to 5.0 GtCO2/year.
  ├── Indonesian peatland rewetting programs scale rapidly post-2017.
  └── China's nationwide reforestation schemes deliver massive carbon drawdown.

2025 PRELIMINARY DATA: RECORD LOWS
  ├── Land-use emissions fall to an estimated 4.1 GtCO2/year (~32% below 2000s baseline).
  └── Exiting El Niño conditions reduces dry-season fire degradation.
The Plateau Era (1960–1999)
For nearly four decades prior to the turn of the century, net global $textCO_2$ emissions attributable to land-use change remained remarkably static. Between 1960 and 1999, net emissions held steady at approximately 6.6 $textGtCO_2$ per year. During this era, agricultural expansion in the tropics was largely balanced out by stable forestry management in temperate regions, leaving the global land-use flux effectively flat while industrial fossil fuel usage began to surge.
The First Pivot: Brazilian Amazon Protections (Early 2000s)
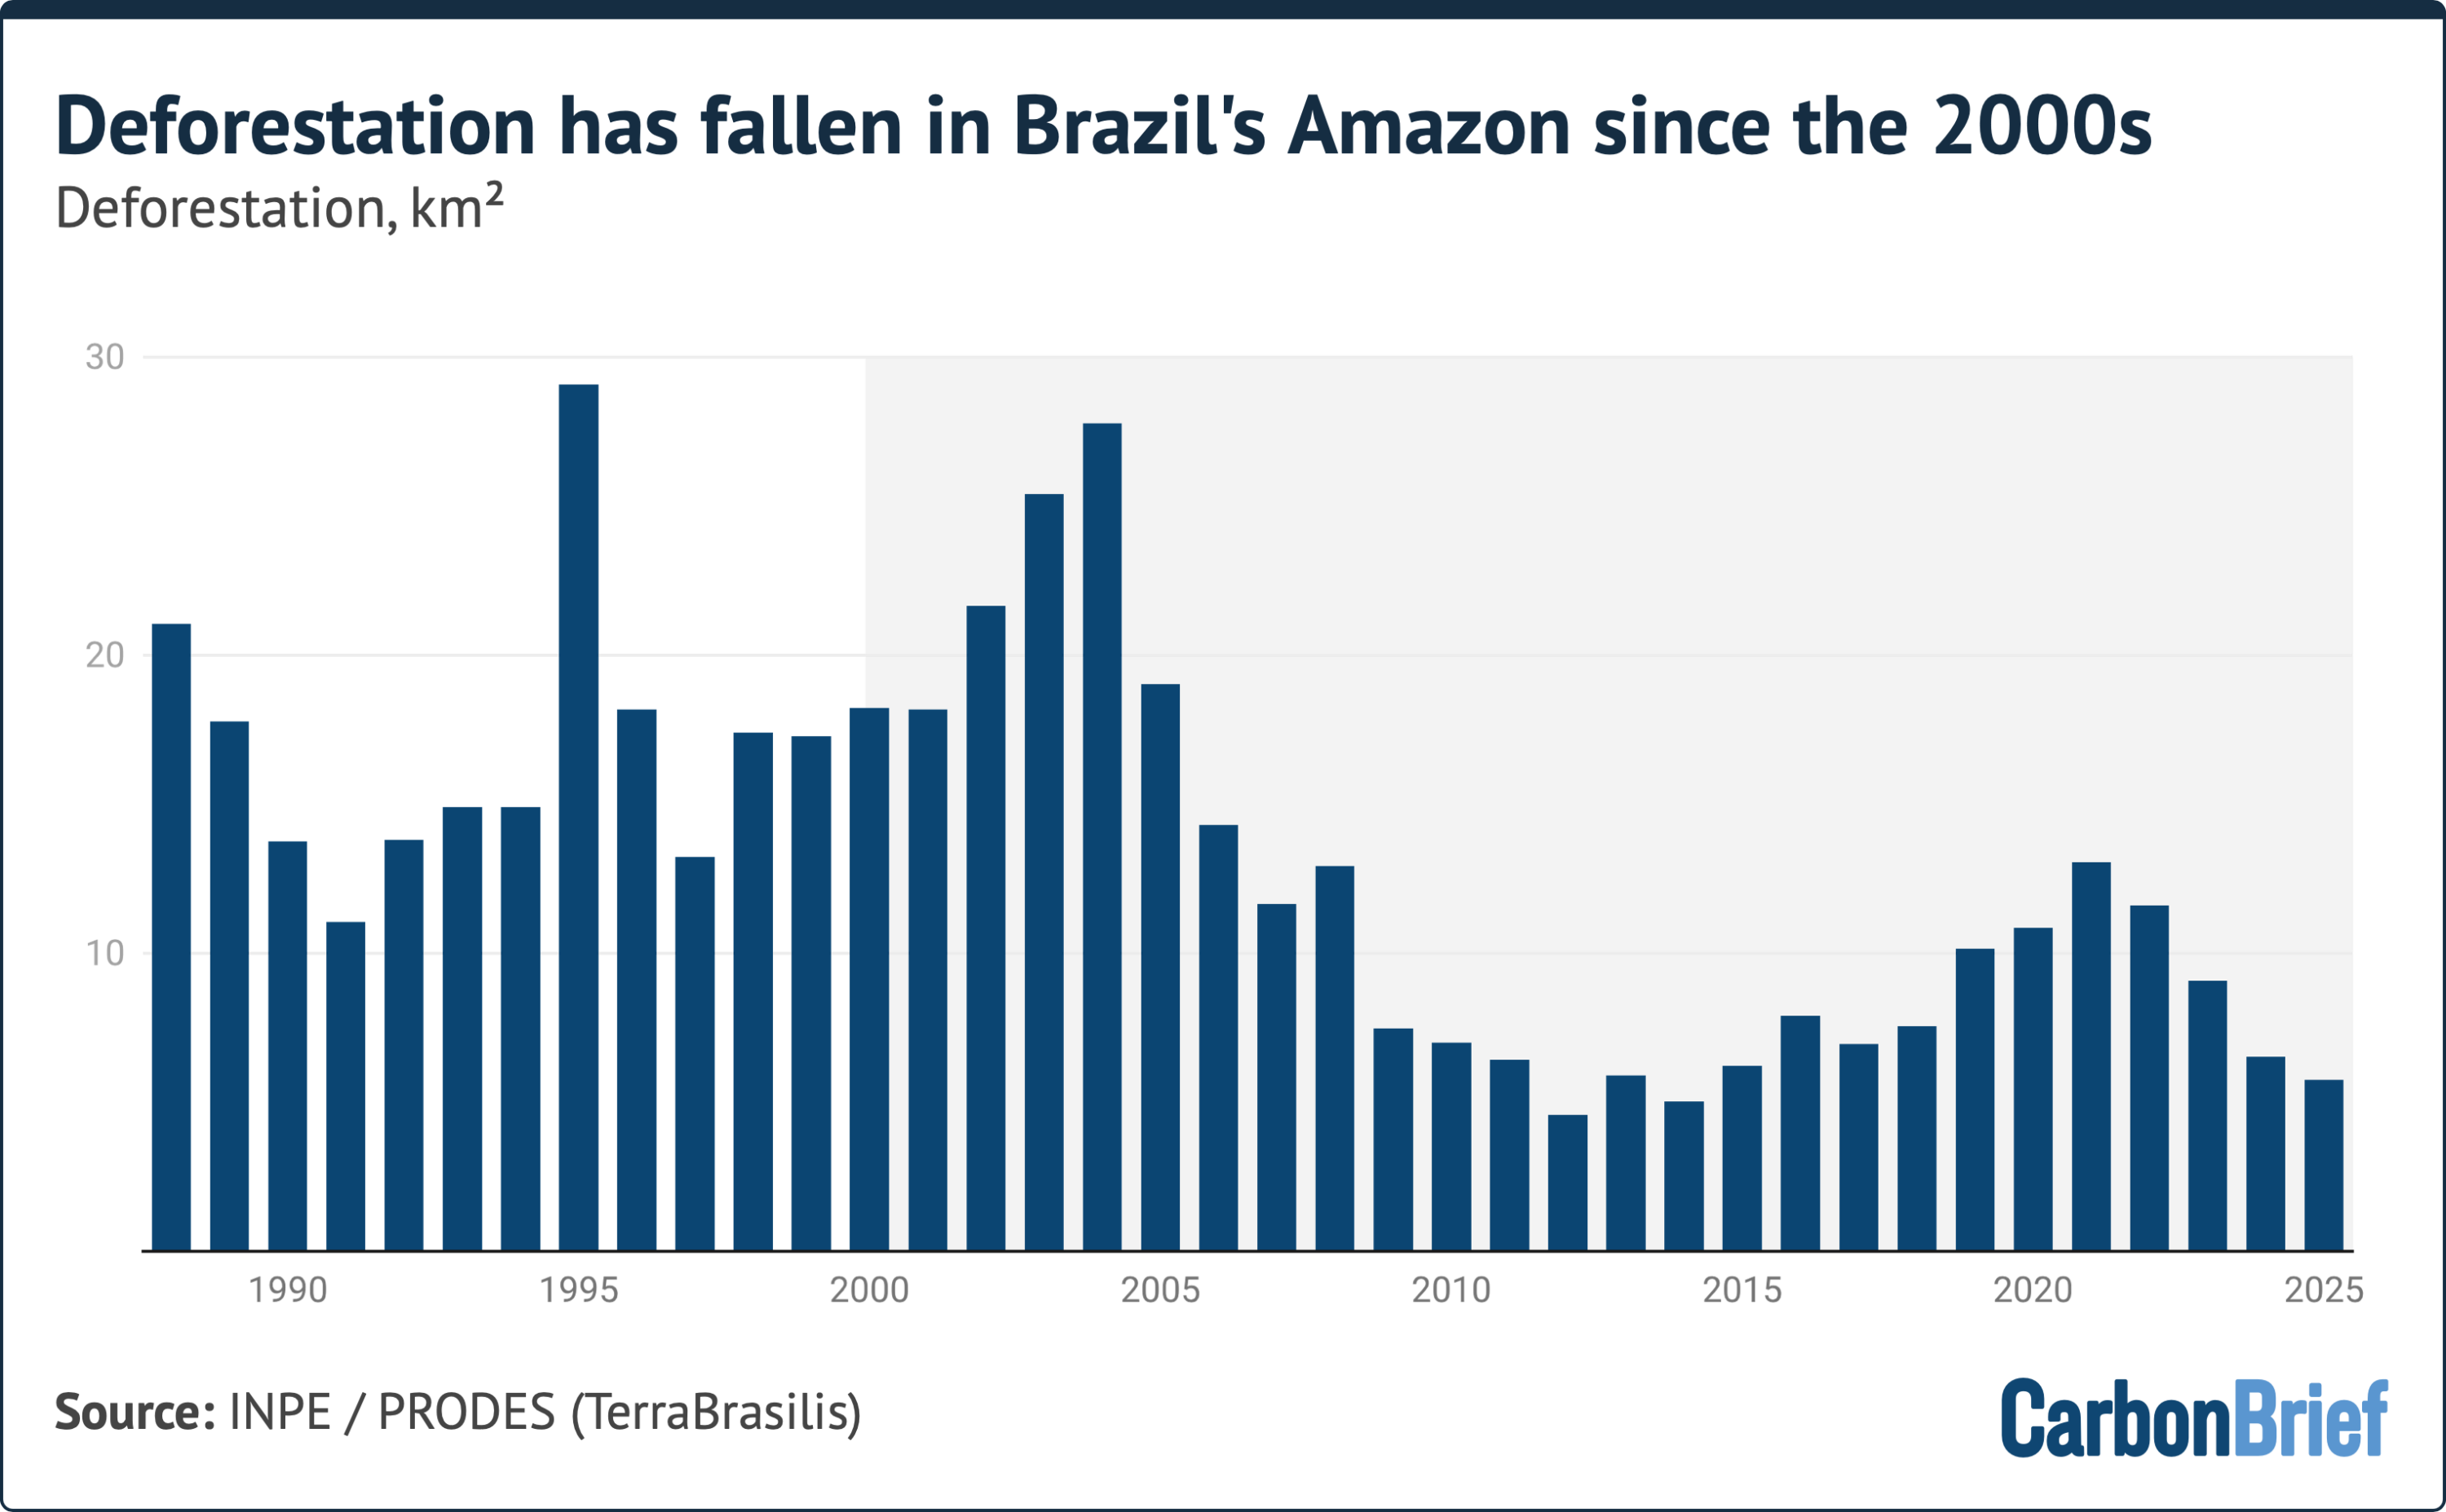
The late 1990s and early 2000s marked a turning point. Forest clearance in the South American continent—specifically within the Brazilian Amazon—reached historic highs, driving a pronounced peak in overall land emissions. In response, Brazil instituted systemic policy controls:
The 2004 Action Plan for the Prevention and Control of Deforestation in the Legal Amazon (PPCDAm) enhanced satellite enforcement and law enforcement presence.
The 2006 Soy Moratorium restricted commercial trade of crops grown on newly deforested land.
Major expansion of strictly protected indigenous and environmental reserves.
These combined measures triggered a marked multi-year drop in clear-cutting across the Amazon basin, altering the global baseline.
The Acceleration Phase (2015–2025)
The decadal drop became far more pronounced after 2015. While a severe El Niño in 2015 produced a transient surge in tropical peat fires—particularly across Southeast Asia—the decade that followed saw a convergence of positive land-use factors:
Peat Restoration: Indonesia scaled up nationwide peatland rewetting and anti-deforestation enforcement.
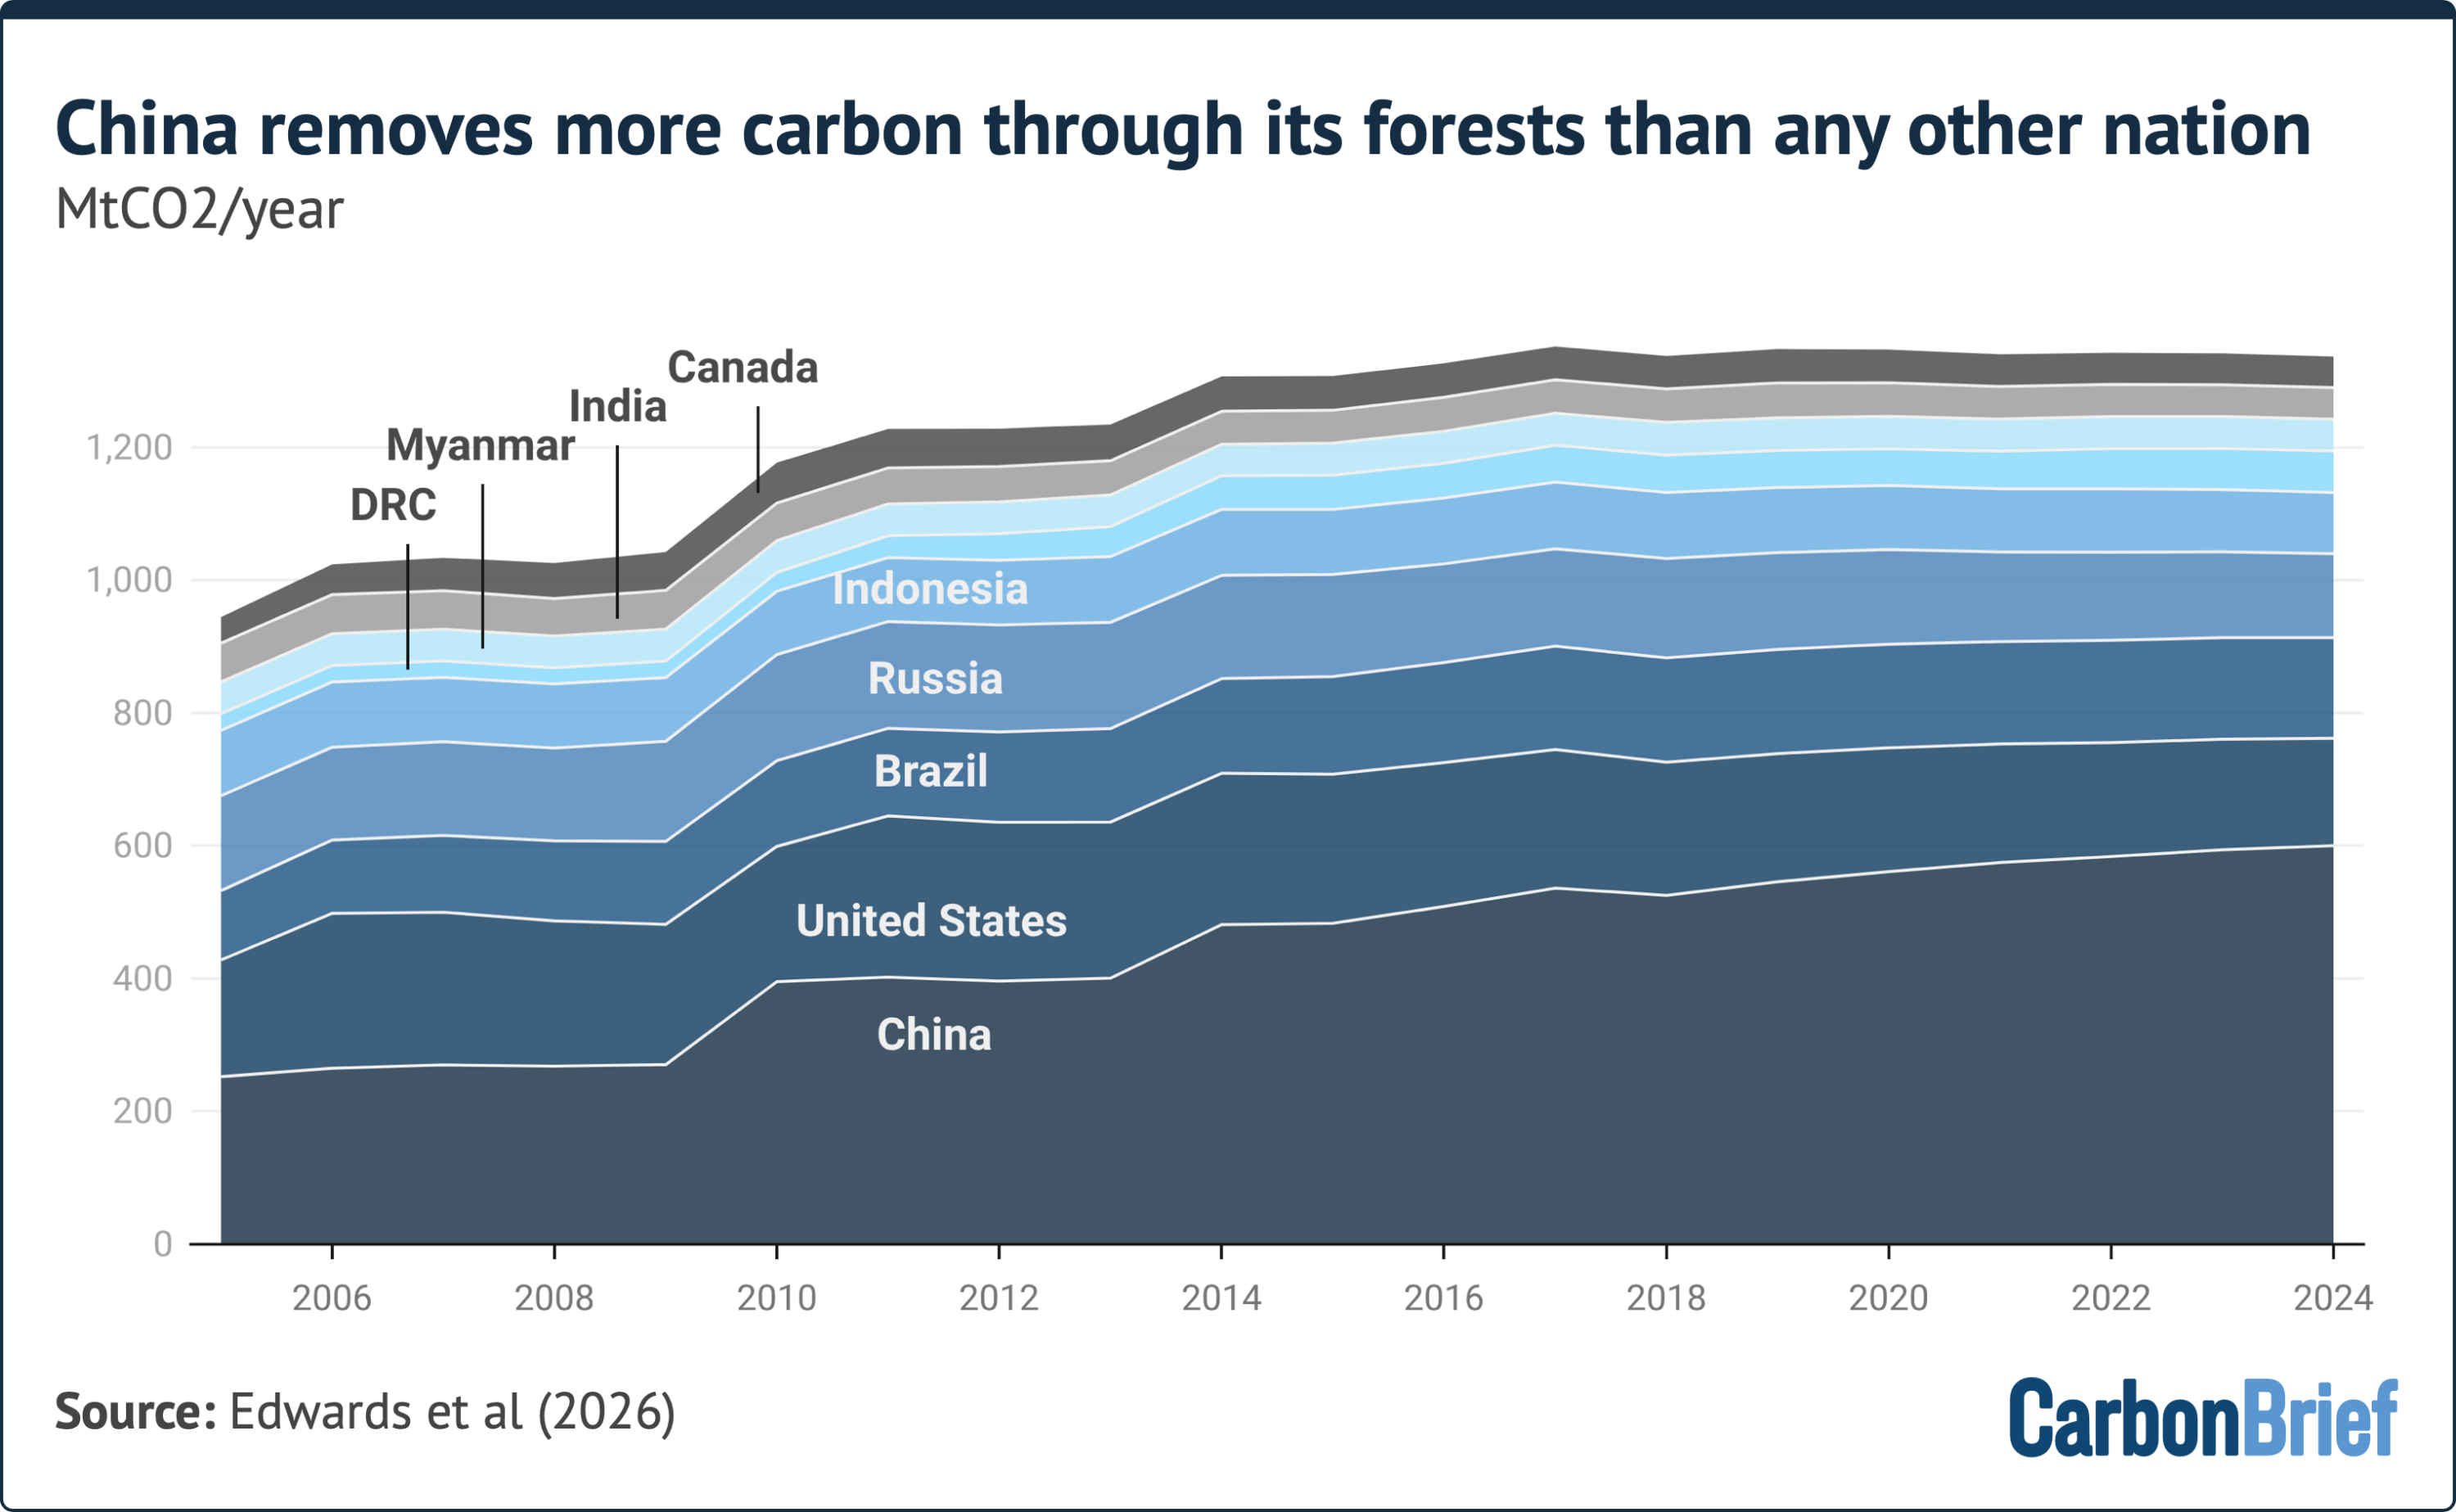
Aggressive Forest Expansion: Extensive tree planting and ecosystem restoration programs in China yielded vast new carbon sinks.
By 2025, with El Niño conditions dissipating and reducing fire risk in vulnerable peatlands, preliminary estimates placed net annual land-use emissions at 4.1 $textGtCO_2$, cementing a 25-year structural trend downward.
Supporting Context & Metrics: Regional Drivers and Modeling Realities
Gross Deforestation vs. Carbon Sequestration
The net figure of 5.0 $textGtCO_2$ per year (recorded over 2015–2024) masks massive gross movements of carbon between the terrestrial biosphere and the atmosphere. Land-use accounting evaluates both gross emissions from land destruction and gross removals from vegetation growth.
       GLOBAL LAND EMISSIONS BALANCE (2015–2024 ANNUAL AVERAGES)

  GROSS EMISSIONS (Deforestation)              [+6.96 GtCO2/yr] ═════════════════╗
                                                                                 ║
  GROSS REMOVALS                                                                 ╠═► NET LAND EMISSIONS
    ├─ Afforestation / Reforestation  [-2.20 GtCO2/yr] ═══════╗                  ║   [~5.00 GtCO2/yr]
    └─ Shifting Cultivation Recovery  [-2.56 GtCO2/yr] ═══════╩► [-4.76 GtCO2/yr]╝
Between 2015 and 2024:
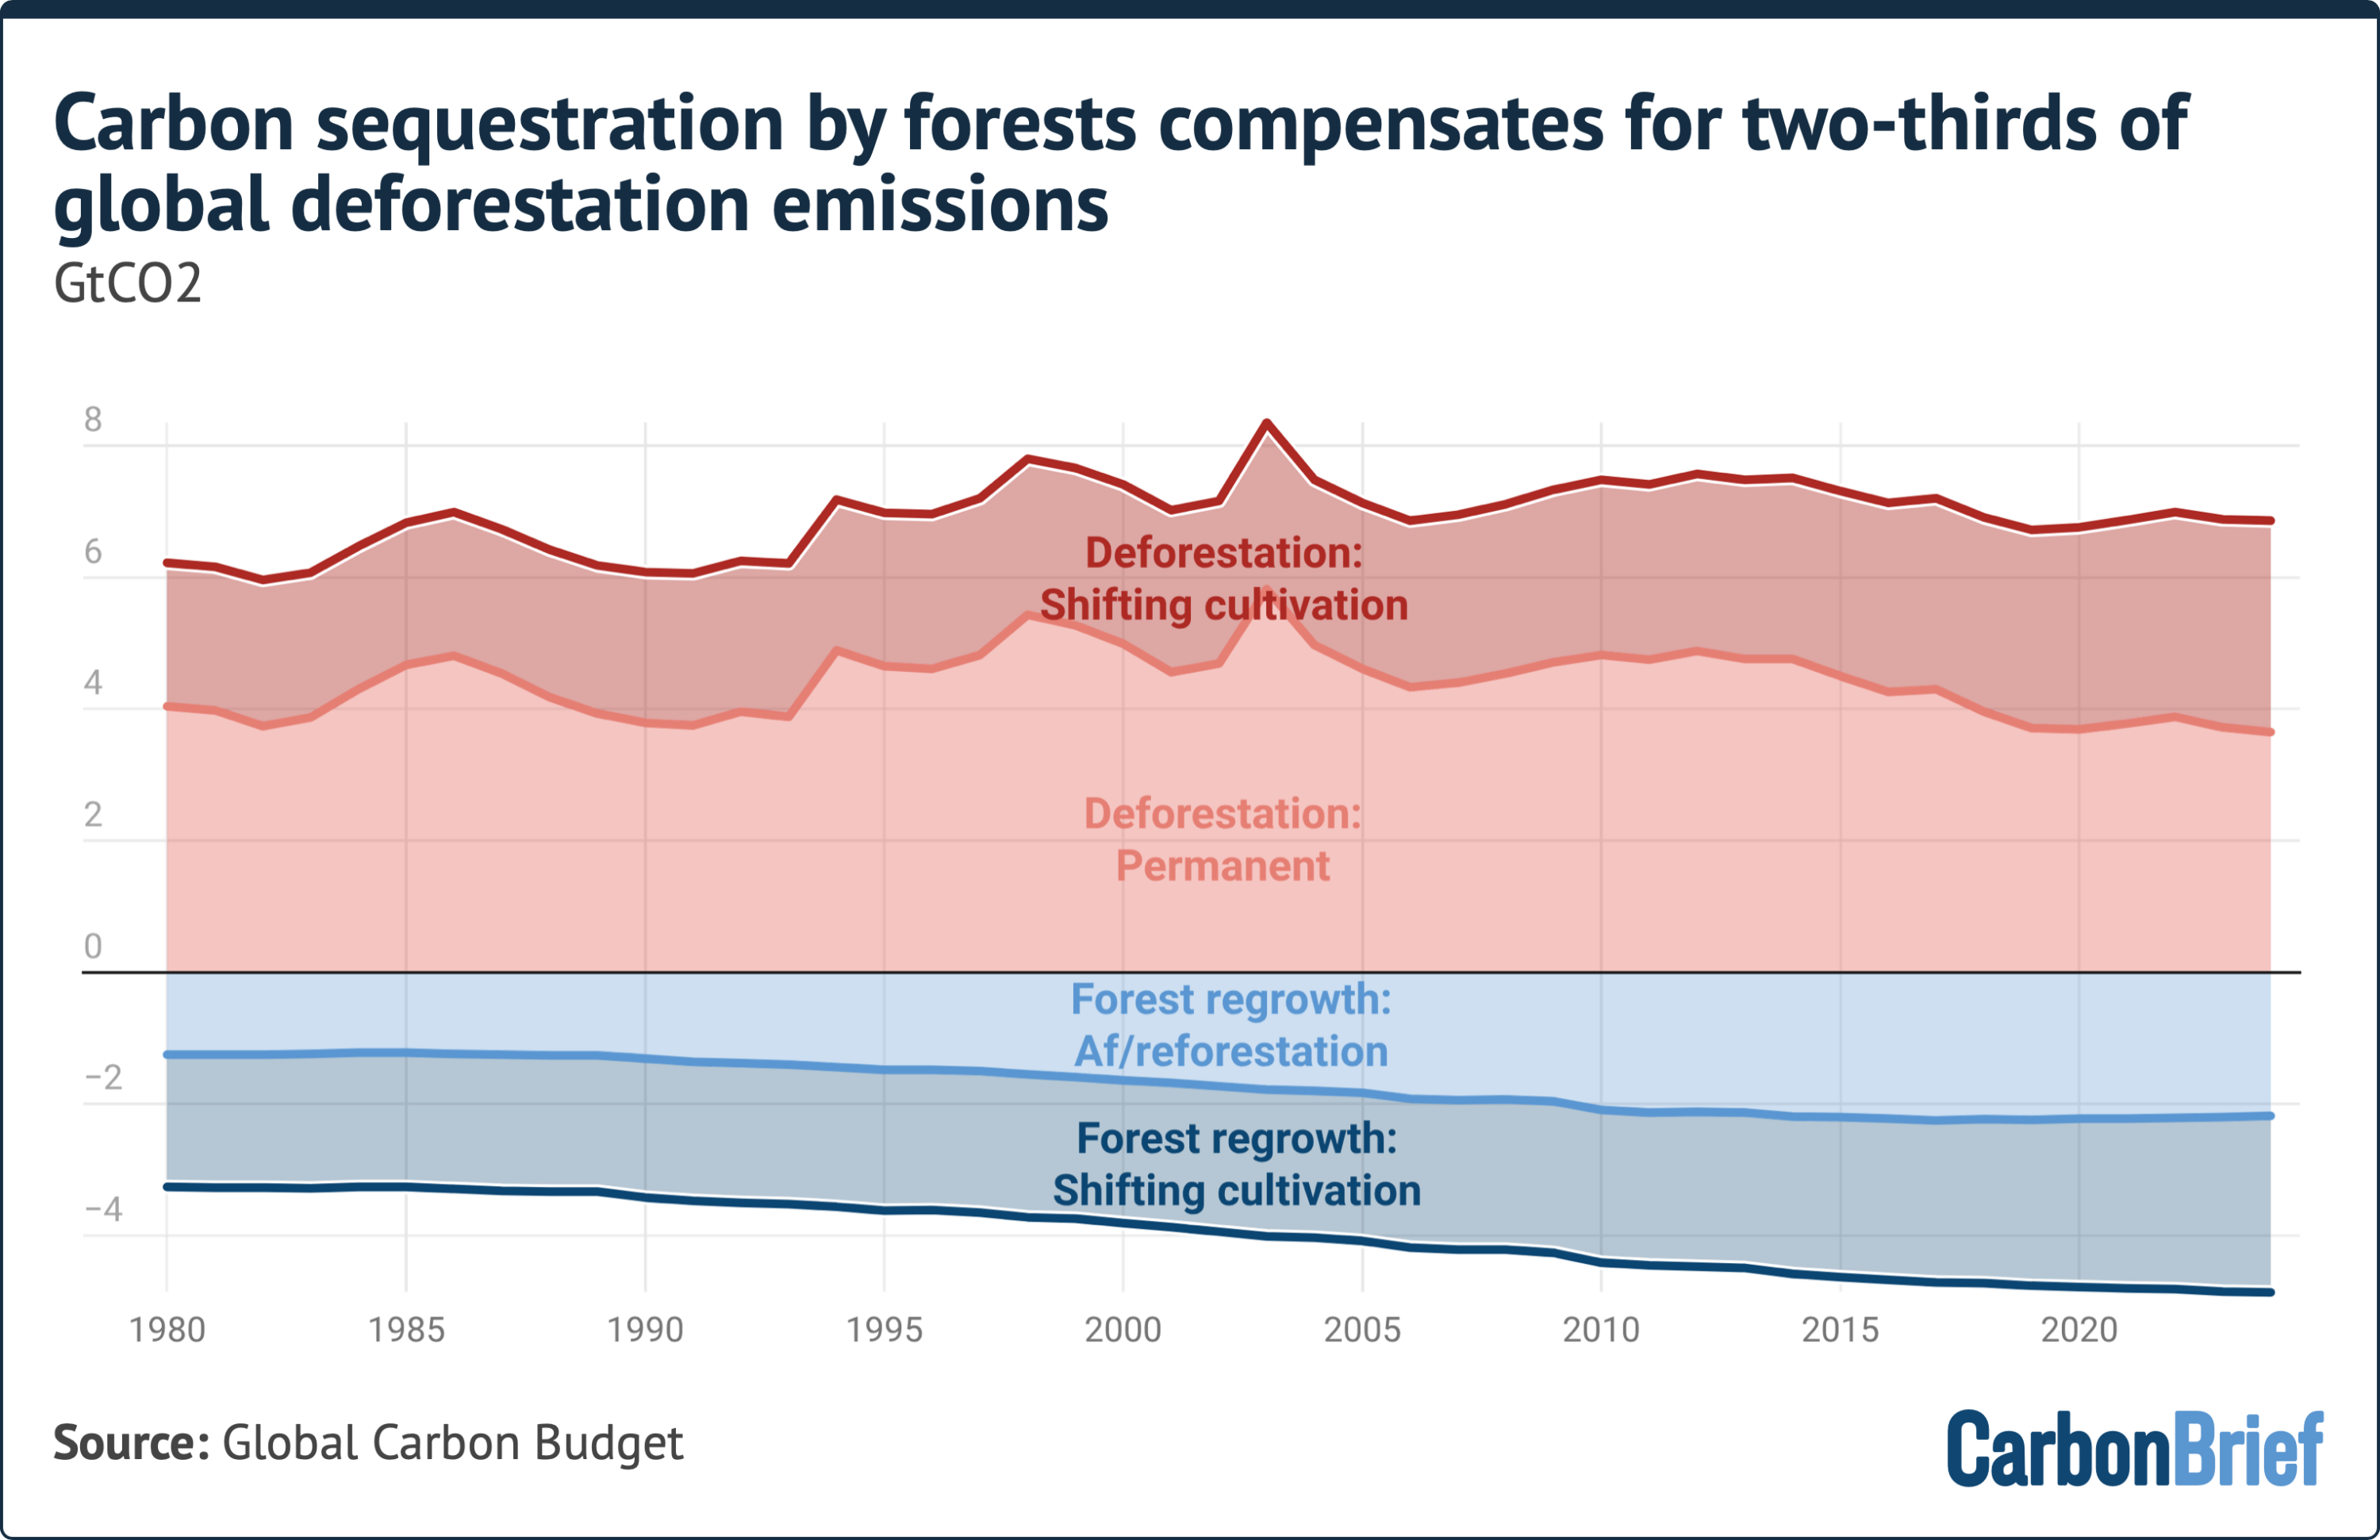
Gross Deforestation Emissions: Averaged 6.96 $textGtCO_2$ annually. Permanent forest clearance for industrial agriculture, mining, and urbanization comprised the vast majority of this total.
Gross Carbon Removals: Averaged 4.76 $textGtCO_2$ per year. Forest regrowth and planted forests compensated for roughly two-thirds (68%) of all emissions generated by deforestation worldwide.
Within total carbon removals, direct human management via afforestation and deliberate reforestation accounted for 2.20 $textGtCO_2$ per year. The remaining 2.56 $textGtCO_2$ per year was sequestered by secondary forest regrowth on land previously cleared for shifting cultivation and subsequently abandoned.
Natural secondary forest recovery on abandoned land
Net Land-Use Change Emissions
$+5.00$
Net global anthropogenic land contribution
Divergent Regional Trajectories
The global downward trend in land emissions is not uniform; it is the net result of sharp regional divergences.
                   REGIONAL LAND-USE PROFILE SUMMARY
  ┌───────────────────────┬───────────────────────────────────────────────┐
  │ Region                │ Key Drivers & Primary Trend                   │
  ├───────────────────────┼───────────────────────────────────────────────┤
  │ Brazil                │ Historical emissions driver; long-term drop   │
  │                       │ driven by Amazon enforcement policies.        │
  ├───────────────────────┼───────────────────────────────────────────────┤
  │ Indonesia             │ Rapid recent drop via massive peatland        │
  │                       │ rewetting & reduced land clearing fires.      │
  ├───────────────────────┼───────────────────────────────────────────────┤
  │ China                 │ World-leading carbon sink creation through    │
  │                       │ decades of large-scale afforestation.         │
  ├───────────────────────┼───────────────────────────────────────────────┤
  │ DRC & Central Africa  │ Rising land emissions; driven by population   │
  │                       │ growth & subsistence smallholder farming.     │
  └───────────────────────┴───────────────────────────────────────────────┘
The Major Emitters: Brazil, Indonesia, and the DRC
Between 2015 and 2024, more than half (57%) of all global net land-use emissions originated from just three tropical nations: Brazil, Indonesia, and the Democratic Republic of the Congo (DRC).
Brazil: Long the world’s largest single source of land-use emissions, Brazil experienced a substantial decline from its early-2000s peak. Despite political fluctuations—where deforestation rates spiked or stabilized depending on executive administration—the long-term structural trajectory has remained downward due to policy frameworks, supply-chain moratoria, and expanding protected zones.
Indonesia: Indonesia driven the sharpest drop in land-use emissions over the past decade. Following catastrophic fires in 2015, Indonesia embarked on an aggressive restoration campaign, rewetting degraded peatlands at an unprecedented scale. Coupled with stricter controls on palm oil expansion and favorable climate cycles, peat emissions dropped significantly.
Democratic Republic of the Congo (DRC): In contrast to Brazil and Indonesia, land-use emissions in the DRC have climbed and remained persistently high over the last two decades. Unlike South America and Southeast Asia, where deforestation is predominantly driven by international commodity exports (such as soy, cattle, and palm oil), forest loss in the Congo Basin is primarily caused by local demographic growth, wood fuel harvesting, and expanding smallholder subsistence agriculture. Consequently, international supply-chain regulations have little leverage in curbing forest loss in this region.
The Net Carbon Sinks: China, the EU, and the US
Offsetting tropical deforestation are expanded forest estates across temperate and high-latitude nations. China, the European Union, and the United States collectively sequestered 1.1 $textGtCO_2$ per year through afforestation and forest management between 2015 and 2024.
China stands out as the world’s primary engine of terrestrial carbon removal. Through multi-decade initiatives like the Three-North Shelter Forest Program (the "Great Green Wall") and national ecological redline policies established in the late 1990s, China successfully transitioned its land surface from a net carbon source to a powerful, persistent net carbon sink.
Methodological Accounting and Uncertainty Ranges
Quantifying land-use emissions is far more complex than tracking fossil fuels, where fuel burn can be calculated directly from economic trade data.
To establish land-use carbon figures, the Global Carbon Budget synthesizes results from three independent bookkeeping models:
BLUE (Bookkeeping of Land-Use Emissions)
OSCAR (Compact Earth system model)
LUCE (Land-Use Change Emissions model)
These models ingest satellite data and ground-level agricultural statistics to isolate human-induced land impacts from natural environmental fluxes (such as ambient $textCO_2$ fertilization or climate-driven vegetation growth).
Because models handle components like wood harvesting, forest degradation, and rotational agricultural cycles differently, the combined land-use estimate carries an uncertainty margin of $pm 2.6text GtCO_2$ per year for the 2015–2024 period. This means that while the downward trajectory is statistically robust, the absolute net emission value in any given year retains a wide margin of uncertainty.
Furthermore, empirical accounting lags behind real-time reporting. While historical data up to 2023 is constructed from full spatial statistics across all three bookkeeping models, figures for 2024 and 2025 rely on short-term proxies—such as real-time fire emissions and satellite deforestation alerts—which carry lower confidence until full datasets can be processed.
Official Statements and Expert Analysis
Leading scientists involved in the Global Carbon Budget emphasize both the success of past policies and the fragility of current trends.
Prof. Pierre Friedlingstein, Director of the Global Carbon Budget office and Chair in Climate System Mathematical Modelling at the University of Exeter, noted that while future trajectories remain subject to political and climate shifts, the long-term data shows genuine progress:
"If you look at the 21st-century trajectory, land-use emissions are going in the right direction. The decline since the 2000s has been primarily driven by a decline in deforestation in Brazil. There was a bit of up and down—mainly due to politics and who was in charge in Brazil—but the long-term trend in Brazil is a decline in deforestation due to forest protection policies.
If you are optimistic, you hope the trend will not reverse and start increasing again. But we don’t know for sure. The assumption, given current land policies across the world, is that deforestation should continue to decline."
Prof. Julia Pongratz, Chair of Physical Geography and Land Use Systems at the University of Munich and a co-author of the report, highlighted the distinct drivers shaping regional performance:
"Brazil is the single most important contributor to the early-2000s global land-use change emissions peak and subsequent decline. Meanwhile, the largest contributor to an acceleration in the decline of global land-use emissions in the past decade has been Indonesia, which has rewetted more peatland area since 2017 alone than Europe in its entire history.
Contrast this with Central Africa: emissions in the DRC have increased, then stayed high in the last two decades. This is partly related to population growth and expanding smallholder and subsistence farming. The picture is different in Brazil and Indonesia, which are much more driven by export; international regulations aiming at curbing deforestation thus have larger effects in these countries."
Future Outlook and Policy Implications
The Vulnerability of Terrestrial Sinks
While the downward trend in land-use emissions offers a rare bright spot in global climate mitigation efforts, scientists warn against complacency. The longevity of this trend faces several systemic risks:
                  RISK MATRIX FOR FUTURE LAND EMISSIONS
  ┌───────────────────────┬───────────────────────────────────────────────┐
  │ Risk Factor           │ Potential Impact                              │
  ├───────────────────────┼───────────────────────────────────────────────┤
  │ Climate Feedbacks     │ Rising temperatures, droughts, and wild fires  │
  │                       │ could convert forest sinks back into sources. │
  ├───────────────────────┼───────────────────────────────────────────────┤
  │ Political Volatility  │ Shifts in domestic policy could rollback      │
  │                       │ environmental protection laws overnight.      │
  ├───────────────────────┼───────────────────────────────────────────────┤
  │ Demographic Pressures │ Increasing subsistence farming demand in      │
  │                       │ developing areas like the Congo Basin.        │
  └───────────────────────┴───────────────────────────────────────────────┘
Climate-Driven Degradation: Rising global temperatures are causing severe droughts, heatwaves, and uncontrolled mega-fires. If natural ecosystems suffer widespread dieback, forests currently acting as carbon sinks could rapidly turn into major carbon sources.
Policy Rollbacks: Land protection relies heavily on political will. Changes in executive leadership in key tropical nations can quickly unwind regulatory enforcement, leading to spikes in land clearing.
Escalating Agricultural Demand: As the global population grows, demand for arable land, timber, and livestock could create market incentives that outpace existing land-use regulations.
Emerging International Mechanisms
To lock in emission reductions and support vulnerable land sinks, international policy and trade frameworks are shifting toward direct financial and regulatory interventions:
International Trade Regulations: Regulations such as the European Union’s Deforestation Regulation (EUDR) seek to leverage consumer market access to ban imports of timber, soy, beef, palm oil, and cocoa linked to land clearance. While effective for export-driven nations like Brazil and Indonesia, complementary mechanisms will be needed for regions driven by domestic subsistence farming.
Innovative Financing Instruments: Emerging mechanisms, such as Brazil’s proposed Tropical Forest Forever Fund (TFFF) presented ahead of international climate negotiations, aim to provide guaranteed annual payouts to developing countries that keep their tropical forests intact.
Peatland Protection Alignment: Expanding Indonesia’s peatland rewetting framework to other global peat basins (such as those in the Congo Basin and the Amazonian lowlands) remains a top priority for preventing catastrophic carbon releases during dry climate cycles.
Conclusion
The structural decline in land-use emissions over the first quarter of the 21st century proves that targeted conservation policies, supply-chain interventions, and large-scale restoration projects can alter global emission trajectories. However, as fossil fuel emissions continue to reach record highs, reductions in land-use emissions cannot bear the burden of stabilizing the global climate alone. Securing a stable climate will require maintaining the downward trend in land emissions while achieving rapid reductions in industrial fossil carbon usage worldwide.