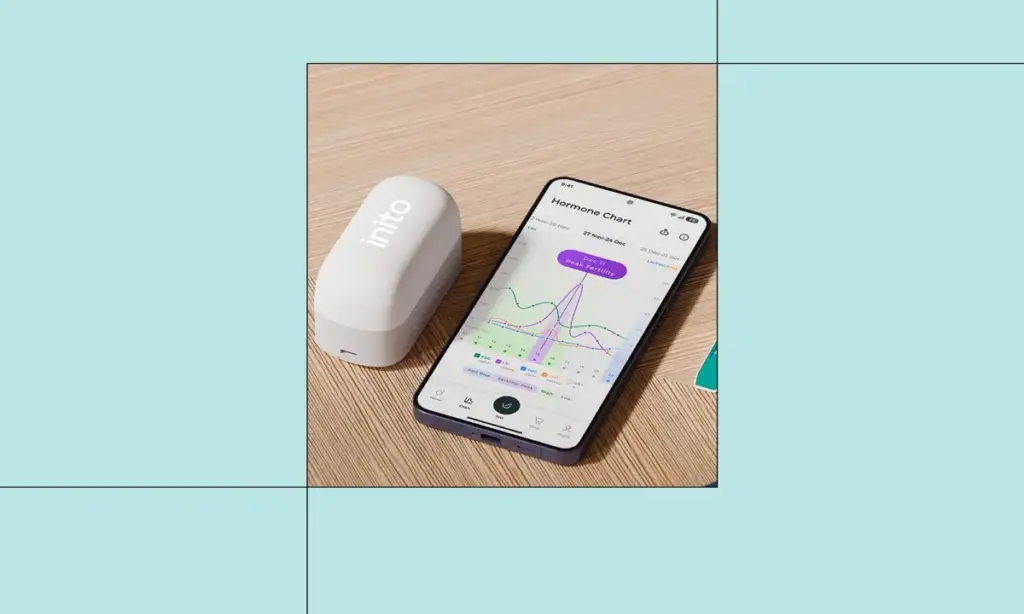
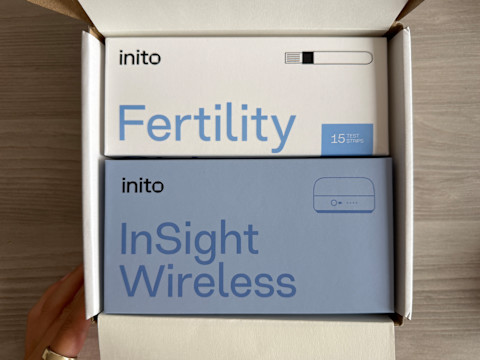
For decades, reproductive health technologies available to the public relied on binary, population-averaged metrics. Standard ovulation predictor kits (OPKs) and basal body temperature (BBT) tracking required users to make critical decisions based on highly subjective visual indicators or retrospective data. However, the intersection of endocrinology and consumer-grade diagnostic hardware has initiated a paradigm shift. Leading this transition is the Inito Fertility Monitor, an at-home diagnostic platform designed to offer quantitative, multi-hormone analysis.
Rather than relying on qualitative "yes/no" results, the platform tracks absolute values of four primary fertility hormones: Estrone-3-Glucuronide (E3G), Luteinizing Hormone (LH), Follicle-Stimulating Hormone (FSH), and Pregnanediol Glucuronide (PdG). By establishing a personalized baseline rather than relying on standard population curves, the technology aims to identify a user’s precise six-day fertile window and confirm successful ovulation.
This investigative report examines the clinical validity of at-home multi-hormone testing, details the biological timeline of tracked cycles, analyzes comparative performance metrics against traditional diagnostics, and gathers clinical insights from reproductive endocrinologists and OB/GYNs on the utility of patient-generated hormone data.
Detailed Chronology: The Evolution of Cycle Diagnostics
To understand the diagnostic value of quantitative home-testing, it is necessary to examine both the historical progression of fertility monitoring and the operational chronology of a tracked menstrual cycle under modern multi-hormone protocols.
[Traditional Calendar Apps]  -->  [Single-Metric OPKs (LH)]  -->  [Retrospective BBT Tracking]  -->  [Modern Quantitative Multi-Hormone Systems (Inito)]
  - Relies on averages              - Predicts, does not confirm     - Confirms after the fact         - Quantitative E3G, LH, FSH, & PdG tracking
  - High error margins              - High false-positive rate       - Easily disrupted by lifestyle    - Real-time clinical baseline comparison
The Diagnostic Timeline of a Tracked Menstrual Cycle
When a user initiates monitoring with a modern quantitative system, the protocol follows a strict chronological sequence designed to mirror clinical serum monitoring:
Phase 1: Baseline Establishment (Cycle Day 6):
Monitoring begins early in the follicular phase. This timing is critical; it allows the algorithm to capture the user’s lowest baseline levels of estrogen and LH before the dominant follicle begins its rapid growth phase. This baseline serves as the control against which all subsequent hormonal surges are calculated.
Phase 2: Follicular Rise & Estrogen (E3G) Escalation:
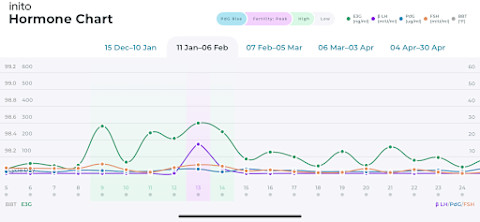
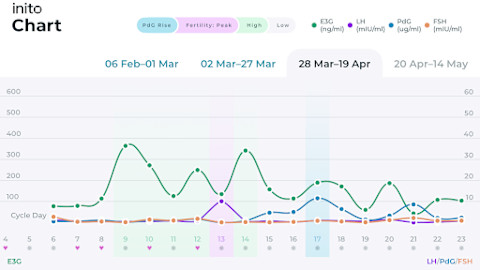
As the dominant follicle matures, it secretes increasing amounts of estradiol, metabolized in urine as E3G. The detection of this upward trajectory signals the opening of the six-day fertile window, alerting the user to "High Fertility" days prior to the physical release of the oocyte.
Phase 3: The Gonadotropin Surge (LH and FSH):
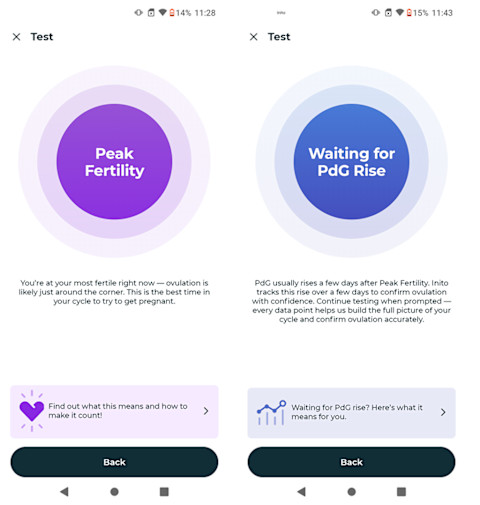
In response to sustained high levels of estrogen, the anterior pituitary gland releases a surge of Luteinizing Hormone (LH) and Follicle-Stimulating Hormone (FSH). The quantitative capture of the LH peak identifies "Peak Fertility." Unlike threshold-based tests, measuring the actual concentration prevents false positives caused by minor, non-ovulatory LH fluctuations.
Phase 4: Luteal Transition and Progesterone (PdG) Confirmation:
Following follicle rupture, the remaining luteal cells luteinize to form the corpus luteum, which secretes progesterone (metabolized as PdG). Traditional OPKs stop tracking at the LH surge, leaving ovulation unconfirmed. Quantitative systems continue tracking post-peak to identify a sustained rise in PdG levels, confirming successful ovulation and verifying luteal phase adequacy.
Supporting Context & Metrics: The Science of Spectral Mapping
At the core of the system’s diagnostic accuracy is Spectral Mapping technology. Traditional lateral flow assays (standard paper test strips) are typically read by the human eye or basic optical sensors that evaluate line darkness to determine a threshold. This approach introduces significant margin for error due to variations in ambient lighting, strip hydration, and reader subjectivity.
Spectral Mapping bypasses these limitations by employing dual-mode detection: visual colorimetric imaging paired with fluorescence signaling. The reader scans the lateral flow strip at high resolution, capturing up to 100 times more signal data than a standard digital reader. By segregating the test strip into distinct, non-reactive channels for each hormone, the system prevents cross-reactivity and adjusts in real time for environmental variables such as ambient humidity, dust, and light fluctuations.
Clinical Metrics and Validation Data
The clinical efficacy of this methodology is supported by peer-reviewed literature:
Serum Correlation: A comparative study published in Human Reproduction Open evaluated urinary hormone tracking against daily blood serum draws. The results demonstrated a 95% correlation between urinary E3G, LH, and PdG trends and their corresponding serum concentrations. This indicates that home-based urinary trends are highly representative of clinical venous blood patterns.
Ovulation Confirmation Accuracy: Research published in Nature’s Scientific Reports confirmed that tracking urinary PdG via this quantitative method achieves a 92.2% accuracy rate in confirming ovulation, offering an alternative to retrospective progesterone blood draws.
System Precision: Controlled laboratory evaluations measuring inter-device and inter-lot variability show that the spectral mapping reader maintains the lowest coefficient of variation (CV) among leading over-the-counter fertility monitors, validating its classification as "system-level precise."
Low; prone to false positives from elevated baseline LH
Low; easily obscured by erratic cycle lengths
Low; difficult to standardize
Data Portability
Digital charts exportable for clinical review
None or manual photo logs
Manual logging of temperature curves
Manual, subjective journal entries
Official Statements: Clinical Perspectives on Patient-Generated Data
To evaluate how quantitative hormone tracking impacts clinical practice, we interviewed reproductive endocrinologists and OB/GYNs. The consensus indicates that structured home-monitoring data is shifting how clinicians conduct initial fertility assessments.
Shifting the Patient-Clinician Dynamic
Historically, patients arrived at fertility clinics with qualitative calendar data or bags of physical OPK strips. Dr. Sasha Hakman, M.D., a double board-certified OB/GYN and Reproductive Endocrinology and Infertility (REI) specialist, emphasizes the clinical value of structured digital charting:
"The patients who come in with quantitative hormone data have fundamentally different appointments than those who come in with just a positive OPK and a date. They know their cycle; they can tell me when something felt off. That kind of informed patient leads to faster, more precise clinical decisions and better outcomes."
This sentiment is echoed by Dr. Susan Nasab, M.D., also a reproductive endocrinologist, who highlights the diagnostic utility of tracking multiple hormones simultaneously:
"Having a full-cycle view is particularly important in cases of PCOS, ovulatory dysfunction, premature ovarian insufficiency, and early perimenopause. Detailed hormonal history allows us as REI physicians to make more informed decisions and personalize treatment more effectively."
Overcoming the Pitfalls of Single-Biomarker Tracking
Standard OPKs assume all users conform to a textbook hormonal profile. However, endocrinological research reveals that only 42% of women experience the classic single, sharp LH surge. The remaining 58% display irregular patterns, including multiple peaks, plateau surges, or low-amplitude rises.
Endocrinological Reality:
[Classic Single LH Surge] --------> 42% of women (OPKs work well)
[Atypical/Irregular LH Surges] ---> 58% of women (OPKs fail/misfire)
Dr. Lora Shahine, M.D., a double board-certified OB/GYN and reproductive endocrinologist, explains how single-threshold tests fail patients with complex endocrine profiles, such as Polycystic Ovary Syndrome (PCOS, increasingly referred to in clinical literature as Procreative Metabolic Ovulatory Syndrome, or PMOS):
"Many people with PCOS have an elevated LH:FSH ratio, which is one reason single-threshold ovulation predictor kits can misfire. Looking at the whole sequence instead—does estrogen rise before the LH surge? Is there a real LH peak? Does PdG rise after?—often gives a much clearer picture than relying on LH alone."
Dr. Shahine also notes the clinical limitations of single-point serum progesterone testing:
"Progesterone secretion is naturally pulsatile. A single blood test represents one moment in time, whereas serial PdG measurements allow you to look at the full picture over several days."
Real-World Diagnostic Case Studies
The Double LH Surge (Atypical Ovulation): User Bailey Blackburn experienced regular menses but unpredictable ovulation. Quantitative monitoring revealed she regularly experienced two distinct LH surges per month. Standard OPKs would have registered the first surge as the ovulation window, but the multi-hormone monitor tracked the subsequent PdG rise only after the second surge, allowing for successful conception.
Identifying Anovulatory Cycles: User Brooke Gresock utilized the monitor after several unsuccessful cycles. The resulting charts demonstrated a distinct lack of PdG elevation post-LH surge, indicating anovulatory cycles. This data allowed her gynecologist to initiate targeted ovulation induction therapy, confirming success on the first medicated cycle.
Luteal Phase Deficiencies: For Katie McCormick, a decade of unexplained infertility was resolved when quantitative charting indicated that while ovulation was occurring, her PdG levels remained low and her luteal phase was consistently shorter than the clinically viable 11-day threshold. This pattern guided her OB/GYN to prescribe targeted progesterone support.
Future Outlook: Personalized Medicine and the Femtech Frontier
The integration of quantitative diagnostic hardware into the consumer market represents a step toward personalized, preventative endocrinology. As machine learning algorithms analyze millions of discrete hormone data points, predictive models will continue to improve. This evolution has broader implications for several areas of reproductive medicine:
[Democratized Home Diagnostics]
       │
       ├─► Earlier Detection of Endocrine Pathology (PMOS/PCOS, POI)
       ├─► Reduced Time-to-Treatment for Infertility Cases
       └─► Transition from Population-Average Models to Personalized Baselines
The Transition to Personalized Baselines
Rather than evaluating health through binary thresholds designed for the "average" patient, diagnostic platforms will increasingly define wellness relative to an individual’s unique baseline. This shift is crucial for patients managing complex endocrine conditions like PMOS, where standard reference ranges often fail to provide actionable insights.
Accelerating Clinical Interventions
By shortening the diagnostic runway, home-use quantitative monitors can reduce the time-to-treatment for infertility cases. Patients can present their clinicians with multiple cycles of detailed, multi-biomarker data at their first appointment, bypassing the standard recommendation to wait 6 to 12 months before seeking specialist care.
Balancing Information and Patient Anxiety
While democratized access to personal health data is empowering, clinicians caution that daily monitoring can increase anxiety for some patients. Future software updates and medical guidelines will likely focus on optimizing testing schedules to provide maximum diagnostic utility with minimal psychological stress.
Ultimately, the transition from qualitative guessing to quantitative analysis bridges the gap between home-based tracking and clinical endocrinology. By providing patients and physicians with highly accurate, longitudinal hormone data, these systems are redefining the standard of care in reproductive health.