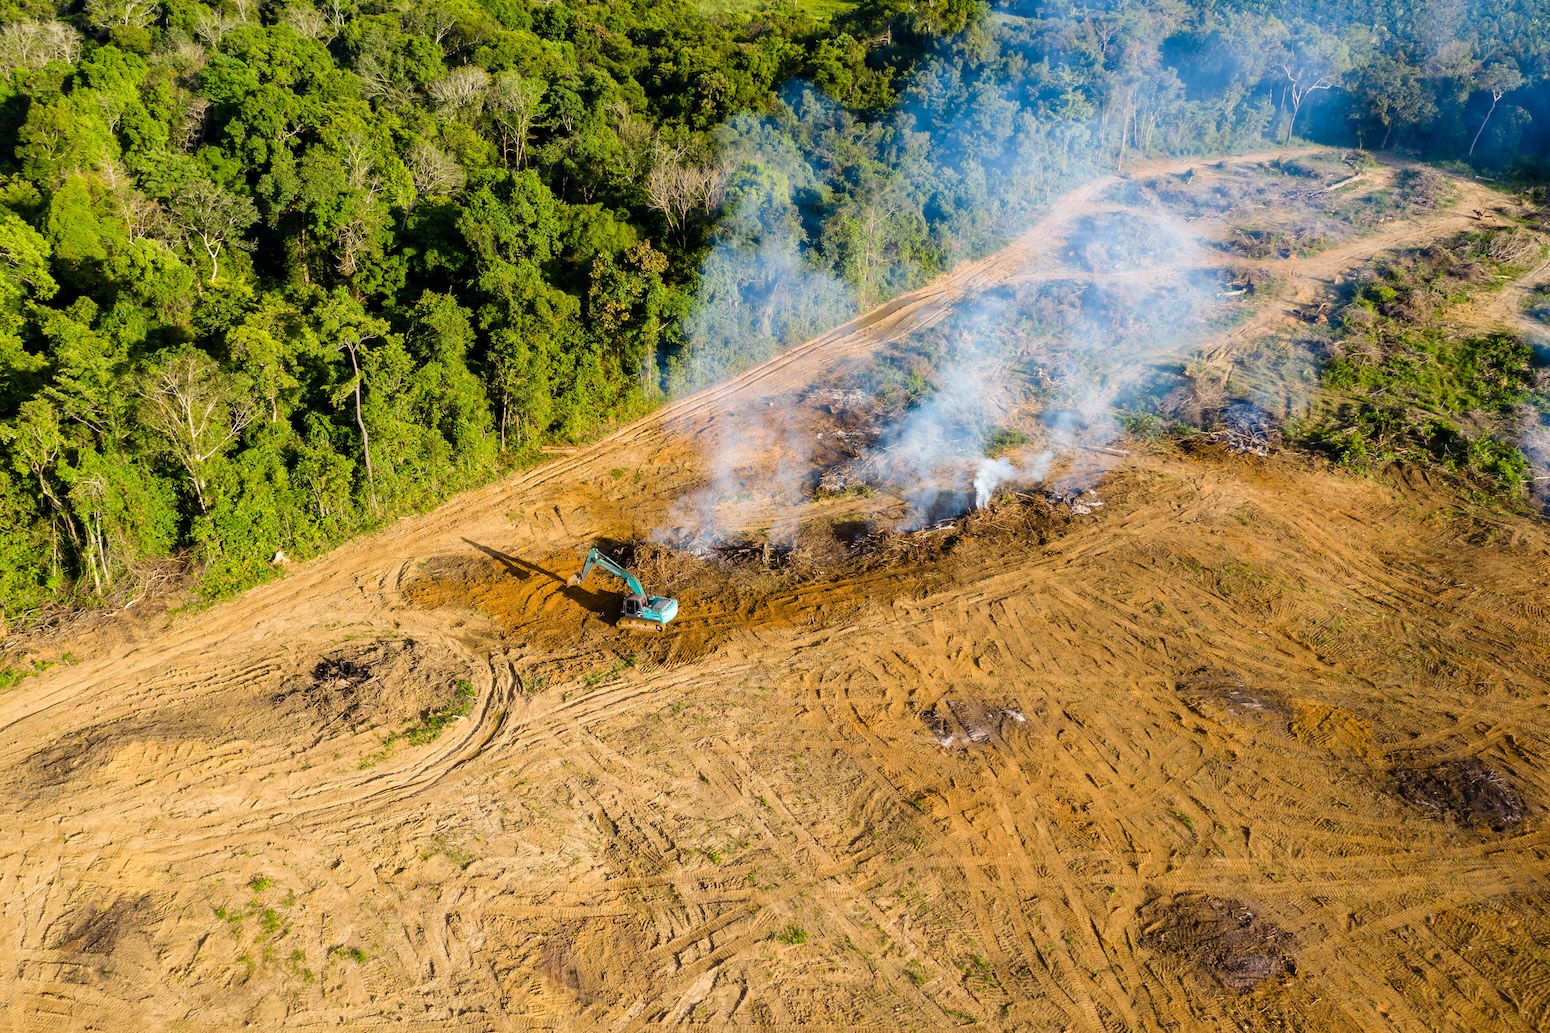
In a significant yet under-reported shift in global climate dynamics, carbon dioxide emissions from land-use change—encompassing deforestation, forest degradation, and peatland destruction—have experienced a sustained and statistically significant decline over the first quarter of the 21st century.
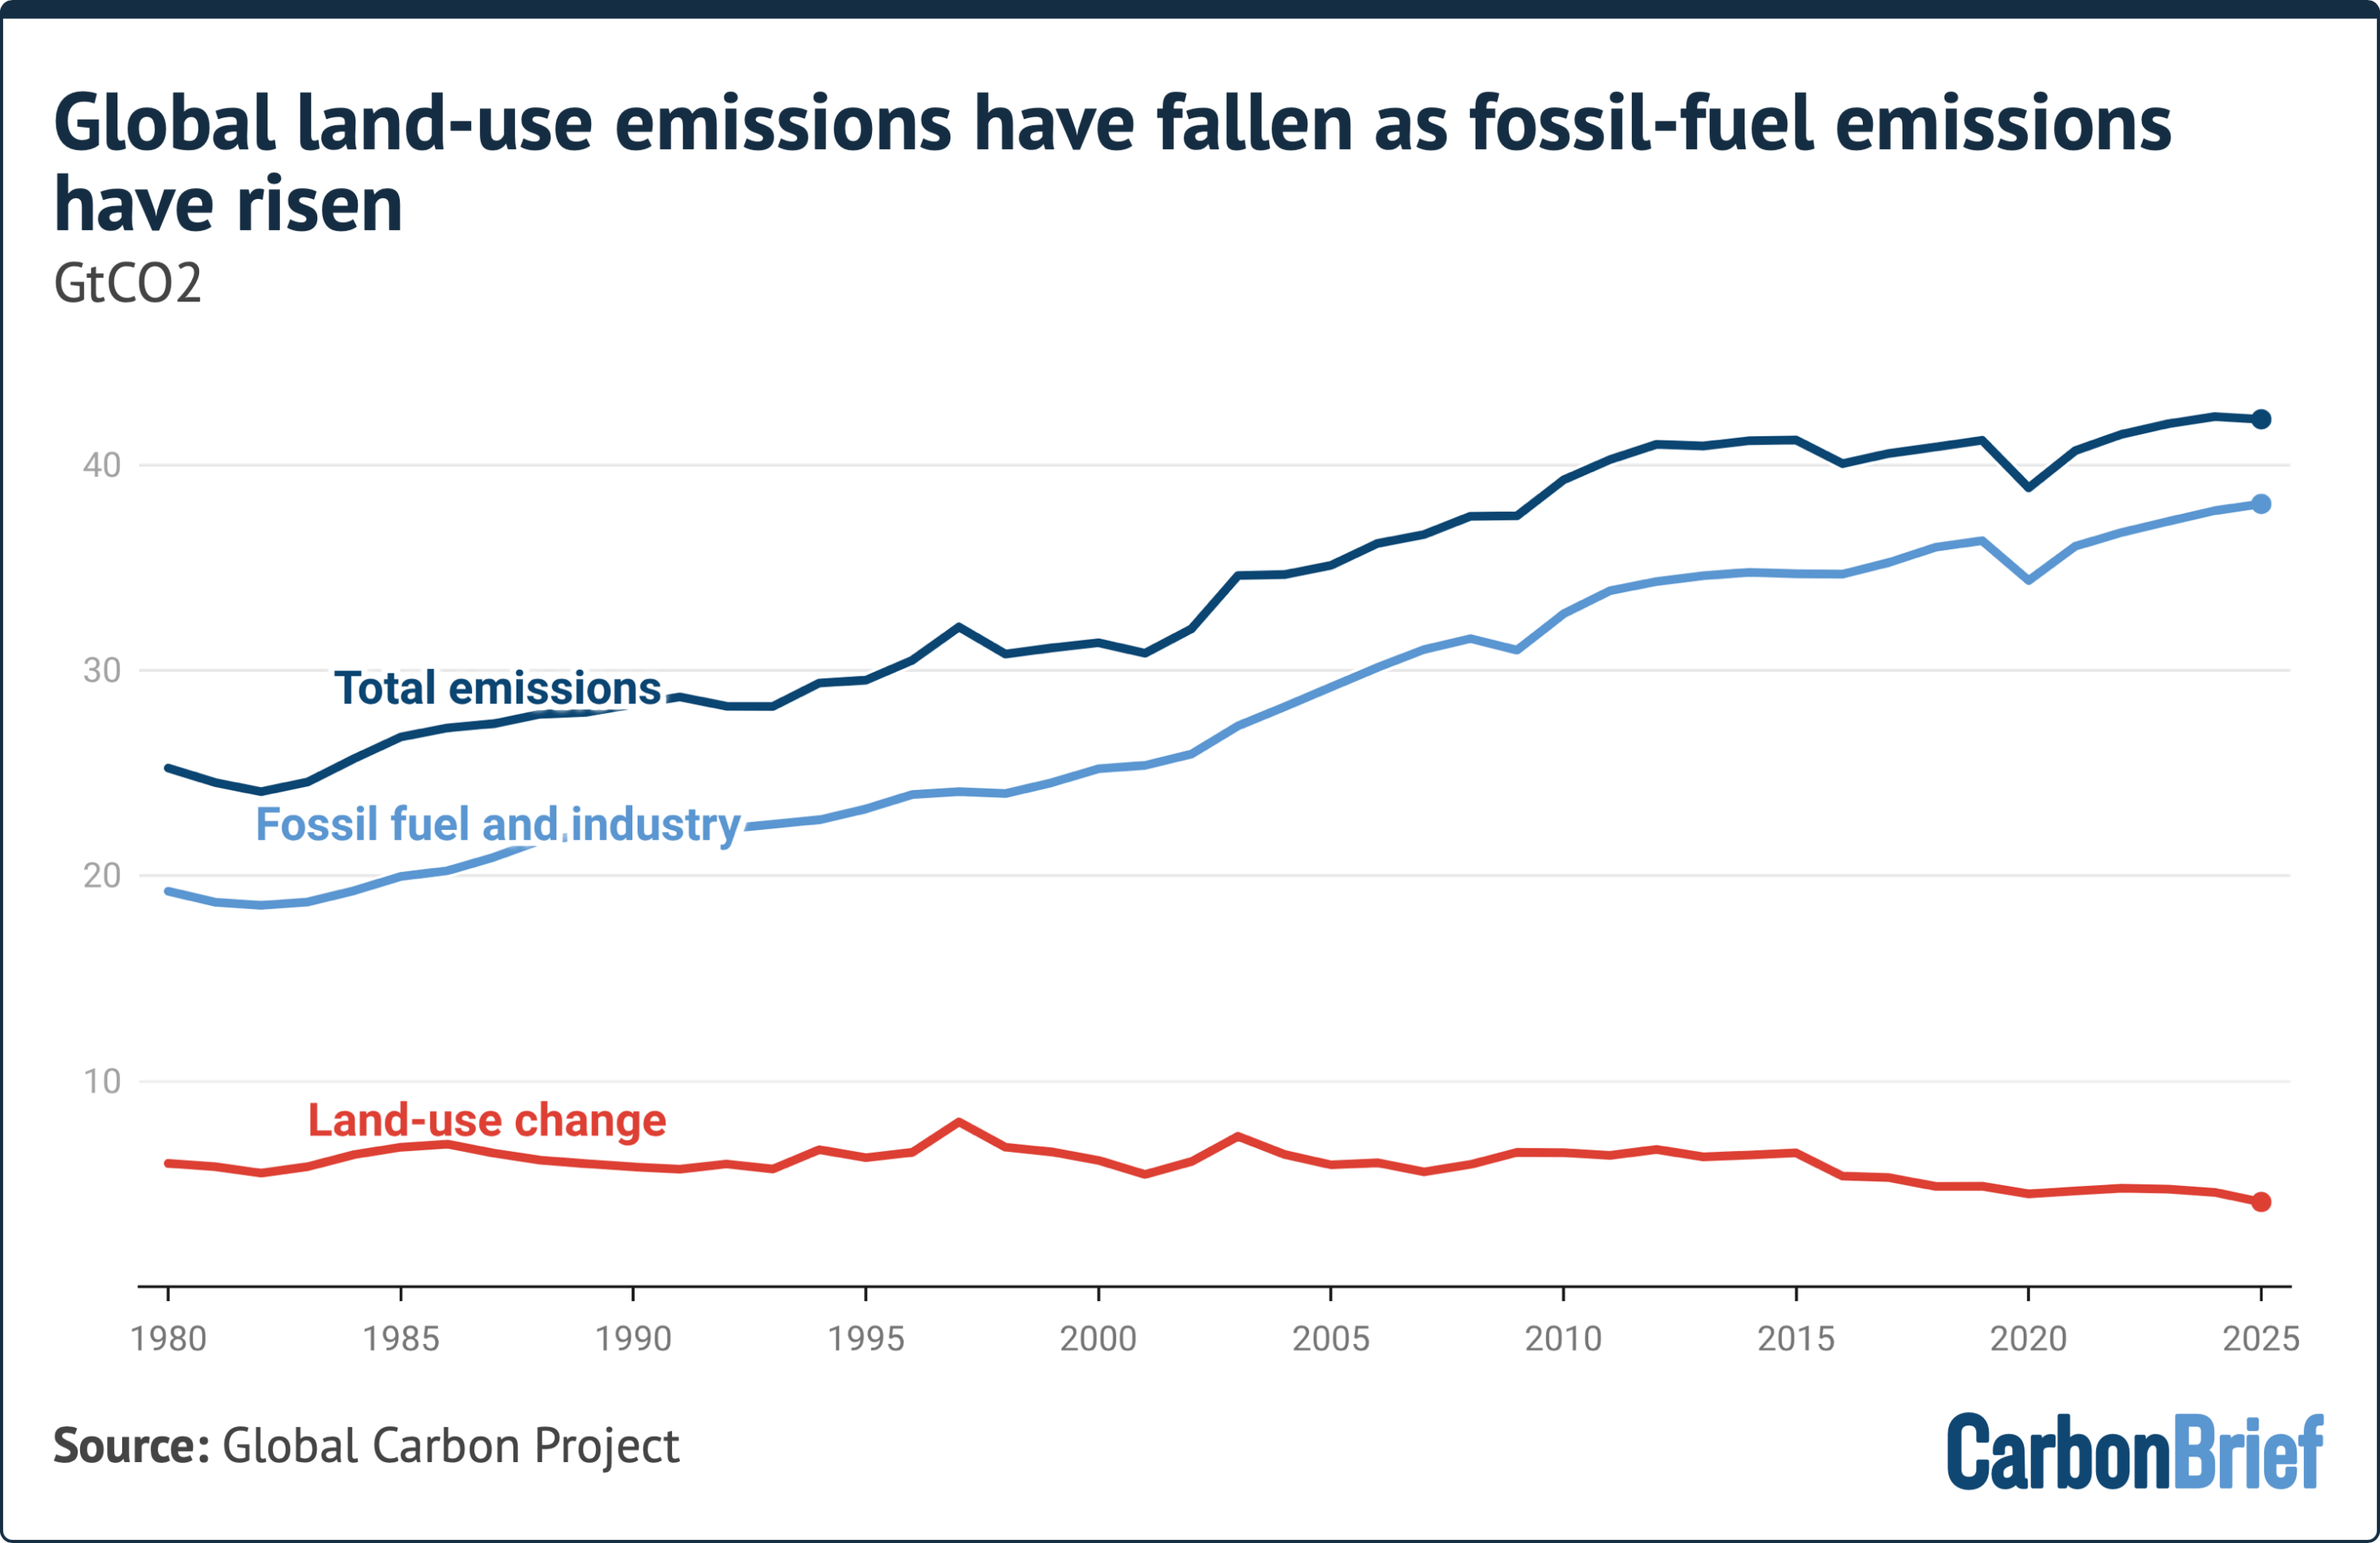
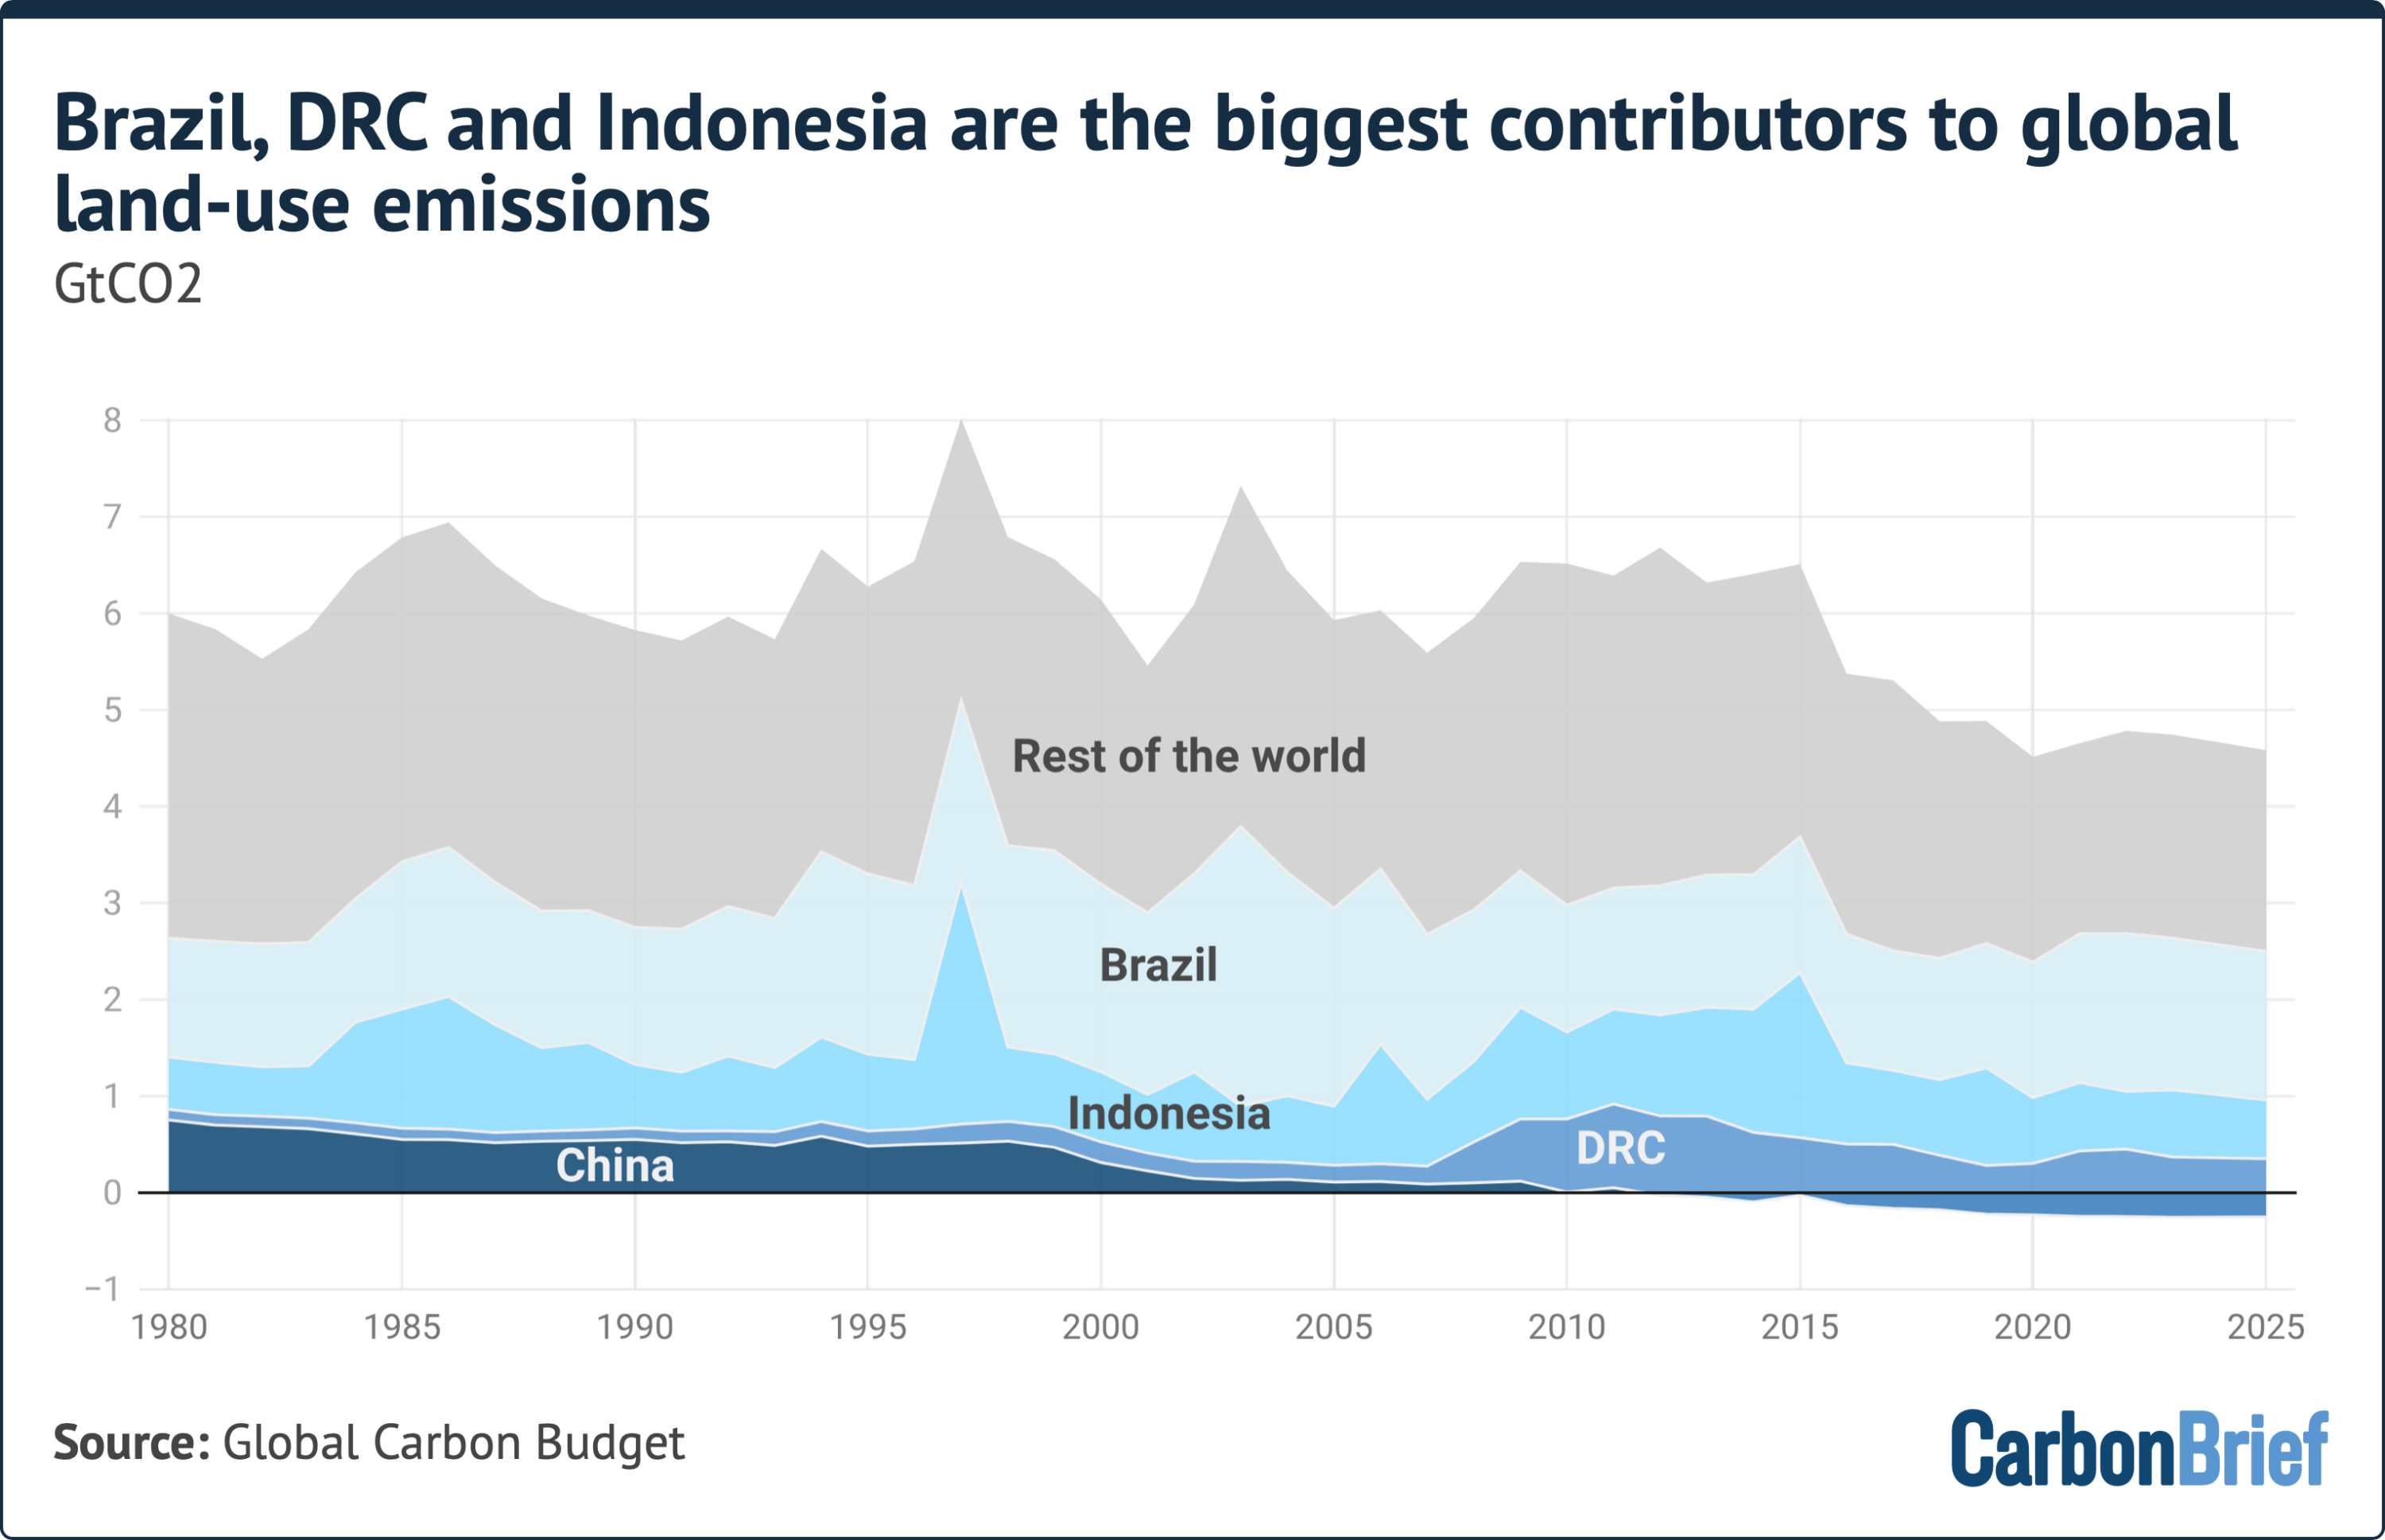
According to findings formally published in Earth System Science Data by the Global Carbon Budget team, net land-use emissions have fallen sharply since their late-1990s peak, with the rate of reduction accelerating markedly after 2015. Analysis by climate scientists Dr. Zeke Hausfather and Professor Pierre Friedlingstein reveals that global net land-use emissions in 2025 dropped to approximately 4.1 gigatonnes of CO2 (GtCO2)—a reduction of roughly 32% compared to their annual average throughout the 2000s.
This downward trajectory stands in stark contrast to global emissions from fossil fuels and cement production, which have continued their upward march, hitting a record high of 38.1 GtCO2 in 2025. While fossil fuel combustion remains the primary engine of global warming, the structural decline in emissions from Land Use, Land-Use Change, and Forestry (LULUCF) has played a crucial, albeit insufficient, role in tempering the overall expansion of human-caused greenhouse gases.
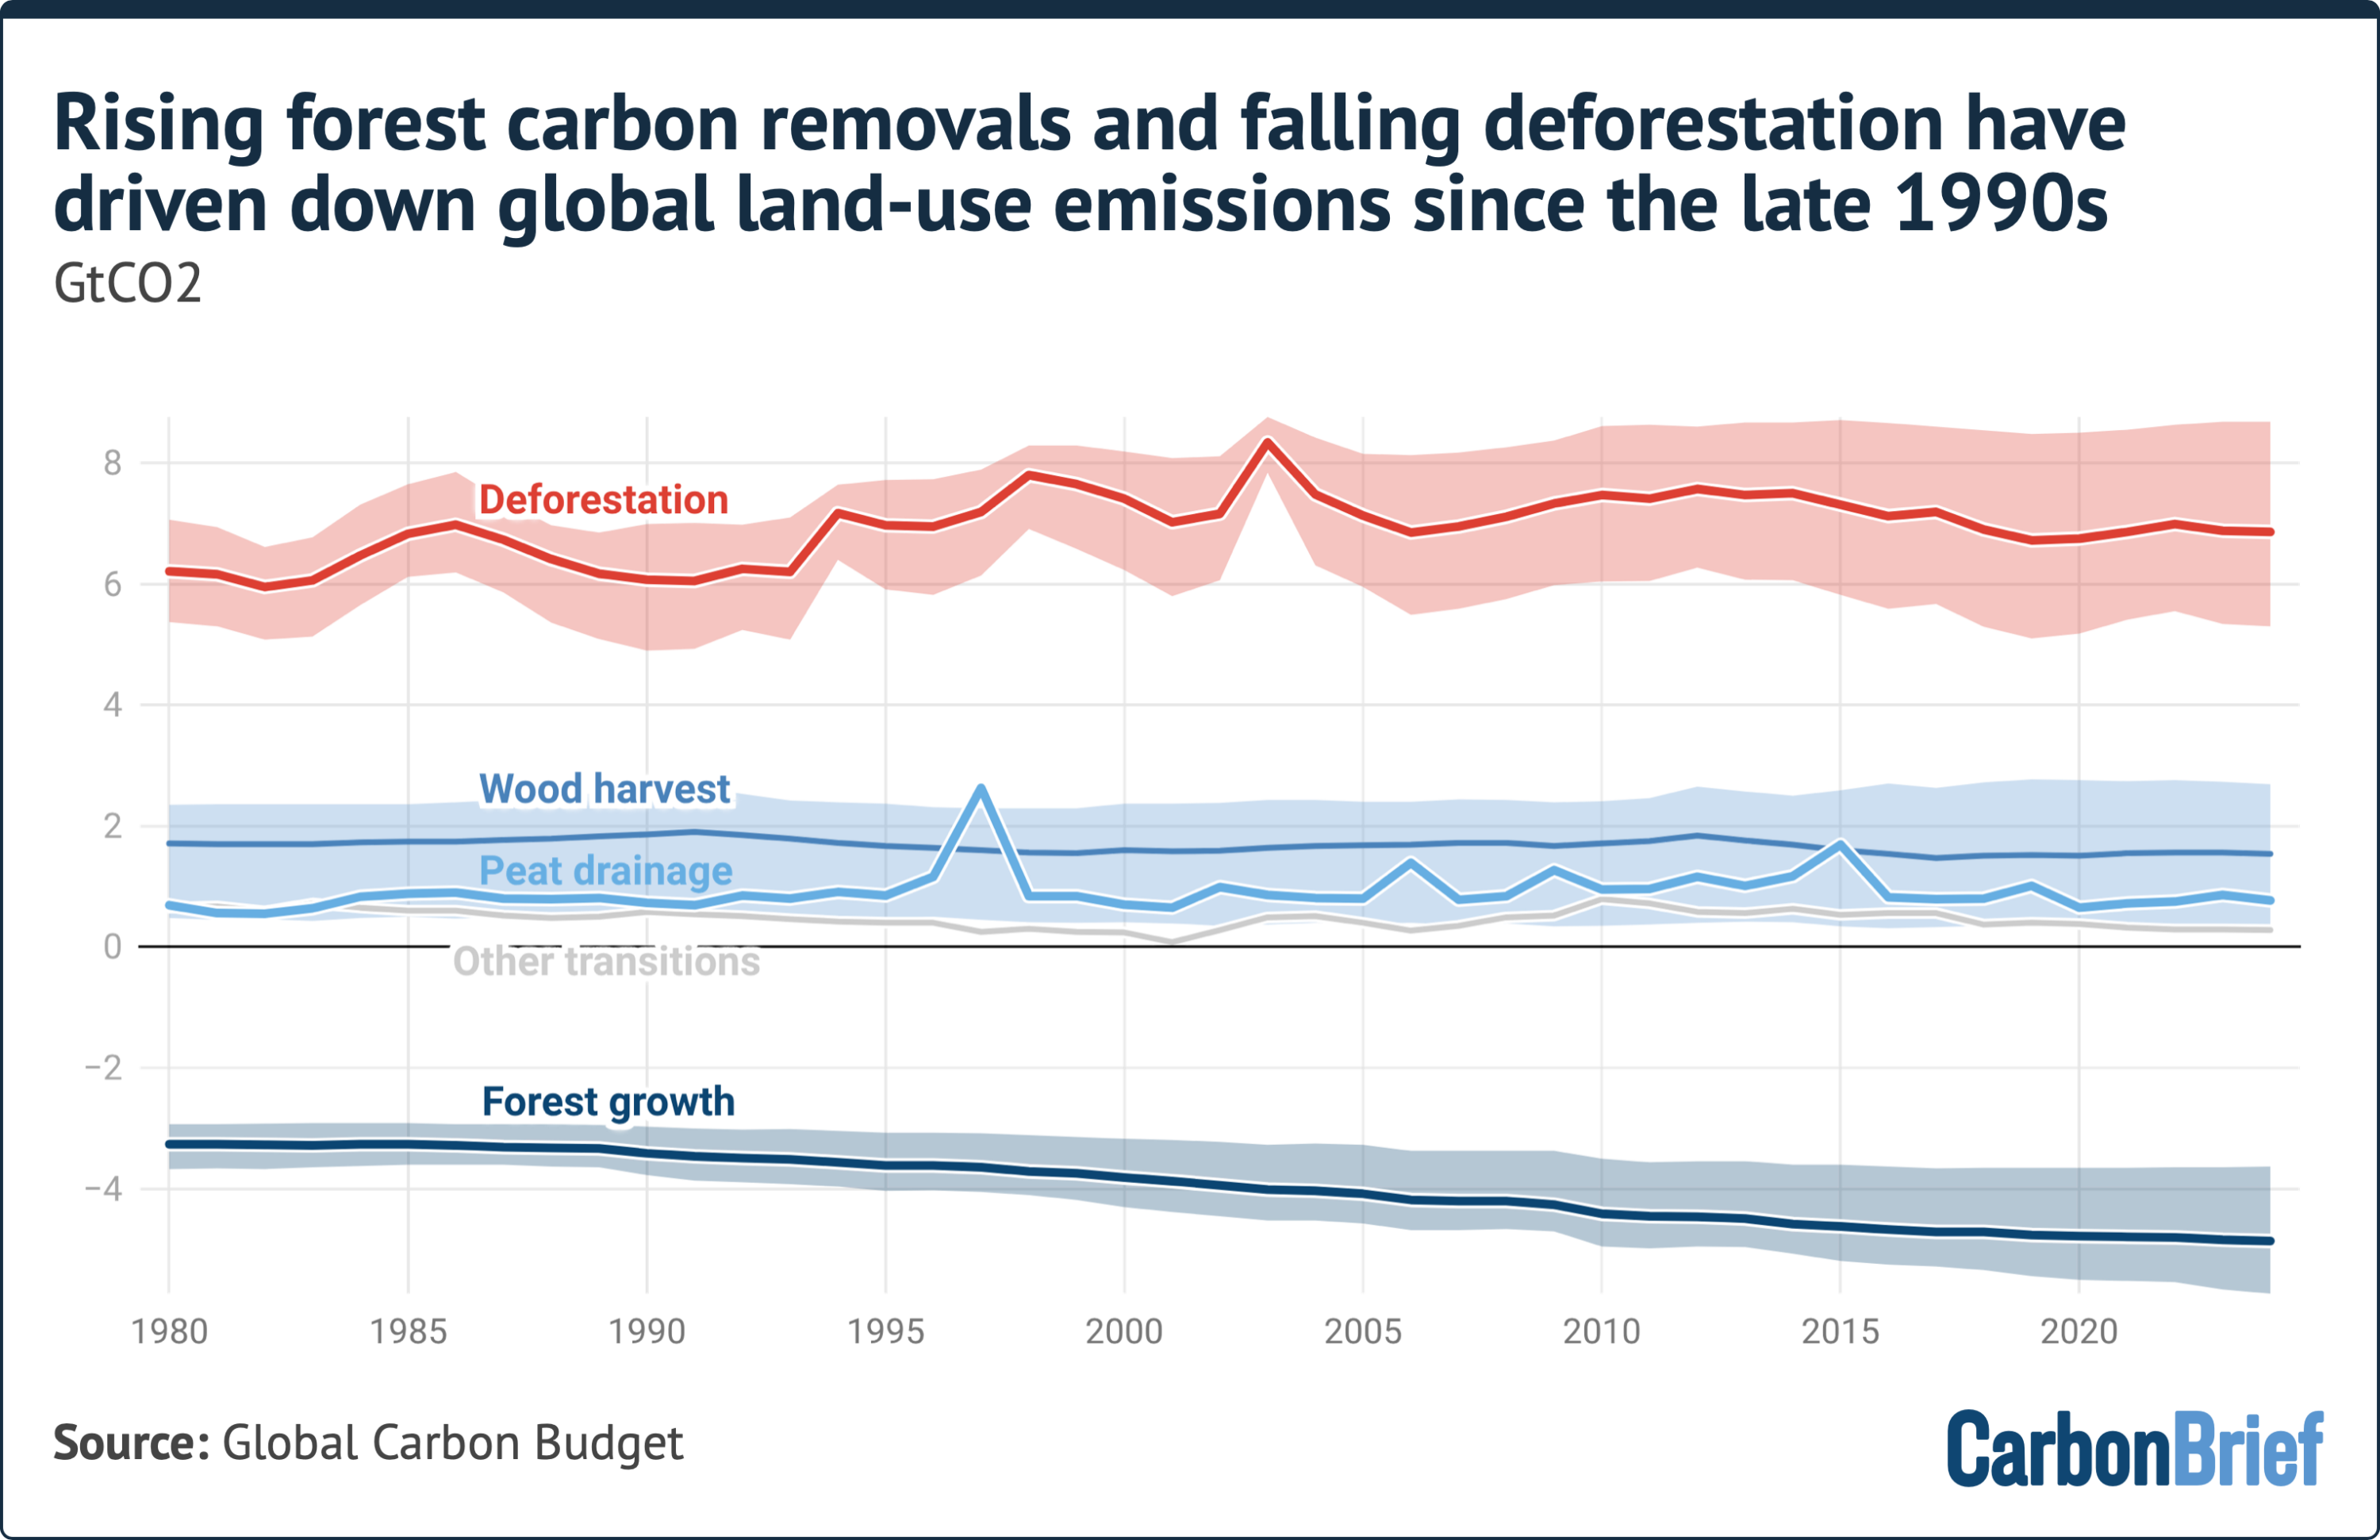
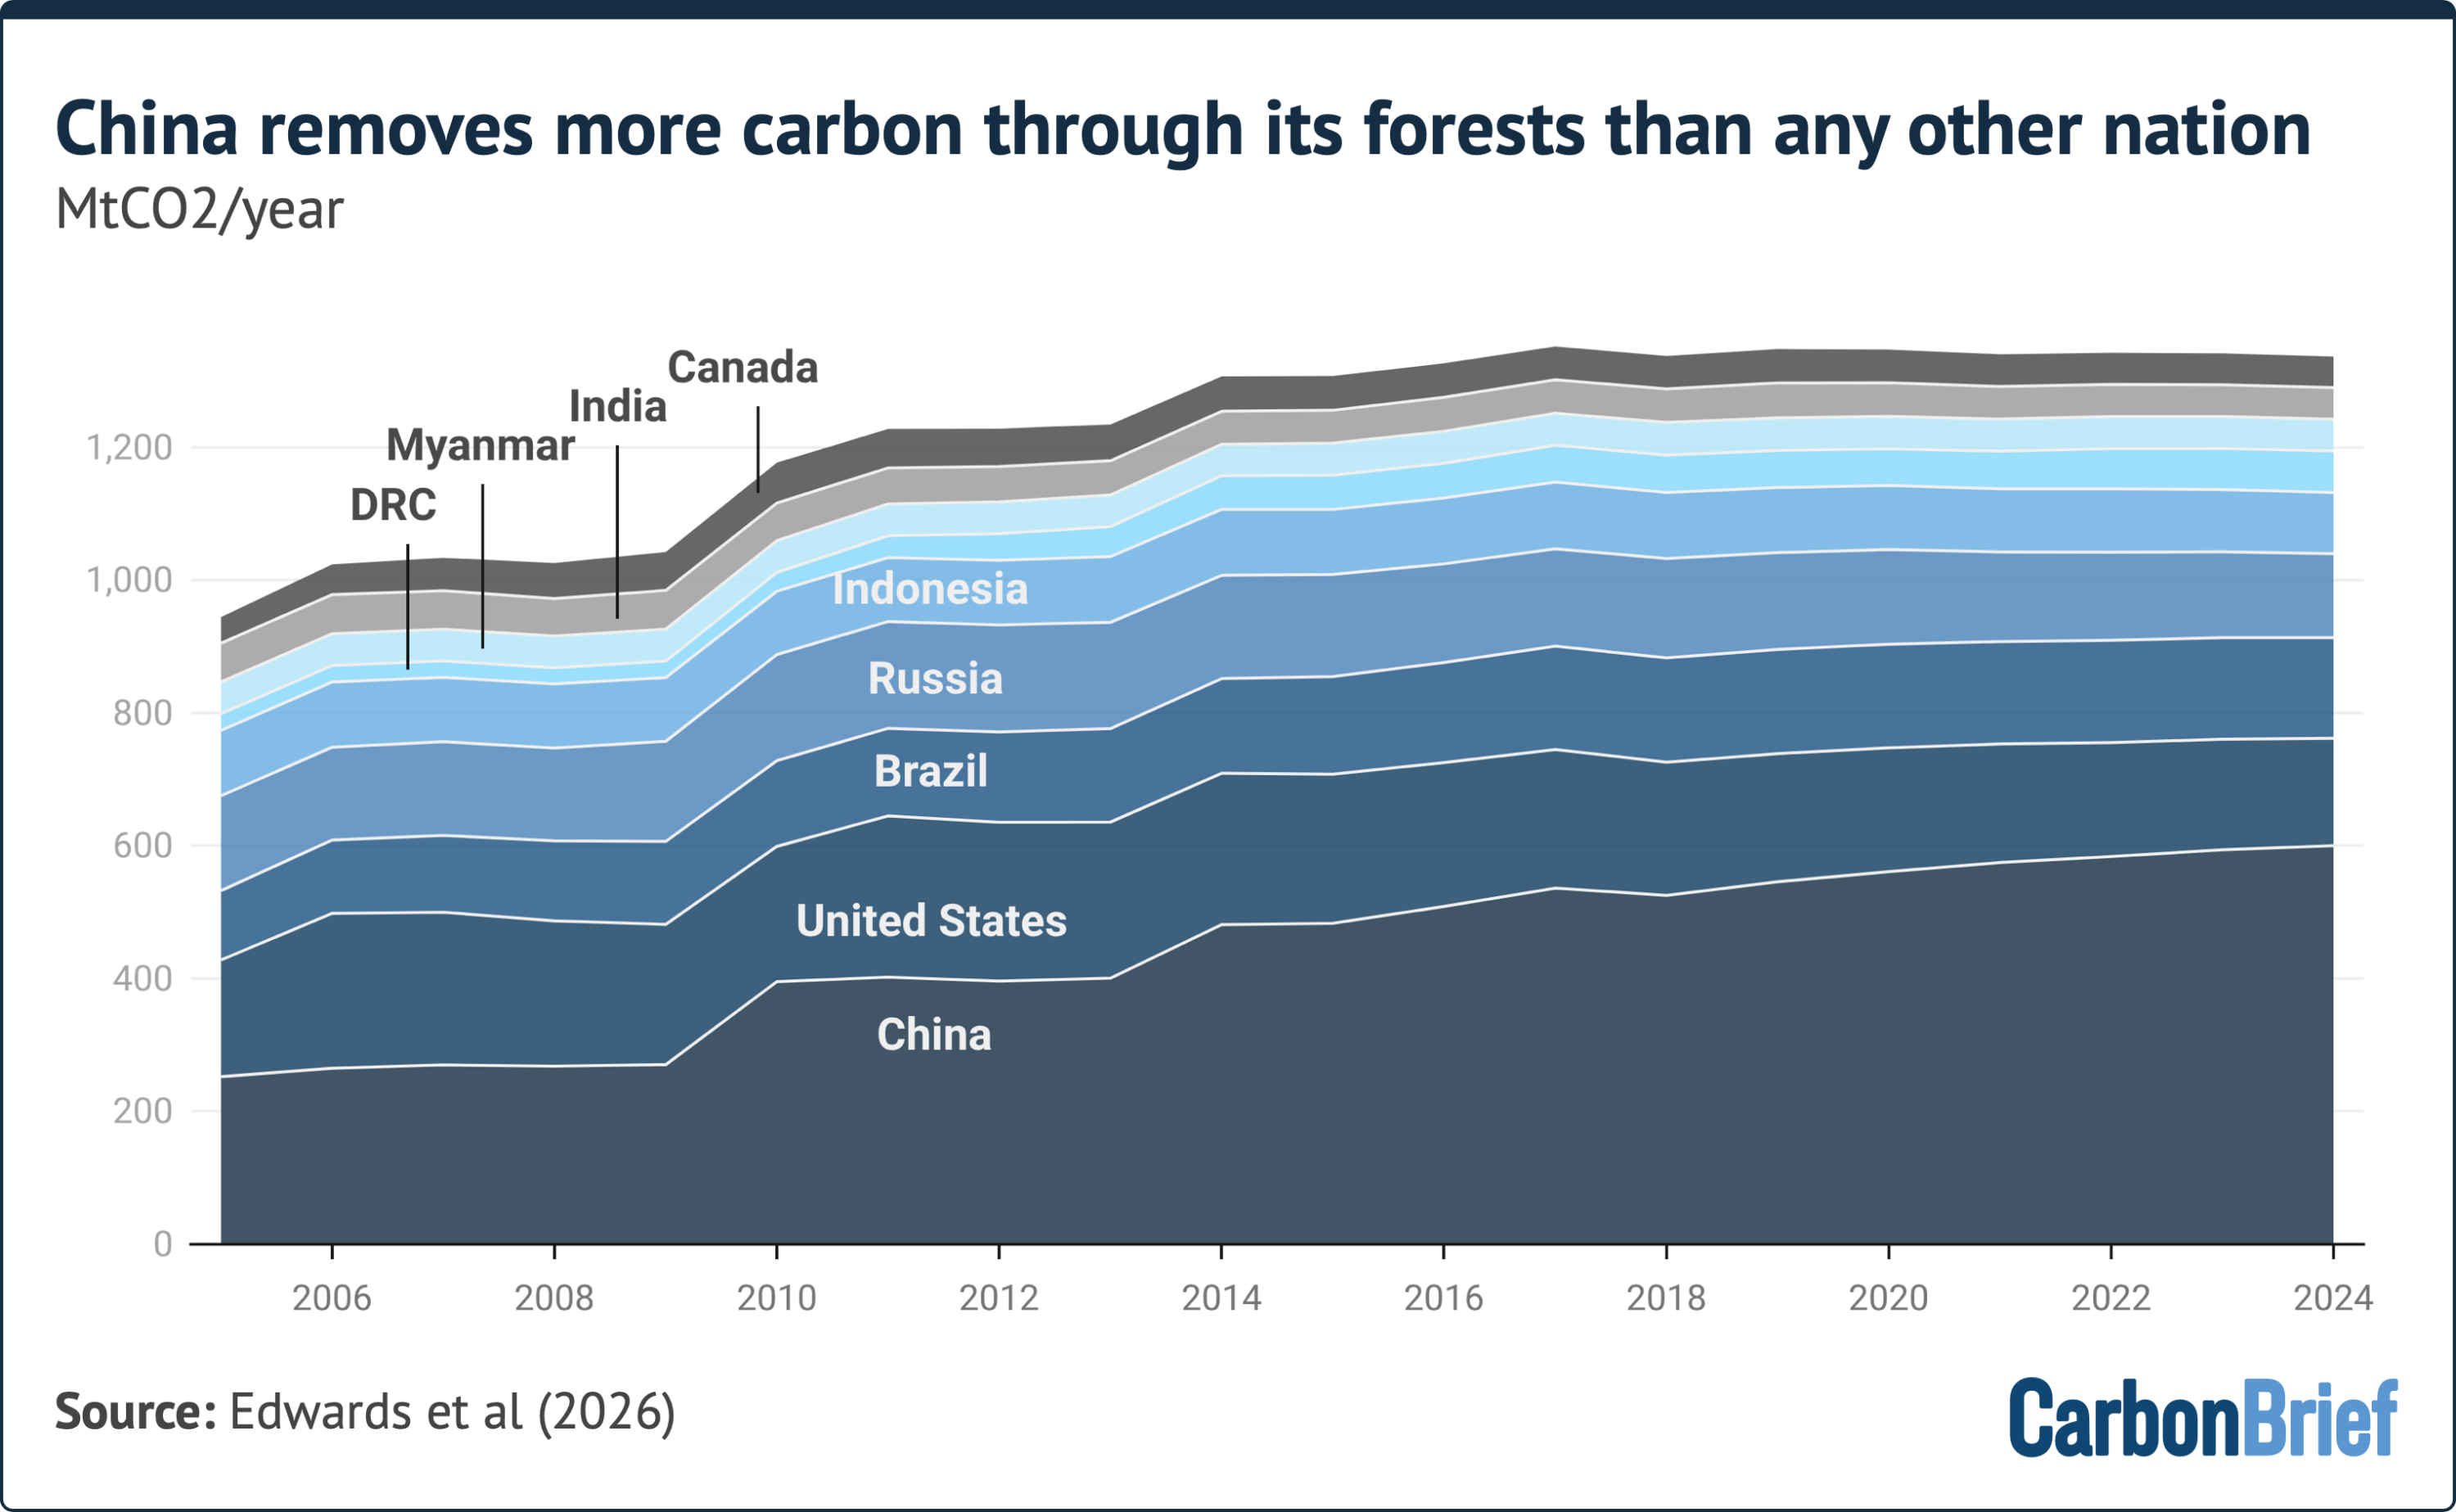
The primary drivers of this land-use reduction include a systemic fall in permanent tropical deforestation, particularly across Brazil and Indonesia, combined with unprecedented carbon sequestration resulting from large-scale afforestation and natural forest regrowth in China, the European Union, and the United States. However, researchers caution that high statistical uncertainties, political volatility, and rising climate risks—such as drought and severe wildfires—pose ongoing threats to these ecological gains.
Detailed Chronology
1960s–1990s: Baseline Stagnation
├── Average annual LULUCF emissions remain stable at ~6.6 GtCO2/yr
└── Fossil fuel emissions expand rapidly from 11.0 GtCO2/yr

Late 1990s–2000s: Turning Point & Policy Interventions
├── Global land-use emissions peak and begin an initial decline
├── 2004: Brazil launches PPCDAm (Amazon Deforestation Action Plan)
└── 2006: Brazil introduces the Amazon Soy Moratorium

2015: Environmental Crisis & Regulatory Shifts
├── El Niño triggers catastrophic peatland fires across Southeast Asia
└── Indonesia initiates aggressive peatland restoration and rewetting policies

2015–2024: Post-2015 Acceleration
├── Average annual land-use emissions drop to 5.0 GtCO2/yr (down 23% from 1995–2004)
├── China, EU, and US sequester 1.1 GtCO2/yr via afforestation/reforestation
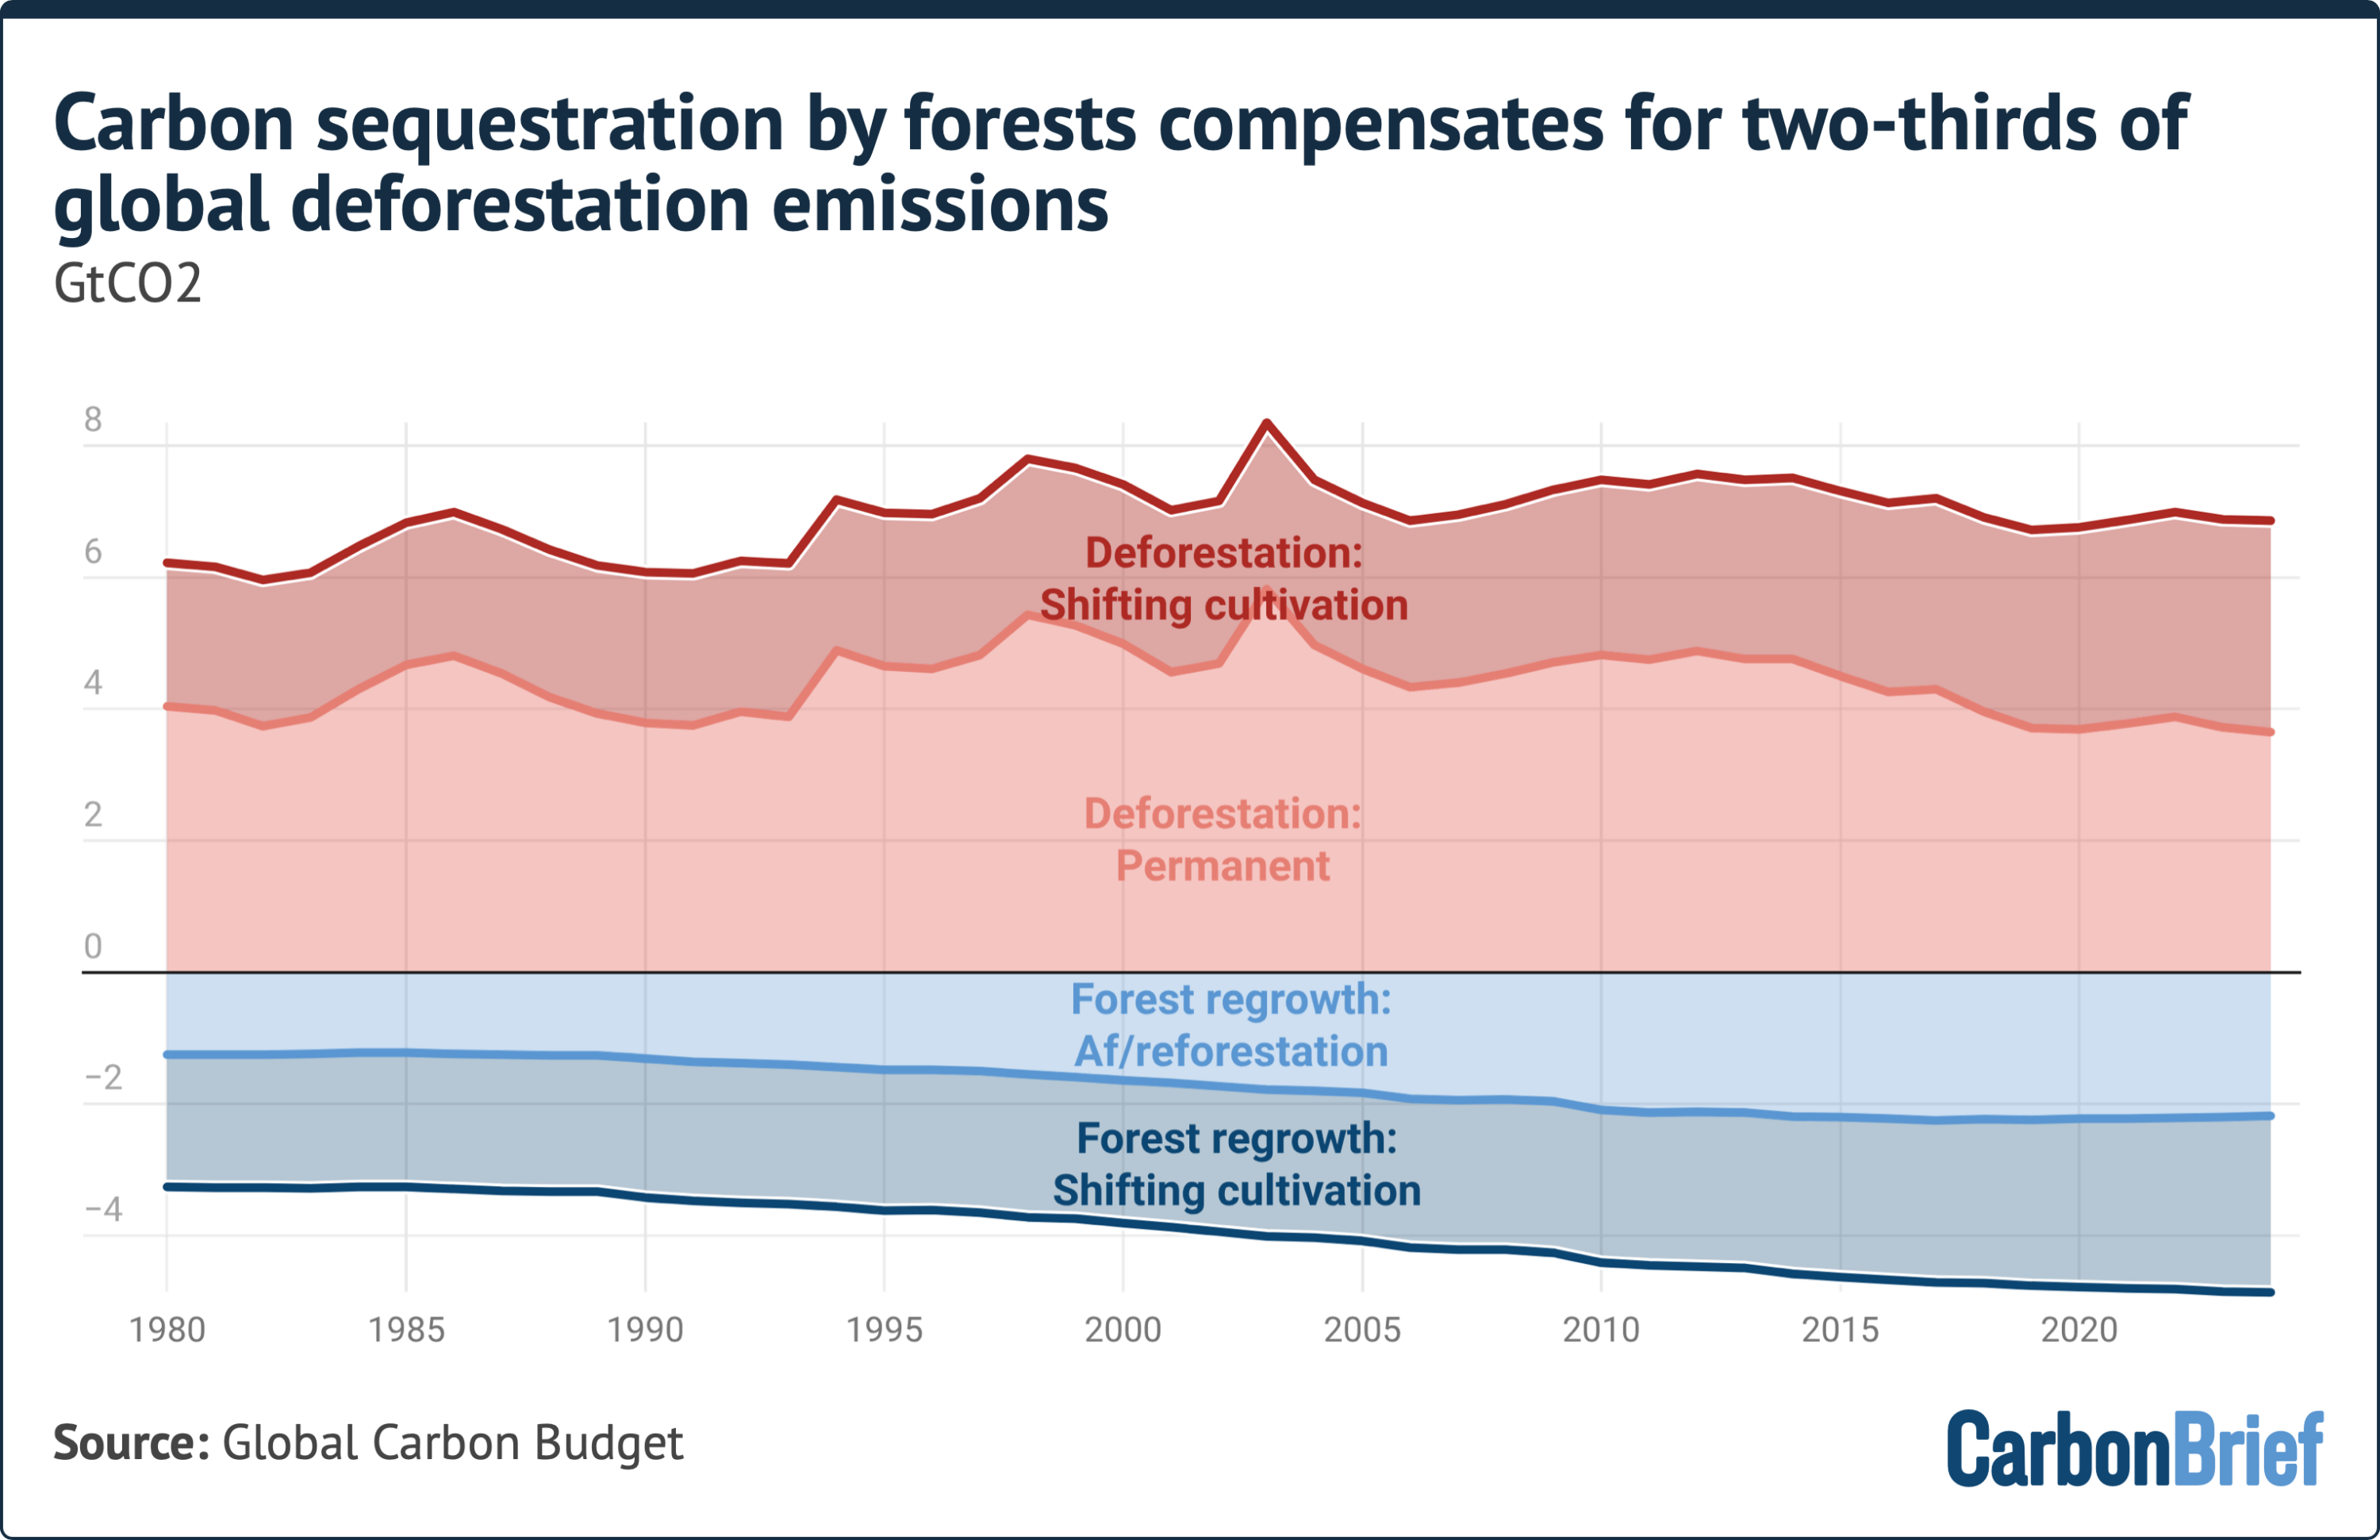
└── Forest regrowth offsets two-thirds of gross deforestation carbon losses

2024–2025: Near-Term Projections
├── Dissipation of El Niño conditions reduces tropical forest dry-out and fire spread
├── 2025 Net LULUCF emissions estimated at 4.1 GtCO2/yr (~32% below 2000s average)
└── Fossil fuel & cement emissions reach a record peak of 38.1 GtCO2/yr
The Baseline Era (1960–1999)
For four decades leading up to the end of the 20th century, net global CO2 emissions attributable to land-use change remained relatively constant, averaging approximately 6.6 GtCO2 annually. During this era, industrial agriculture, widespread clear-cutting for livestock, and unmitigated timber harvesting expanded rapidly across the tropics without significant international regulatory oversight or organized forest monitoring networks.
The Turn of the Millennium (2000–2014)
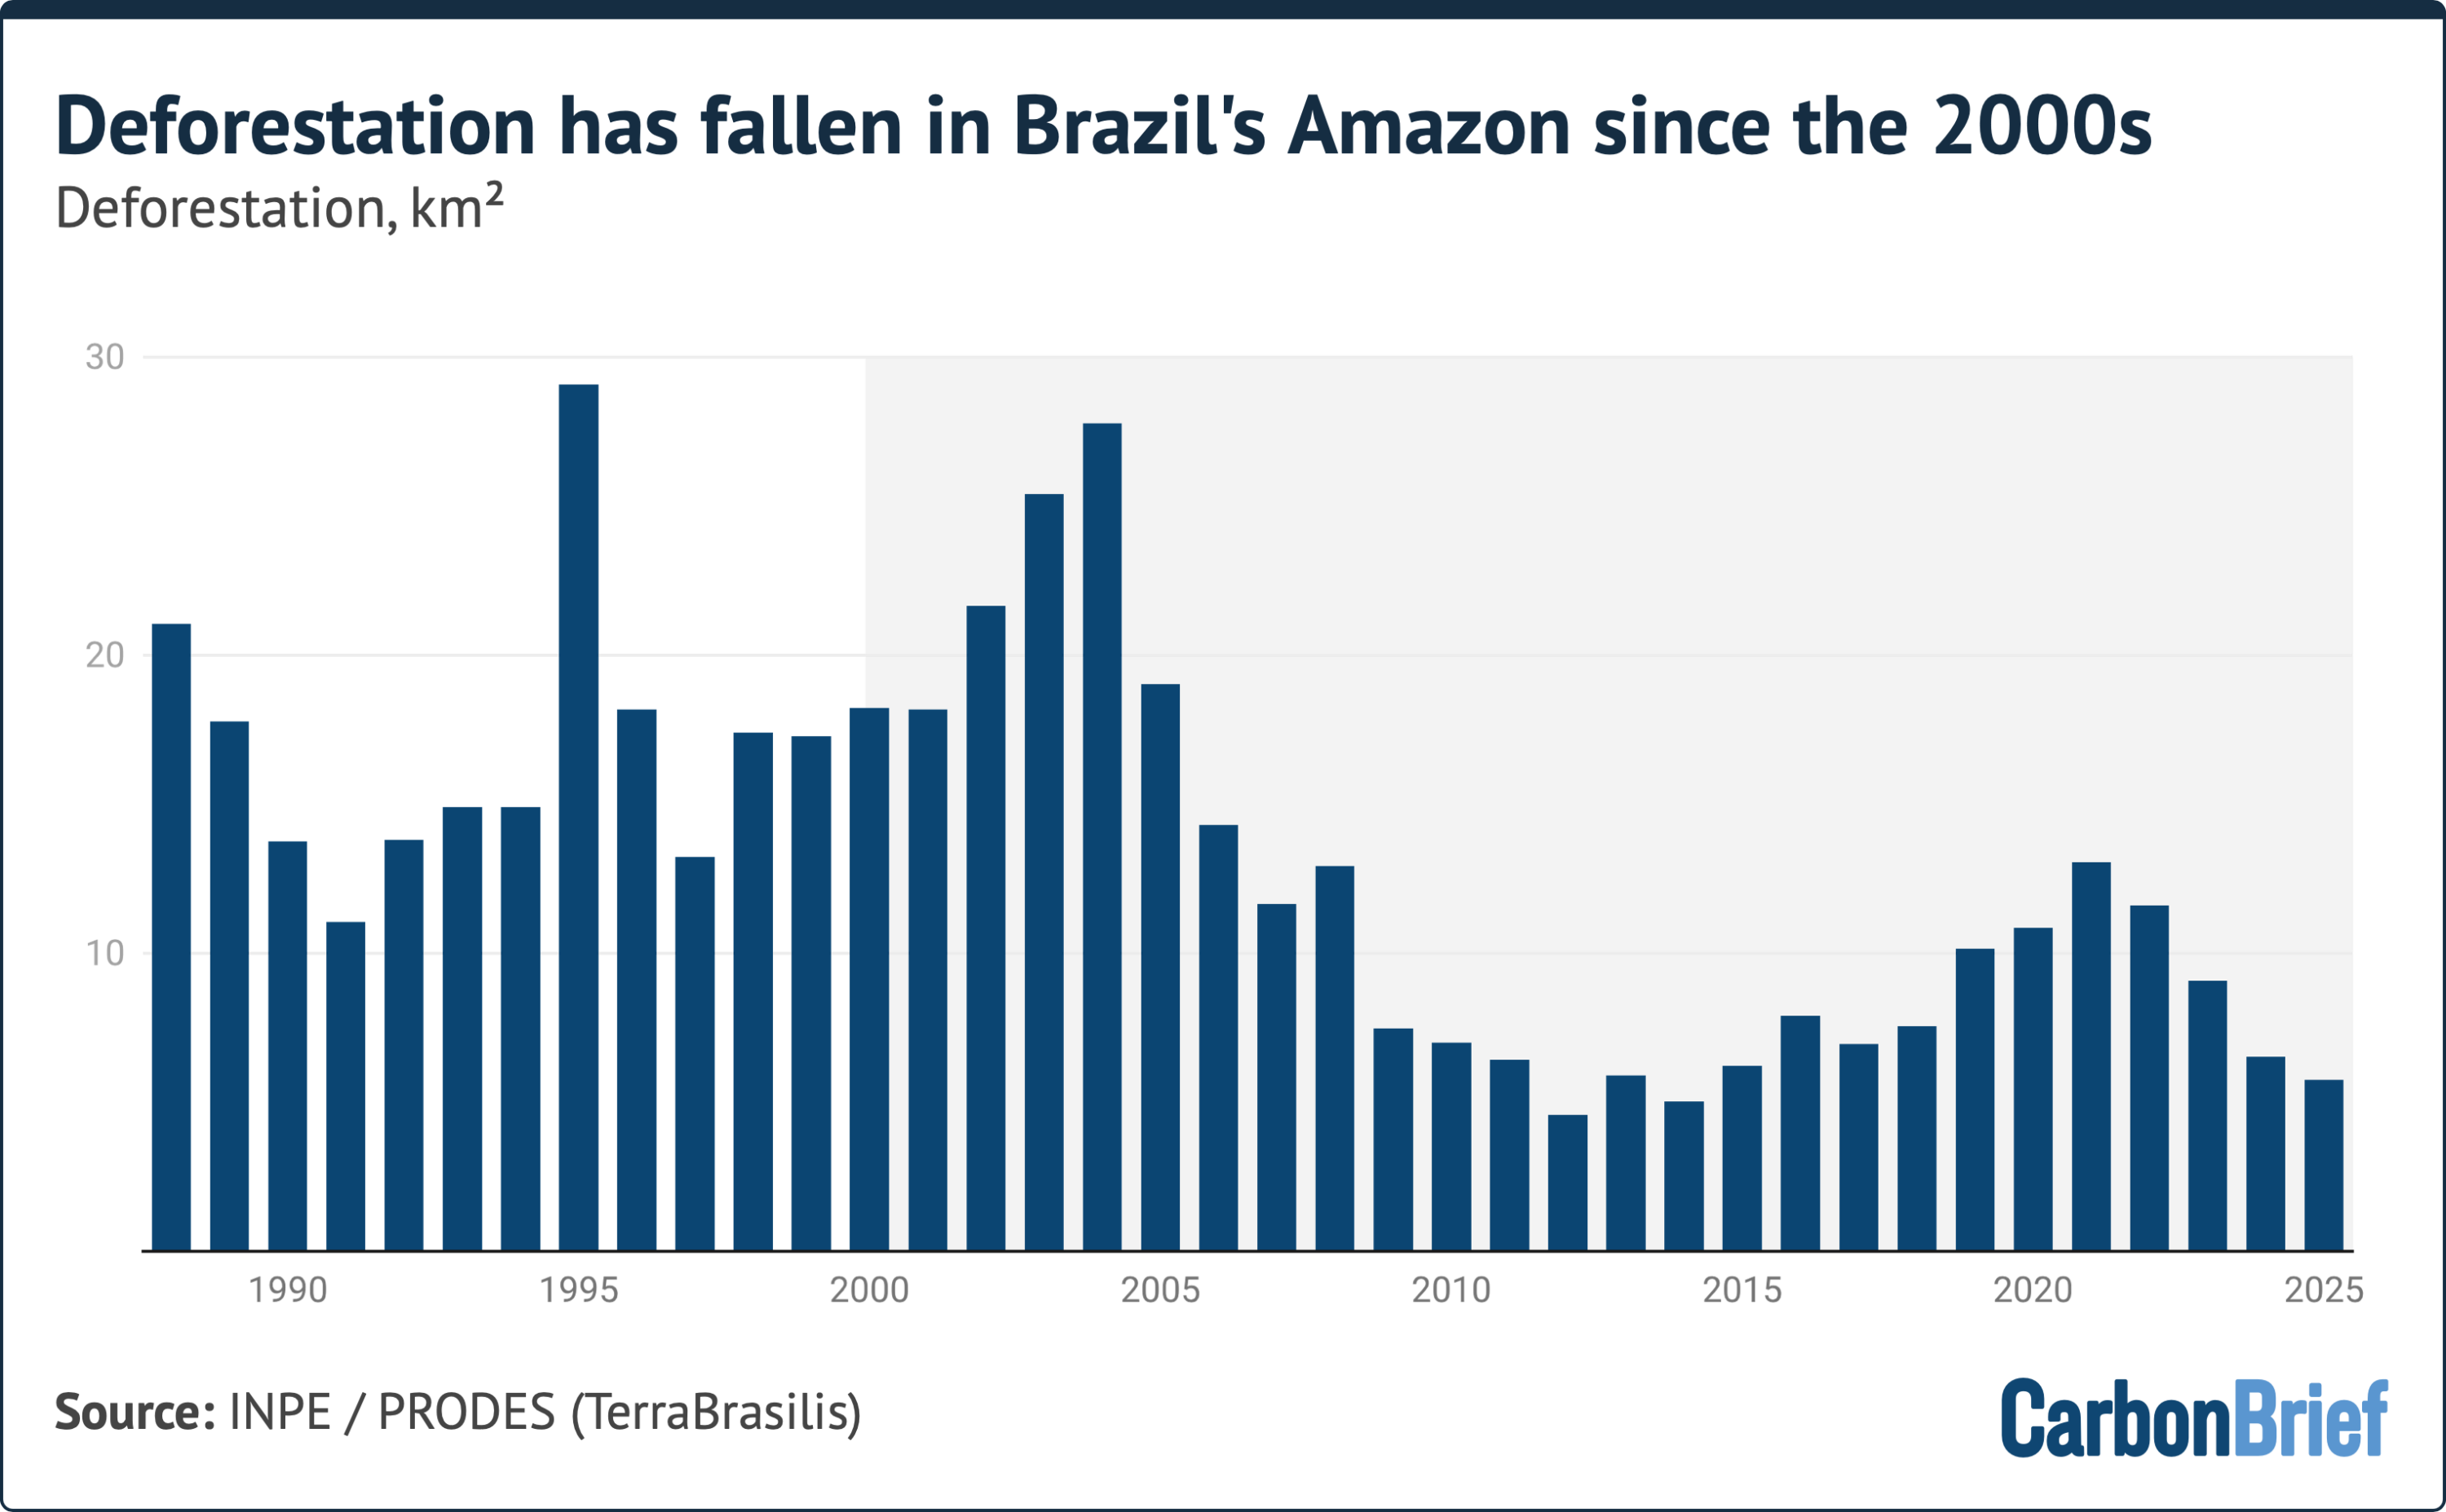
The late 1990s marked a structural inflection point. Enhanced satellite monitoring, international market pressures, and domestic regulatory frameworks began to curb clear-cutting rates. In Brazil, the implementation of the Action Plan for the Prevention and Control of Deforestation in the Legal Amazon (PPCDAm) in 2004, coupled with the landmark 2006 Soy Moratorium, dramatically curtailed land clearing across the Amazon basin. Simultaneously, China began executing multi-billion-dollar forest restoration projects aimed at land stabilization and flood control, shifting its vast landscape from a net carbon source to a powerful carbon sink.
The Post-2015 Acceleration (2015–2024)
Following an extreme El Niño event in 2015 that sparked devastating peat fires in Southeast Asia, Indonesia enforced stringent peatland protection and restoration laws. Over the decade spanning 2015 to 2024, average annual land-use emissions dropped to 5.0 GtCO2. This represented a 23% reduction compared to the 1995–2004 period (averaging ~6.5 GtCO2/yr) and a 19% drop relative to the 2005–2014 decade.
Contemporary Status (2025)
Preliminary datasets for 2025 indicate a further decline in land-use emissions to 4.1 GtCO2. Scientists attribute this recent dip partly to the end of the 2023–2024 El Niño cycle, which reduced the incidence of out-of-control agricultural fires in peatlands and tropical rainforests.
Supporting Context & Metrics
Global Emissions Divergence: Fossil Fuels vs. Land Use
The divergence between industrial carbon releases and land-use emissions highlights two contrasting vectors within the global carbon budget. While industrialization and energy demand have propelled fossil emissions upward by over 240% since the 1960s, land management interventions have successfully bent the LULUCF curve downward.
Period / Year
Fossil Fuel & Cement Emissions (GtCO2/yr)
Net Land-Use (LULUCF) Emissions (GtCO2/yr)
LULUCF Share of Total Human Emissions
1960s Average
11.0
~6.6
37.5%
1995–2004 Average
25.1
~6.5
20.6%
2005–2014 Average
33.1
6.2
15.8%
2015–2024 Average
35.9
5.0
12.2%
2025 (Preliminary)
38.1
4.1
9.7%
Gross Emissions vs. Carbon Removals (2015–2024)
Net land-use figures obscure massive, opposing gross carbon fluxes. Between 2015 and 2024, carbon sequestration from forest regrowth offset roughly two-thirds of gross carbon losses caused by deforestation:
Gross Deforestation Emissions:6.96 GtCO2/year
Driven primarily by permanent conversion of primary tropical forests to pasture, commercial cropping, and infrastructure.
Gross Deforestation Carbon Loss:  [ +6.96 GtCO2/yr ]  =======================>
Gross Forest Carbon Removals:     [ -4.76 GtCO2/yr ]  <=============
-------------------------------------------------------------------------------
Net Land-Use Budget (2015–2024):  [ +2.20 GtCO2/yr ]  =========>
*(Note: Remaining net balance of ~5.0 GtCO2 includes peat drainage, fires, and wood harvesting fluxes)*
Key Regional Drivers and Case Studies
1. Brazil: Policy-Driven Amazon Conservation
Brazil historically served as the single largest national source of land-use emissions. The establishment of protected areas, satellite-based enforcement (PRODES/DETER), and economic exclusions (such as soy and cattle moratoria) drove deforestation rates down significantly from their 2004 peak. Despite political fluctuations—such as the surge in deforestation observed under former President Jair Bolsonaro and subsequent policy enforcement under President Luiz Inácio Lula da Silva—Brazil’s multi-decade structural trend remains downward.
2. Indonesia: Peatland Restoration and Fire Control
Indonesia accounts for a massive share of tropical peatland carbon stocks. Drained peatlands oxidize and release huge volumes of CO2, while becoming highly susceptible to catastrophic fires. Since 2017, Indonesia’s specialized Peatland and Mangrove Restoration Agency has rewetted millions of hectares of degraded peatlands—a restoration scale larger than any similar effort in European history. Combined with stricter moratoria on primary forest clearing for oil palm plantations, Indonesia’s emissions baseline has plummeted.
3. China: The Global Leader in Reforestation
Through aggressive national ecological engineering programs—such as the Three-North Shelter Forest Program ("Green Great Wall") and the Grain for Green project initiated in the late 1990s—China has rehabilitated tens of millions of hectares. These programs transformed China’s land domain into the world’s most productive managed land-based carbon sink, sequestering hundreds of millions of tonnes of CO2 annually and shifting the national LULUCF balance well into negative territory.
4. Democratic Republic of the Congo (DRC): The Counter-Trend
In contrast to Brazil and Indonesia, the DRC has seen land-use emissions remain high and incrementally increase over the past two decades. Unlike South American and Southeast Asian deforestation, which is predominantly driven by international commodity export chains (soy, beef, palm oil), forest loss in the Congo Basin is driven primarily by domestic demographic growth, charcoal production, and smallholder subsistence agriculture. Consequently, international trade regulations and supply-chain certifications have had limited leverage in reversing forest loss in the region.
Official Statements
Expert contributors to the Global Carbon Budget report emphasize both the progress made in reducing land-use emissions and the structural vulnerabilities that remain.
Prof. Pierre Friedlingstein, Director of the Global Carbon Budget office and Chair in Mathematical Modelling of Climate Systems at the University of Exeter, noted the long-term positive trajectory while warning against complacency:
"If you look at the 21st century, land-use emission trends are going in the right direction. There was a bit of up and down—mainly due to politics and who was in charge in Brazil… But the long-term trend in Brazil is a decline in deforestation due to forest protection policies.
If you are optimistic, you hope the trend will not reverse and start increasing again. But we don’t know for sure. The assumption, given current land policies across the world, is that deforestation should continue to decline."
Prof. Julia Pongratz, Chair of Physical Geography and Land Use Systems at the University of Munich and co-developer of the LUCE bookkeeping model, highlighted the distinct operational models implemented in Asia and Africa:
"Brazil is the single most important contributor to the early-2000s global land-use change emissions peak and subsequent decline. Meanwhile, Indonesia has rewetted more peatland area since 2017 alone than Europe in its entire history.
Emissions in the DRC have increased, then stayed high in the last two decades. This is partly related to population growth and expanding smallholder and subsistence farming. The picture is different in Brazil and Indonesia, which are much more driven by export; international regulations aiming at curbing deforestation thus have larger effects in these countries."
Addressing the inherent challenges of measuring land carbon exchanges, Prof. Pongratz added:
"Scientists can measure the net flux of carbon between land and atmosphere, but we cannot isolate via direct measurement whether CO2 is being released or sequestered as a result of human management versus environmental feedback. For this, you need modeling where you can isolate drivers—and models carry uncertainty, and land-use input datasets are imperfect. This is why we rely on an ensemble of bookkeeping models."
Future Outlook
Methodological Complexities and Analytical Uncertainties
While the downward trend in land-use emissions is statistically robust across multiple analytical frameworks, calculating global LULUCF metrics involves significant uncertainty. For the 2015–2024 period, the Global Carbon Budget estimates an uncertainty margin of ±2.6 GtCO2 per year on its 5.0 GtCO2 mean figure—an uncertainty range exceeding 50%.
Researchers rely on three primary bookkeeping models to quantify land-use emissions:
BLUE (Bookkeeping of Land-Use Emissions)
OSCAR (Optimized Simple Climate Change Analysis Model)
LUCE (Land Use Change Emissions model)
                       ┌─────────────────────────┐
                       │  Satellite & Empirical  │
                       │   Land-Cover Datasets   │
                       └────────────┬────────────┘
                                    │
           ┌────────────────────────┼────────────────────────┐
           ▼                        ▼                        ▼
┌────────────────────┐    ┌────────────────────┐    ┌────────────────────┐
│     BLUE Model     │    │    OSCAR Model     │    │     LUCE Model     │
└──────────┬─────────┘    └─────────┬──────────┘    └──────────┬─────────┘
           │                        │                        │
           └────────────────────────┼────────────────────────┘
                                    │
                                    ▼
                       ┌─────────────────────────┐
                       │ Ensembled Consensus &   │
                       │ Land-Use Budget Output │
                       └─────────────────────────┘
Discrepancies among these models stem from how they account for complex land-use dynamics:
Legacy Fluxes: Deforestation releases carbon rapidly through burning, but soil carbon loss and wood product decomposition occur over decades.
Shifting Cultivation: Tracking the rotational clearing and natural recovery of fallow land introduces variable regrowth rates across tropical ecosystems.
Proxy Reliance Post-2023: Complete, direct statistical land-use data currently extends only through 2023. Projections for 2024 and 2025 rely on short-term proxies, including satellite fire detection and active deforestation alert systems, which carry lower confidence levels until full census data is integrated.
Climate Risk Counter-Currents and Policy Imperatives
The ongoing decline in land-use emissions faces compounding threats from global warming itself. Rising global temperatures, severe droughts, and intensified heatwaves threaten to transform protected carbon sinks back into carbon sources:
Peatland & Forest Vulnerability: Drought conditions linked to extreme climate events can dry out protected peatlands and rainforest canopies, rendering them vulnerable to severe wildfires that bypass land-use bans.
Permanence Risks: Carbon sequestered through afforestation programs (such as those in China, the EU, and the US) remains vulnerable to pest infestations, canopy dieback, and megafires driven by warming temperatures.
Policy Fragility: As demonstrated historically in South America, anti-deforestation gains remain vulnerable to political shifts, changes in trade enforcement, and economic pressures driving agricultural expansion.
To sustain the downward trajectory of LULUCF emissions, international climate policy must pair trade-linked deforestation bans (such as the EU Deforestation Regulation) with direct financial mechanisms. Initiatives like Brazil’s proposed "Tropical Forest Forever Fund" aim to incentivize developing nations to preserve standing tropical forests.
Ultimately, while the decline in land-use emissions over the past quarter-century offers a rare success story in global climate mitigation efforts, scientists emphasize that land management alone cannot compensate for unmitigated fossil fuel emissions. Achieving global climate targets will require maintaining the downward momentum in land-use emissions while enforcing rapid reductions across the industrial and energy sectors.