Executive Overview
During the summer of 2026, the United Kingdom experienced an unprecedented convergence of extreme meteorological phenomena and rapid clean-energy deployment. As persistent heatwaves drove ambient temperatures to historic levels across Great Britain, the nation’s solar infrastructure generated a record-shattering 8.8 terawatt-hours (TWh) of electricity between June 1 and August 31.
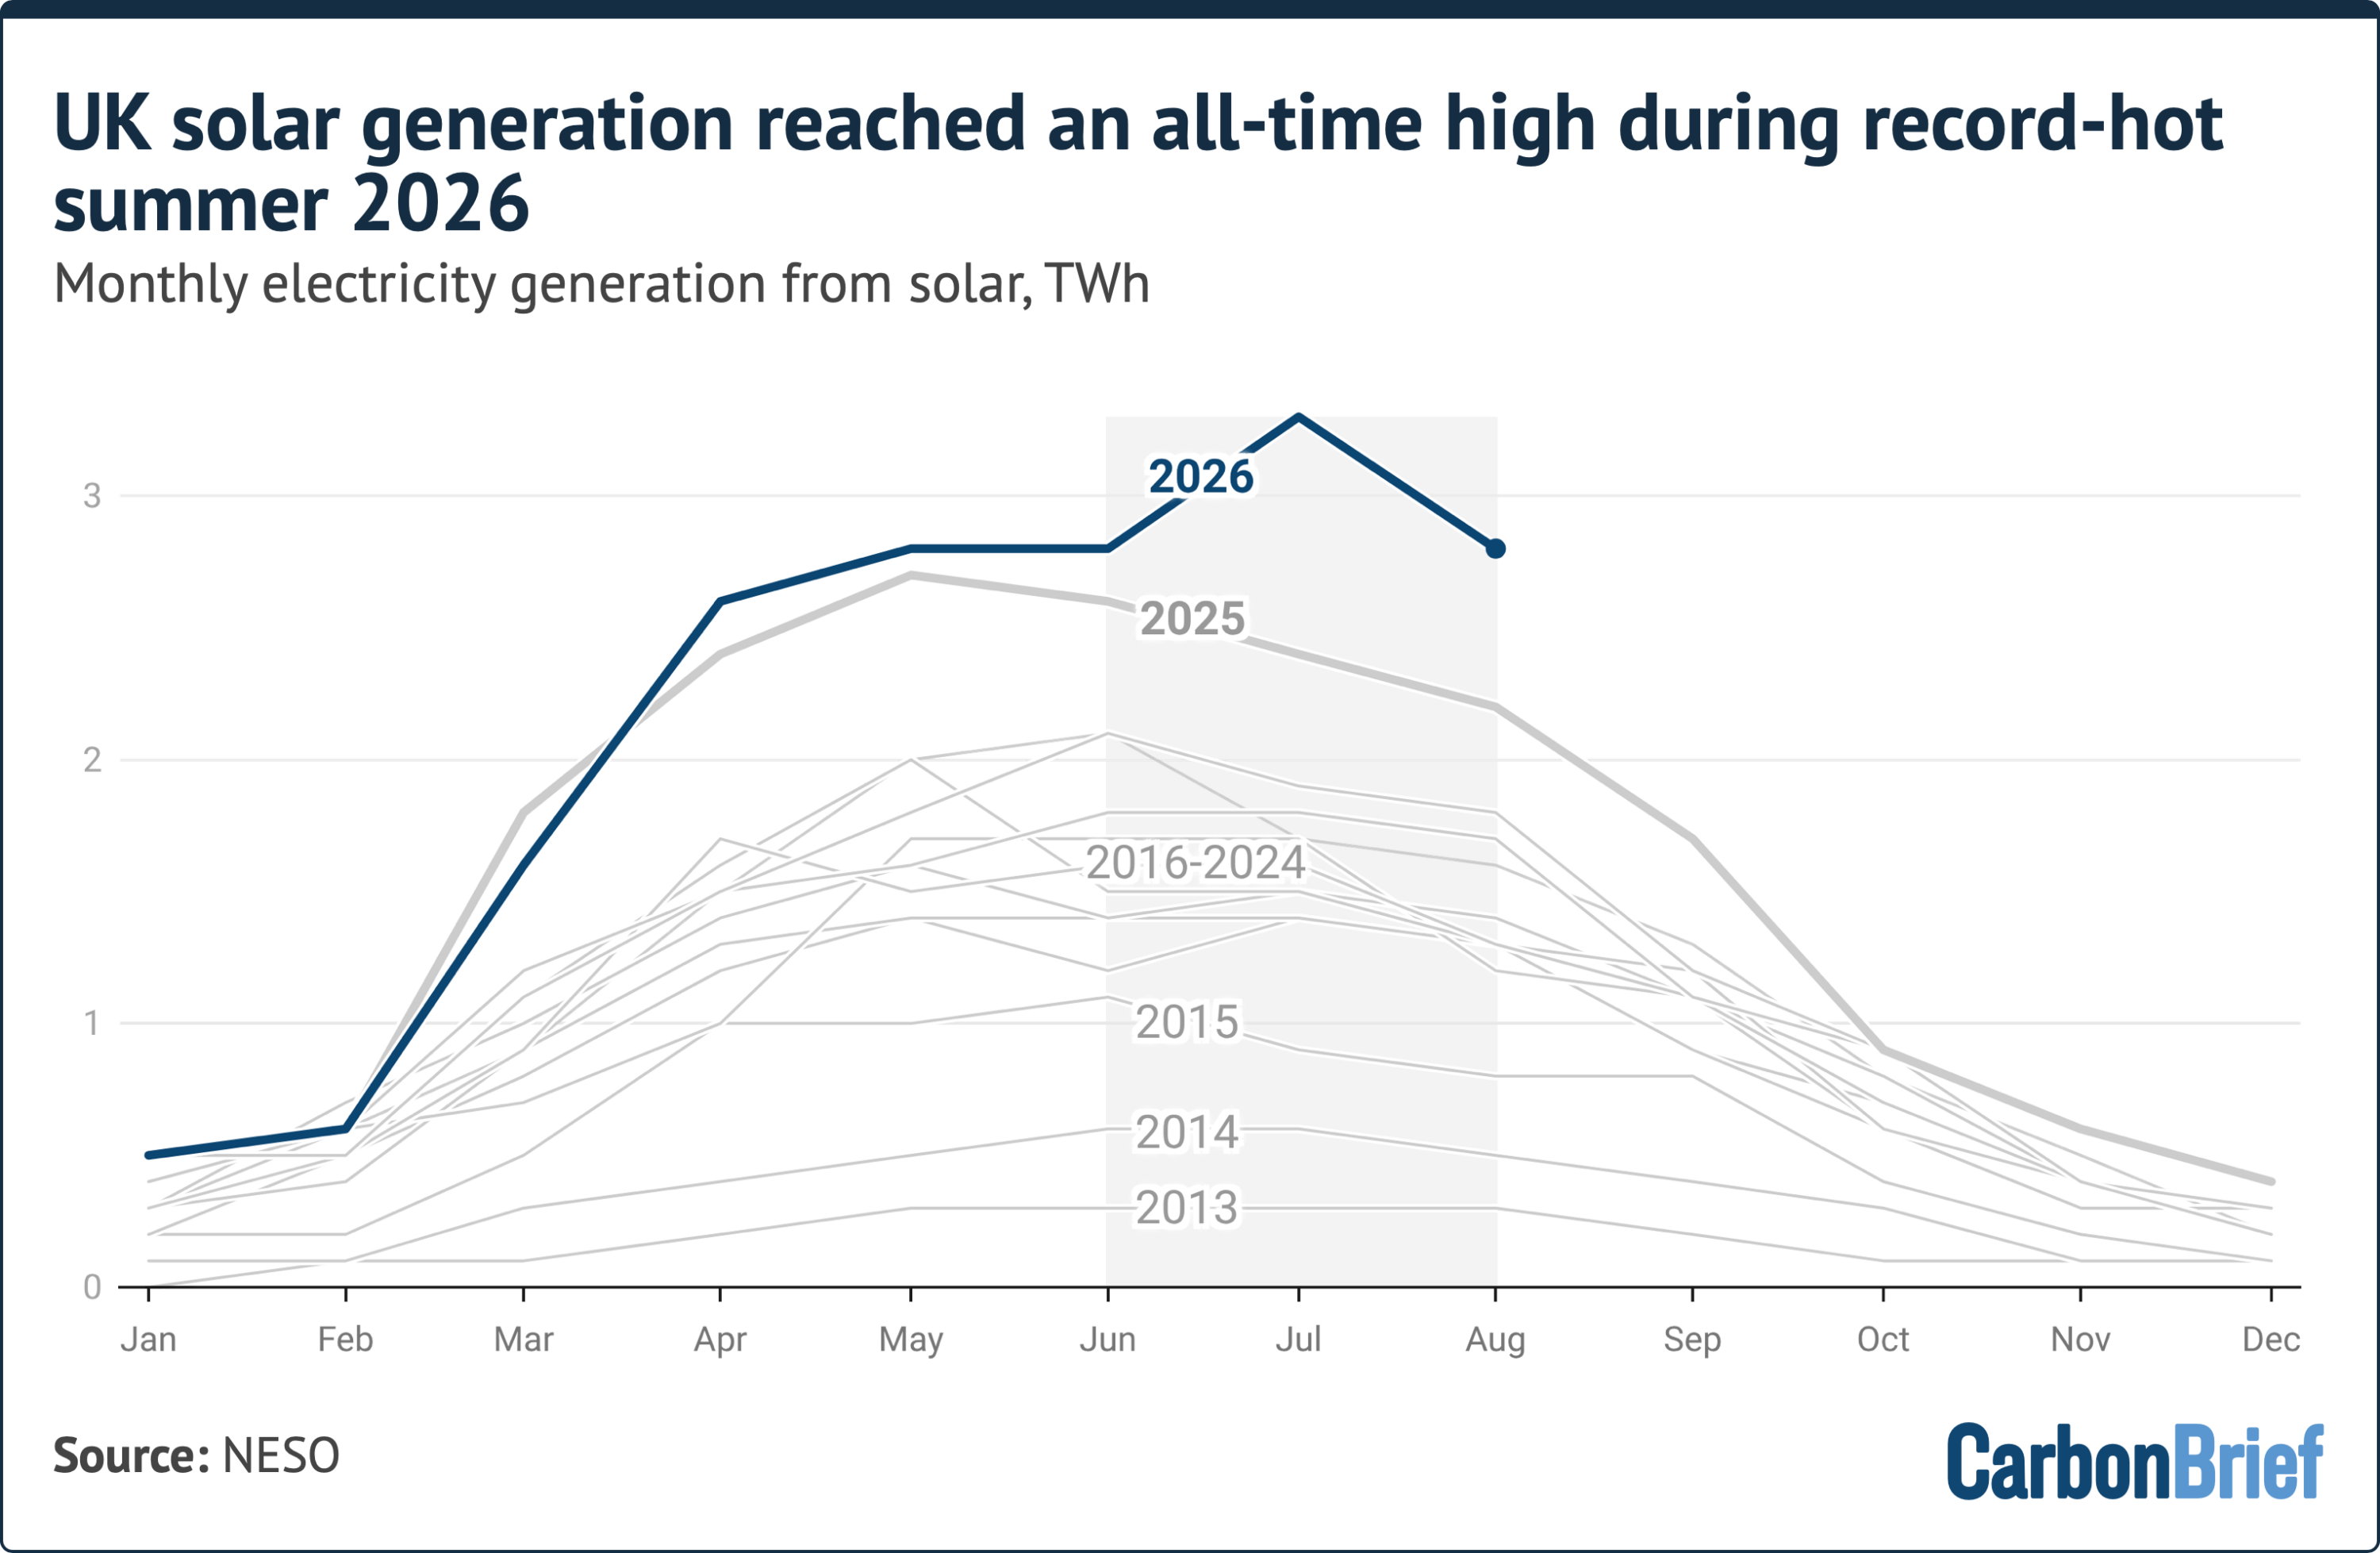
New analytical data compiled by Carbon Brief reveals that total solar generation—encompassing both commercial utility-scale solar farms and decentralized domestic rooftop arrays—increased by 23% compared to the same period in 2025, effectively doubling the solar output recorded during the summer of 2021.
UK Summer Solar Generation Trajectory (June–August)
===================================================
2021:  ████████ 4.4 TWh
2025:  ███████████████ 7.15 TWh
2026:  ████████████████████ 8.8 TWh (+23% YoY)
This monumental surge in renewable power coincided with the hottest summer in the UK since national record-keeping began, characterized by prolonged heat domes, historic dry spells, and atmospheric conditions that climate scientists at the Met Office determined were made 130 times more likely due to human-induced climate change.
Far from being a mere seasonal anomaly, the generation record underscores a structural shift in the British energy landscape. Powered by an installed capacity now approaching 24 gigawatts (GW), solar power displaced expensive fossil-fuel generation during periods of peak summer cooling demand. In doing so, it insulated the national grid from wholesale market spikes and delivered an estimated £86.7 million in direct electricity bill savings to households equipped with rooftop arrays across 26 designated heatwave days.
Detailed Chronology: The Anatomy of a Record-Breaking Summer
The unprecedented solar output of summer 2026 was forged over three distinct months of extraordinary atmospheric conditions, each setting individual benchmarks for thermal intensity and solar radiation.
+-------------------------------------------------------------------------+
|                      SUMMER 2026 TIMELINE & MILESTONES                  |
+-------------------------------------------------------------------------+
| JUNE 2026                                                               |
| • Hottest June on record in England (data dating back to 1884).         |
| • Wales & UK overall record 2nd-warmest June.                           |
| • High atmospheric clarity triggers first monthly solar generation peak.|
+-------------------------------------------------------------------------+
| JULY 2026                                                               |
| • Absolute monthly generation record: 3.3 TWh (15% of total UK demand). |
| • Driest July in England/Wales since 1836; zero rain in parts of London.|
| • Wisley, Surrey records 62 consecutive days without precipitation.     |
+-------------------------------------------------------------------------+
| AUGUST 2026                                                             |
| • Peak temperature recorded: 38.1°C at Kew Gardens, London (Aug 13).    |
| • Cumulative summer generation reaches historic 8.8 TWh mark.           |
| • Year-to-date national solar generation hits 17 TWh (+13% YoY).        |
+-------------------------------------------------------------------------+
June: High Pressure and Historical Heat Baseline
The season began with an abrupt shift toward stable, high-pressure weather systems. June 2026 registered as the hottest June in England since official records began in 1884. Wales and the UK as a whole experienced their second-warmest June on record. Clear skies across the southern and central regions allowed solar arrays to run near peak daytime capacity, establishing an early foundation for seasonal generation benchmarks.
July: The All-Time Monthly Output Record
Atmospheric stability deepened through July, delivering the driest conditions observed in England and Wales since 1836. Extensive swathes of Greater London registered zero measurable rainfall for the entire calendar month, while the weather station at Wisley in Surrey documented a 62-day dry spell.
These persistent cloudless conditions translated into an all-time monthly solar generation record of 3.3 TWh. During July, solar arrays met 15% of the total electricity demand across Great Britain, marking one of the highest monthly contributions by solar energy to the national grid mix in history.
August: Thermal Peaks and Cumulative Benchmarks
The summer’s thermal intensity culminated on August 13, when temperatures peaked at 38.1°C at Kew Gardens in London. August sustained the momentum built over the prior two months, pushing cumulative generation for June, July, and August to 8.8 TWh. By the conclusion of August, the UK’s year-to-date solar generation stood at 17 TWh—a 13% increase over the corresponding eight-month period in 2025.
Despite these seasonal and monthly records, the single half-hourly peak output record remained unbroken, standing at 15.2 megawatts (MW), set earlier in the year on April 23, 2026—a phenomenon driven by cooler spring temperatures that optimize photovoltaic panel efficiency.
Supporting Context & Metrics: Decoding the Solar Surge
The performance of Great Britain’s solar infrastructure during the summer of 2026 provides critical insights into the operational mechanics, economic benefits, and physical constraints of renewable energy deployment during periods of severe climate stress.
1. Photovoltaic Physics and Heat-Induced Efficiency Degradation
A common misconception in renewable energy engineering is that solar panels perform at their peak during extreme heat. In reality, silicon-based photovoltaic (PV) cells experience a drop in voltage—known as the temperature coefficient—as surface temperatures rise above 25°C. During the August peak, when ambient temperatures exceeded 38°C and panel surface temperatures reached much higher levels, individual panel efficiency experienced localized degradation.
       [ Long Daylight Hours (Up to 16+ hrs) ]
                         +
       [ High Solar Irradiance (>620 Sunshine Hrs) ]
                         |
                         v
  +---------------------------------------------+
  |  MASSIVE GROSS ENERGY INPUT TO PANELS       |
  +---------------------------------------------+
                         |
                         |  (Minus minor efficiency loss from panel
                         |   overheating: ~0.3% to 0.5% per °C over 25°C)
                         v
  +---------------------------------------------+
  |  NET RECORD OUTPUT: 8.8 TWh TOTAL GENERATION|
  +---------------------------------------------+
However, Carbon Brief’s analysis demonstrates that this thermal efficiency penalty was heavily outweighed by two compounding factors:
- Extended Photovoltaic Exposure: Summer 2026 was the sixth sunniest on record for the UK overall, logging over 620 total hours of sunshine.
- Regional Solar Intensity: England and Wales—where the bulk of the nation’s solar capacity is geographically concentrated—recorded their second-sunniest summers in history, delivering exceptional solar irradiance ($W/m^2$) that far compensated for thermal efficiency losses.
2. Deployment Acceleration and Structural Capacity Growth
The core driver behind the 8.8 TWh output was the aggressive expansion of the UK’s installed solar footprint over the preceding 24 months.
UK Solar Capacity & Generation Footprint
------------------------------------------------------------------
Total Installed Capacity (End of Summer 2026):   ~24.0 GW
Capacity Growth (Q3 2024 to Q3 2025):             +3.0 GW (+18%)
Total 2026 YTD Solar Generation (Jan-Aug):         17.0 TWh (+13% YoY)
Domestic Rooftop Share of Total Capacity:        ~29%
Total UK Households with Solar:                  ~1.7 Million
2026 New Rooftop Installations (YTD):            ~172,000
July 2026 Rooftop Installation Rate:             1 every 2 minutes (>19,800)
------------------------------------------------------------------
Data from the University of Sheffield’s PV Live platform indicates that total installed solar capacity in Great Britain reached nearly 24 GW by late summer 2026. This builds upon official government figures from late 2025, which recorded capacity reaching 21 GW—an 18% year-on-year increase driven by utility-scale commissioning and commercial rooftop installations.
Decentralized residential solar played a crucial role. Domestic rooftop systems account for approximately 29% of total national solar capacity. In the first eight months of 2026 alone, households installed nearly 172,000 new solar systems. July recorded a surge in domestic adoption, with more than 19,800 residential installations completed—equivalent to a new rooftop array being deployed every two minutes. Today, nearly 1.7 million UK households generate their own solar power.
UK Solar Capacity Distribution:

  [ Utility-Scale Farms & Commercial ] █████████████████████████ 71%
  [ Domestic Rooftop Installations   ] █████████████ 29%
3. Economic Shielding and Wholesale Price Suppression
The surging solar output delivered tangible economic relief during a summer marked by heightened energy cooling requirements. Traditional grid dynamics often dictate that extreme heat waves spur spikes in electricity demand due to refrigeration and air conditioning, forcing grid operators to dispatch high-marginal-cost combined-cycle gas turbines (CCGT).
During the 26 declared heatwave days of summer 2026, solar energy reversed this trend. According to economic modeling by Utility Bidder, UK households equipped with rooftop solar and integrated battery storage avoided an aggregate £86.7 million in direct electricity purchase costs.

Economic & Environmental Impact Summary (Summer 2026)
-----------------------------------------------------------------------
Household Direct Savings (26 Heatwave Days):  £86.7 Million
Peak July Grid Demand Met by Solar:           15.0%
Primary Displacement Mechanism:               Combined-Cycle Gas Power
Systemic Market Effect:                       Wholesale Price Suppression
-----------------------------------------------------------------------
On a systemic level, the injection of zero-marginal-cost solar power into the National Grid high-voltage transmission system during peak daylight hours suppressed wholesale clearing prices. By displacing imported natural gas generation, solar power mitigated the risk of localized power price surges and lowered overall procurement costs across the national energy market.
Official Statements & Expert Analysis
Industry leaders and energy analysts have highlighted that the performance of the UK’s solar portfolio during Summer 2026 offers compelling proof of the technology’s maturity, while emphasizing the urgent need for modernization of underlying grid infrastructure.
Speaking to Carbon Brief, Chris Hewett, Chief Executive of trade association Solar Energy UK, underscored the dual engines driving the record figures:
"The historic generation figures seen across June, July, and August are the direct result of clear skies combined with sustained, high-tempo deployment across both ground-mounted solar farms and residential roofs.
This record output not only kept bills down for millions of people with solar panels and batteries in their homes, but helped keep overall power prices much lower than they would have been if Britain had been forced to rely on expensive gas generation during peak daytime periods."
Energy analysts at Carbon Brief pointed out that while individual summer months routinely set incremental records, the 23% step-change from 2025 to 2026 demonstrates that structural capacity growth is outpacing historical weather volatility. The fact that generation doubled compared to the summer of 2021 confirms that the nation’s energy transition is entering an exponential phase.
However, grid engineers caution that the geographic distribution of generation highlights persistent spatial imbalances. Because the most extreme weather conditions and highest irradiance levels were concentrated across England and Wales, localized solar generation frequently outstripped regional distribution network capacities, calling attention to the critical importance of energy storage integration.
Future Outlook: Grid Integration, Storage, and System Challenges
While the performance of the UK solar sector during the summer of 2026 represents a major milestone in clean energy, it also highlights structural bottlenecks that must be resolved as Great Britain advances toward its net-zero power sector targets.
Key System Challenges & Strategic Solutions
-----------------------------------------------------------------------------
CHALLENGE                         STRATEGIC IMPERATIVE
-----------------------------------------------------------------------------
1. Midday Supply Spikes           • Rapid deployment of Battery Energy
                                    Storage Systems (BESS).
2. Transmission Bottlenecks       • Upgrading grid interconnections between
                                    high-generation & high-demand zones.
3. Seasonal Output Asymmetry      • Scaling Long-Duration Energy Storage
                                    (LDES) such as pumped hydro & hydrogen.
4. Thermal Panel Degradation      • Advanced inverter optimization &
                                    next-gen bifacial panel technology.
-----------------------------------------------------------------------------
The Storage Imperative and Long-Duration Energy Storage (LDES)
The massive midday generation spikes recorded in July—where solar briefly satisfied up to 15% of total national electricity demand—demonstrate the necessity of pairing solar expansion with utility-scale Battery Energy Storage Systems (BESS). Without adequate short-term battery buffer capacity, high instantaneous solar penetration risks daytime curtailment or localized voltage instability.
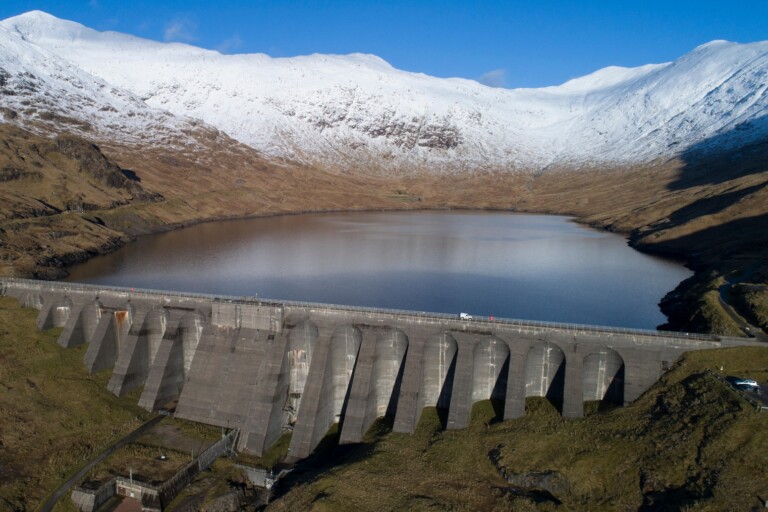
Furthermore, to address the intrinsic seasonal asymmetry between summer peak solar production and winter peak heating demand, energy planners are prioritizing investments in Long-Duration Energy Storage (LDES) technologies, including pumped hydro storage, compressed air energy storage, and green hydrogen electrolysis.
Upgrading Network Capacity and Grid Connections
The surge in residential installations—occurring at a rate of one every two minutes in July 2026—is placing localized stress on Low Voltage (LV) distribution networks managed by Distribution Network Operators (DNOs). To sustain this installation pace, regulatory frameworks must streamline connection queues and incentivize smart-grid technologies, such as dynamic export limiting and automated demand-side response.
Modernizing Policy for the 2030 Horizon
The record-breaking summer of 2026 provides a preview of Great Britain’s future energy mix under accelerated decarbonization scenarios. With installed capacity approaching 24 GW, the UK is making measurable progress toward national targets. However, maintaining this momentum will require sustained policy stability, rapid planning reform for ground-mounted utility arrays, and supply chain resiliency for critical photovoltaic components.
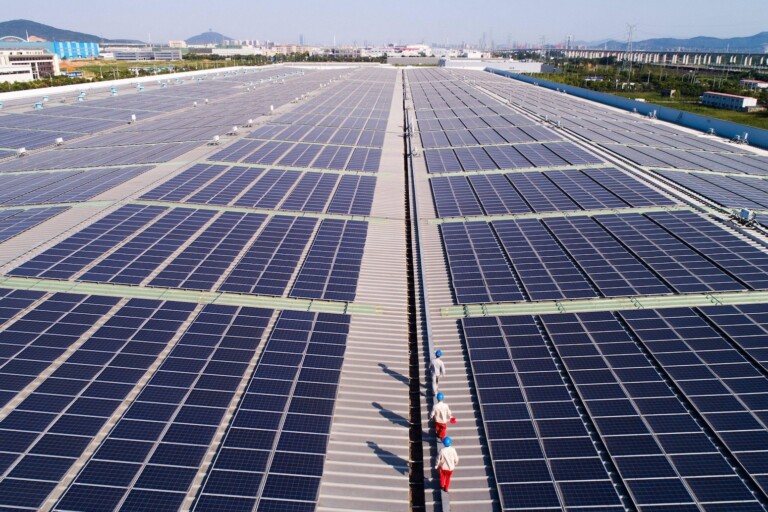
As extreme summer heat events become increasingly normalized due to broader climatic shifts, the operational performance of Great Britain’s solar fleet in 2026 confirms that solar energy is no longer a marginal secondary power source, but a cornerstone of national energy security and economic resilience.