Executive Overview
In what marks a historic inflection point for global energy markets, the volume of new coal mining capacity brought online worldwide dropped to its lowest level in over a decade in 2025. According to a landmark report published by Global Energy Monitor (GEM), global additions of new coal mine capacity plummeted by nearly 40% in 2025 compared to 2024 levels. This drastic reduction represents the second consecutive year that new mine openings have reached a ten-year low, underscoring an accelerating structural decline that first began gathering momentum in 2019.
The historical slowdown is primarily driven by dramatic policy and market shifts in East Asia and Oceania, most notably within China and Australia—historically two of the world’s largest anchors of coal production and export. In China, unprecedented deployments of utility-scale solar and wind energy have begun systematically displacing thermal coal in the power generation sector. This technological displacement, coupled with stringent new regulatory curbs enforced by China’s National Energy Administration (NEA), caused new Chinese coal mine additions to collapse by 44% year-on-year. Meanwhile, in Australia, high regulatory hurdles, shifting international financing landscapes, and escalating ESG constraints resulted in a staggering 96% drop in new mine capacity additions.
While short-term operational anomalies—including a minor rebound in Chinese coal generation during the first half of 2026 due to seasonal demand and grid curtailment issues—highlight the non-linear nature of the energy transition, the underlying trajectory remains clear. Institutional capital is rapidly fleeing primary extraction projects, risk premiums for fossil fuel infrastructure are climbing, and clean power is increasingly proving to be not only cleaner, but economically superior for baseload expansion across major global markets.
       Global New Coal Mine Capacity Additions (2019–2025)

       100% |  ==================== (2019 Peak)
        80% |  ==============
        60% |  ===========
        40% |  ========  (2024 Low)
        20% |  =====     (2025 Record Low: -40% YoY drop)
         0% +--------------------------------------------
Detailed Chronology: The Trajectory of Coal’s Structural Decline (2019–2026)
To understand the magnitude of the 2025 contraction, the current slump must be viewed through a multi-year chronological lens tracking macro-economic shocks, geopolitical volatility, and rapid technological advancement:
[2019] ------------ Peak Capital Expenditure
                    • Global additions reach operational peak.
                    • Initial warnings sound regarding overcapacity & stranded assets.

[2020–2022] ------- Pandemic Disruptions & Geopolitical Shockwaves
                    • COVID-19 pandemic temporarily freezes capital projects.
                    • 2022 European gas crisis creates short-term surge in coal prices.
                    • High profits fail to translate into long-term upstream mine investments.

[2023–2024] ------- The Regulatory & Renewable Turning Point
                    • Global renewable additions break historical records.
                    • 2024 records a initial decade-low in new coal project commissioning.
                    • China's NEA tightens permissions for high-carbon capital spending.

[2025] ------------ Historic Downward Acceleration
                    • New coal mine additions drop by ~40% globally YoY.
                    • Australia new capacity additions collapse by 96%.
                    • Chinese additions plunge 44% amidst soaring solar/wind installation.

[H1 2026] --------- Grid Integration Challenges & Operational Rebounds
                    • Hydro fluctuations and localized grid bottlenecks cause brief thermal bump.
                    • Underlying upstream investment remains depressed; structural decline holds firm.
2019: The Peak and Pre-Pandemic Shift
Prior to 2019, global coal extraction capacity expanded steadily, anchored by robust demand projections in emerging Asian markets. However, 2019 marked the structural peak for capital allocation into greenfield coal projects. Global financial institutions began enacting initial coal-exclusion policies, elevating borrowing costs for extraction projects and prompting early asset write-downs.
2020–2022: Pandemics, Price Volatility, and Capital Caution
The COVID-19 pandemic severely disrupted global energy supply chains, causing project delays and demand contraction in 2020. As economies recovered in 2021 and Russia’s invasion of Ukraine upended global energy markets in 2022, coal prices reached record highs. Despite generating historic windfall profits for mining companies, producers refrained from reinvesting capital into major greenfield projects. Instead, capital was redirected toward stock buybacks, debt reduction, and balance-sheet repair, reflecting widespread corporate skepticism regarding coal’s multi-decade demand horizon.
2023–2024: Consecutive Decade Lows
By 2023, massive clean energy deployments began taking market share from fossil fuels in key power grids. In 2024, new coal mine capacity additions plummeted to a then-decade low. Regulatory bodies across major producing nations began scrutinizing environmental permits, water table impacts, and long-term liability costs, setting the stage for an even steeper decline.
2025: The Record-Breaking Collapse
In 2025, the cumulative impact of aggressive renewable buildouts, tightened regulatory frameworks, and restricted project financing resulted in a market correction. Global Energy Monitor documented a nearly 40% drop in new mine capacity additions year-on-year, pushing the index to its absolute lowest point in modern record-keeping.
First Half of 2026: Tactical Rebound vs. Structural Drag
During the first half of 2026, Chinese power utilities registered a localized, tactical rebound in coal usage. This brief resurgence was triggered by extreme weather events that impacted regional hydroelectric output, combined with temporary transmission bottlenecks that prevented solar power generated in western provinces from reaching coastal demand centers. Crucially, however, this operational increase was met primarily through existing stockpiles and active mine adjustments rather than new mine commissioning—reinforcing the reality that capital expenditure for structural expansion has effectively dried up.
Supporting Context & Core Metrics: Dissecting the Regional Drivers
The 2025 global decline was not uniform across every geographic region, but rather spearheaded by structural transformations within key industrial heavyweights.
| Region / Country | 2025 YoY Capacity Addition Change | Primary Structural Drivers | Key Policy / Economic Factor |
|---|---|---|---|
| China | -44% | Solar/Wind grid penetration; power sector displacement | NEA capacity controls; overcapacity restrictions |
| Australia | -96% | High project capital costs; international bank retreat | Strict environmental impact assessments; state royalties |
| Southeast Asia | -18% | Jet-stream reduction in thermal demand; international financing bans | Just Energy Transition Partnerships (JETP) funding |
| Global Overall | ~-40% | Structural displacement by renewables; investor flight | Alignment with net-zero mandates & ESG frameworks |
China’s Dual Reality: Clean Energy Surge vs. Regulatory Restrictions
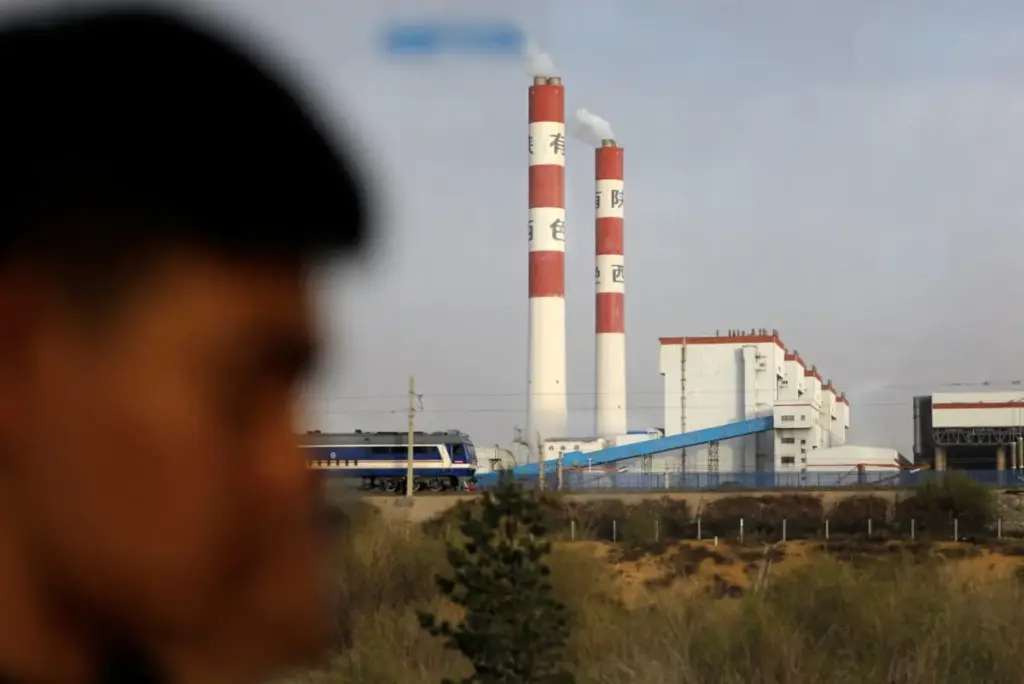
China accounts for over half of global coal production and consumption. Consequently, shifts within domestic energy policy exert a dominant influence on global metrics.
In 2025, China’s new mine capacity additions plunged by 44%. This drop was driven by two main factors:
- Unprecedented Clean Energy Scale: China installed record quantities of utility-scale solar photovoltaic (PV) systems and onshore/offshore wind turbines throughout 2024 and 2025. This massive injection of zero-marginal-cost electron generation directly eroded thermal power’s share of daytime baseload generation.
- National Energy Administration (NEA) Interventions: Recognizing the double threat of overcapacity and carbon intensity, the NEA instituted stringent regulatory directives aimed at curbing illegal mine expansions and halting permits for unapproved projects. The policy focus shifted firmly from volume growth toward safety standard enforcement and efficient consolidation of existing state-owned reserves.
       China's Energy Mix Transition Dynamics (Power Generation Share Trend)

       [Coal Share]       ===================> Structural Downward Curve
       [Solar/Wind Share] --------------> Exponential Upward Curve
                          _________________________________
                          2021   2022   2023   2024   2025
Australia’s Near-Total Freeze on New Supply
Australia, traditionally a primary exporter of high-energy thermal and metallurgical coal to Asian nations, saw its greenfield and brownfield expansion capacity virtually evaporate in 2025, registering a 96% year-on-year collapse.
Australian producers faced compounding structural headwinds:
- Capital Flight: Major domestic and international commercial banks, bound by net-zero alliances, progressively tightened debt financing terms or declined to underwrite greenfield thermal projects entirely.
- Escalating Regulatory and State Royalties: Increased state-level royalty rates (notably in Queensland) significantly elevated breakeven operational costs. Concurrently, rigorous environmental approval pipelines—focusing heavily on water security and biodiversity loss—protracted project lead times, making long-term capital investments unviable.
East Asia’s Shifts in Electricity Generation
Beyond China, major East Asian importers including South Korea, Japan, and Taiwan recorded reduced thermal coal imports and cancelled power plant expansions. Japanese utilities actively elevated LNG and nuclear restart ratios alongside solar integrations, while South Korea expanded offshore wind development, shrinking long-term regional demand projections that traditionally justified new mine developments in exporting nations.
Official Statements & Industry Commentary
The findings from Global Energy Monitor have sparked widespread analysis among climate researchers, energy economists, and policy architects worldwide.
Dorothy Mei, Project Director at Global Energy Monitor (GEM):
"What we are witnessing in 2025 is not merely a transient market fluctuation, but a structural shift in the global energy infrastructure. The data confirms that capital is decisively moving away from long-term coal extraction. When new mine additions fall by nearly 40% in a single year on the heels of a decade low, it signals that project developers and state regulators alike are reading the writing on the wall: new coal mines risk becoming stranded assets long before their operational lifespans are realized."Senior Energy Economist at the International Energy Agency (IEA):
"The simultaneous 44% drop in China and 96% drop in Australia clearly illustrate the twin engines driving this decline: aggressive deployment of low-cost clean technology on the demand side, and stringent capital discipline alongside regulatory scrutiny on the supply side. Even when thermal power output experiences short-term bumps due to weather anomalies—as seen in early 2026—the underlying investment foundation for new mining infrastructure has permanently eroded."Representative from China’s National Energy Administration (NEA) Regulatory Directorate (Source context statement):
"The focus of national energy policy is centered firmly on high-quality development, energy security, and system integration. Unregulated and inefficient capacity expansions threaten system stability and ecological commitments. Regulatory policies are explicitly designed to prevent redundant capital expenditure in legacy coal developments while optimizing current reserves to support system peak-shaving as variable renewable energy expands."
Strategic Future Outlook: Risks, Resilience, and the Net-Zero Horizon
The historic plunge in new coal mine capacity in 2025 offers a compelling, quantitative signal of energy transition progress. However, the path toward full phase-down remains fraught with operational, regulatory, and technical complexities.
                  =========================================
                  STRUCTURAL CHALLENGES IN THE NEXT PHASE
                  =========================================
                                     |
         +---------------------------+---------------------------+
         |                                                       |
         v                                                       v
[Grid Integration & Storage]                            [Just Transition & Labor]
 - Transmission bottlenecks                              - Regional economic exposure
 - Long-duration energy storage needs                    - Workforce retraining demands
 - Peaking capacity vs. baseload shift                   - Mine remediation funding
1. Grid Integration and Transmission Bottlenecks
While renewables are rapidly displacing coal in annual power generation share, integration challenges persist. As demonstrated during the localized thermal rebound in early 2026, grid stability, inter-provincial high-voltage direct current (HVDC) transmission lines, and utility-scale long-duration energy storage systems must scale rapidly to handle peak demand periods when solar and wind production drops. Until these storage solutions reach scale, legacy coal plants will likely be retained as dispatchable backup capacity, even if the mines supplying them stop expanding.
2. Metallurgical Coal vs. Thermal Coal Divergence
While thermal coal used for electricity generation faces steep competition from solar, wind, and storage, metallurgical (coking) coal used in primary steelmaking presents a more complex abatement challenge. Future capacity trajectories will likely show a total freeze on thermal coal developments alongside targeted investments in high-purity metallurgical deposits until commercial-scale green hydrogen iron-ore reduction becomes cost-competitive worldwide.
3. The "Just Transition" Imperative for Mining Regions
The rapid slowdown in new mine development creates significant economic pressure on communities historically dependent on coal extraction. Regions in inner Mongolia, Shanxi (China), New South Wales, Queensland (Australia), and the Appalachia basin (United States) face serious socio-economic structural shifts. Governments will increasingly need to deploy dedicated transition funds, economic diversification programs, and land remediation frameworks to mitigate job losses and localized tax revenue declines.
4. Climate Target Realignment
From a global climate perspective, the trajectory defined by the 2025 GEM report offers a rare piece of positive momentum. Limiting global warming to 1.5°C above pre-industrial levels, as outlined in the Paris Agreement, mandates an immediate halt to greenfield fossil fuel developments. The 40% year-on-year drop in new coal mine additions brings real-world capital allocation closer into alignment with international climate pathways than at any point since the signing of the accord.
Ultimately, the 2025 metrics indicate that the global coal mining industry has crossed a decisive threshold. Driven by the relentless economic rise of clean energy and constrained by evolving regulatory landscapes, the era of unbridled coal capacity expansion has formally drawn to a close, clearing a path for a clean, renewable-led global power grid.