Executive Overview
For years, energy modelers, investors, and policymakers have relied on a comforting assumption: green hydrogen will follow the same rapid cost-reduction trajectory as solar photovoltaics and lithium-ion batteries. In energy transition projections, cost forecasting frequently borrows one of the most powerful empirical tools in the clean-tech playbook: the experience curve. This principle states that for every doubling of cumulative technology deployment, capital costs decline by a predictable percentage.
However, recent economic and engineering data reveal a fundamental flaw in applying this framework to hydrogen. Electrolyzer stacks may be manufactured in factories, but hydrogen plants are engineered and built on-site using complex chemical infrastructure. Much of the apparent learning challenge—and the vast majority of project costs—lives entirely outside the stack factory.
A critical examination of historical data, including a comprehensive 2025 European electrolyzer-project study, demonstrates that raw cost-reduction curves conflate true manufacturing learning with project-size economies and upscaling effects. When these variables are properly isolated, the hyper-aggressive cost declines predicted for clean hydrogen begin to look overly optimistic. Understanding why hydrogen is diverging from the solar and battery cost curve is vital for realistic climate planning, capital allocation, and the deployment of clean energy infrastructure.
Detailed Chronology: The Evolution of Hydrogen Cost Projections
To understand how the clean energy sector arrived at its current approach to hydrogen forecasting, it is necessary to trace how industrial expectations have evolved over the past two decades.
The Early Optimization Era (2005–2015)
In the early days of modern green hydrogen development, projects were overwhelmingly small-scale demonstrations. Ranging from tens of kilowatts to a few megawatts, these installations treated electrolyzers as bespoke laboratory or pilot-scale assets. During this period, cost data was erratic, dominated by custom engineering, low-volume supply chains, and specialized components. Analysts recognized that costs needed to fall by an order of magnitude for green hydrogen to compete with fossil-derived grey hydrogen, but they lacked a robust historical dataset to project how that descent would occur.
The Solar Analogy and the "Gigawatt Rush" (2016–2022)
As global momentum behind decarbonization accelerated, forecasters sought a shorthand to project future green hydrogen costs. They turned to the Wright’s Law framework—the experience curves that so accurately tracked solar panels and battery cells. Because cumulative gigawatts of installed electrolysis capacity began to surge, analysts plotted these deployment milestones against capital expenditure (CAPEX) data.
Raw data from this era produced stunning learning rates. Across various datasets, costs appeared to fall by 20% to 30% for every doubling of cumulative capacity. These figures matched or even exceeded the historical learning rates of solar PV during its explosive growth phase. Policymakers seized upon these numbers, crafting national hydrogen strategies predicated on the belief that green hydrogen would achieve cost parity with fossil fuels by the late 2020s or early 2030s simply by riding the wave of manufacturing scale.
The Reality Check and Empirical Disaggregation (2023–Present)
As gigawatt-scale projects moved from PowerPoint presentations to actual construction sites, reality intervened. Developers discovered that total project costs were refusing to drop at the expected velocity.
This friction culminated in empirical reassessments, highlighted by recent economic literature such as the 2025 European electrolyzer-project study. By analyzing cost data stretching back to two decades ago, researchers began to untangle the messy reality of chemical plant economics. They discovered that what the industry had labeled "learning rates" were largely hiding structural shifts: projects were simply getting bigger, moving from 1 MW pilots to 100 MW industrial facilities. Once project-scale economies were normalized, the true underlying manufacturing learning rate proved to be significantly more modest than previously claimed.
Supporting Context & Metrics: Unpacking the Numbers
To grasp why electrolyzer experience curves distort reality, one must examine the economic anatomy of a hydrogen plant. The discrepancies stem from three primary factors: chemical plant scale economies, the shifting denominator of stack size, and strict system boundary constraints.
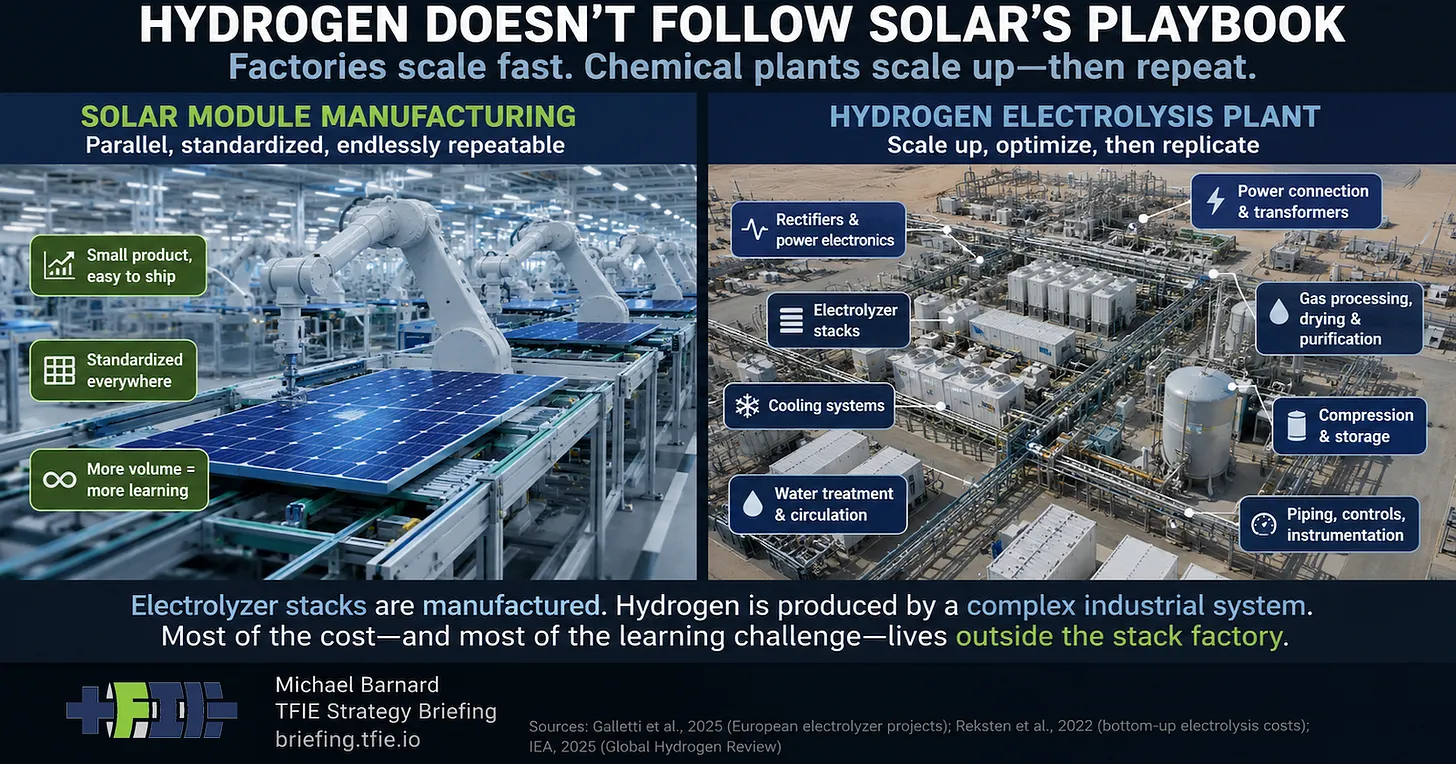
1. Chemical Plant Scale Economics Are Front-Loaded
Solar panels and lithium-ion batteries are mass-manufactured, modular products. Doubling production means churning out millions of identical, standalone units. Hydrogen plants, by contrast, are complex chemical process facilities.
Building a 100-megawatt hydrogen plant does not require one hundred times the compressors, transformers, water-treatment systems, cooling towers, gas purification units, or civil engineering hours of a 1-megawatt plant. Larger projects naturally share core balance-of-plant equipment, spread fixed engineering expenses across greater output, and push common systems toward economically optimal sizes.
This dynamic produces a steep drop in costs as the industry transitions from tiny demonstrations to industrial-scale facilities. However, these savings are front-loaded. Once compressors, transformers, and gas-processing trains reach their practical industrial scale, further capacity additions come from replicating those optimized process trains rather than making them fundamentally cheaper or more efficient per unit of output. Subsequent plants benefit from better supply-chain procurement and experienced contractors, but they do not repeatedly capture the dramatic gains of moving out of the demonstration phase.
2. The Changing Denominator: Stack Size vs. Gigawatt Growth
Another mathematical distortion in raw experience curves involves the physical size of the electrolyzers themselves.
Consider a scenario where cumulative electrolysis capacity expands tenfold—from 5 gigawatts to 50 gigawatts. In traditional learning curve analysis, this represents 3.32 doublings of installed capacity.
- If the average finished stack size remains constant at 1 megawatt, the total number of physical stacks manufactured also increases tenfold, from 5,000 to 50,000. Here, capacity doublings and manufacturing repetitions track one another cleanly.
- However, if the industry upscales during that same period—moving from an average stack size of 1 megawatt to 5 megawatts—the 50-gigawatt buildout requires only 10,000 individual stacks. While installed capacity still records 3.32 doublings, the actual number of manufactured stacks has doubled only once.
The stack factories are gaining experience, but the physical repetition occurring on the factory floor does not match the astronomical growth implied by cumulative gigawatts. While larger stacks contain more internal cells and electrode area, using installed megawatts as the sole denominator obscures these shifts in physical architecture.
3. System Boundaries and the Dominance of Balance-of-Plant
Perhaps the most rigid constraint on hydrogen cost reduction lies in the physical composition of an operational hydrogen facility. According to data from the International Energy Agency (IEA), the electrolyzer stack itself typically accounts for only 15% to 20% of total installed capital expenditure.
Where does the remaining 80% to 85% of the money go?
- 25% to 30% is tied up in balance-of-plant (BoP) equipment, including power electronics, complex piping, gas compression, and water purification systems.
- More than 50% is consumed by engineering, procurement, construction (EPC), civil works, electrical grid interconnections, and site contingencies.
Typical Electrolyzer Project CAPEX Breakdown (IEA Data):
[████               ] Electrolyzer Stack (15% - 20%)
[██████             ] Balance-of-Plant: Power, Piping, Compression (25% - 30%)
[██████████████████ ] EPC, Civil Works, Grid Connection, Contingency (50%+)
This structural reality creates a hard mathematical ceiling for stack-level cost reductions. Even if a manufacturer achieves a miraculous 20% cost reduction on the electrolyzer stack—a component representing just one-fifth of the total project CAPEX—it translates to a mere 3% to 4% reduction in total installed project cost.
Furthermore, the non-stack components—compressors, structural steel, electrical substations, and civil engineering—follow their own distinct economic trajectories dictated by global commodity markets, labor rates, and construction productivity, rather than inheriting the rapid manufacturing learning rates of a cleanroom stack factory.

Official & Expert Perspectives
Industry analysts and researchers are increasingly calling for a more rigorous, nuanced approach to modeling hydrogen economics.
"Costs really did decline; the raw curve was simply attributing several different mechanisms to ‘learning.’"
— Observations from recent European electrolyzer-project economic analyses.
Experts emphasize that conflating scale-up efficiencies with manufacturing learning creates dangerous feedback loops in financial modeling. When project developers and institutional investors base their financial close assumptions on unadjusted experience curves, projects routinely encounter severe cost overruns when hitting real-world engineering and construction bottlenecks.
Furthermore, economic analysts point out that capital expenditure is only part of the ultimate cost equation for green hydrogen. The variable cost of electricity dominates the levelized cost of hydrogen (LCOH), and no amount of manufacturing learning within a stack factory can alter the fundamental price of electrons.
While cheap wind and solar power continue to drop in capital costs, utilizing renewable energy for hydrogen production involves a strategic trade-off. Highly intermittent renewable power lowers electricity input costs but degrades the capacity factor of the electrolyzer, driving up the annualized capital cost per kilogram of hydrogen produced. Balancing this equation requires navigating complex infrastructure economics that resist simple, solar-style mass-manufacturing paradigms.
Future Outlook: Where Do We Go From Here?
Recognizing the limitations of traditional experience curves does not mean green hydrogen is a dead-end technology. Rather, it signals a necessary maturation of the industry.
To build defensible, accurate economic forecasts for 2035 and 2050, energy modelers and project developers must disaggregate the drivers of cost reduction. A realistic framework must separately model:
- Electrochemical performance and stack-level manufacturing improvements (materials science, current density, and automated assembly).
- Chemical plant scale effects (optimizing shared balance-of-plant systems and moving past first-of-a-kind engineering hurdles).
- Repeat construction and standardized EPC practices (eliminating on-site inefficiencies and reducing soft costs).
- External macroeconomic variables (electricity input prices, plant utilization rates, financing costs, and logistics infrastructure).
Strategic Implications for Deployment
By breaking down these variables, industry stakeholders can better target where clean hydrogen makes economic sense. Green hydrogen will undoubtedly become significantly cheaper than current first-generation installations as supply chains stabilize and engineering best practices take root.
However, because hydrogen cannot rely on a universal, unconstrained solar-style cost curve, its deployment must be strategically prioritized. Rather than assuming hydrogen will eventually become cheap enough to burn for low-grade heating or widespread passenger transport, market planning should direct green hydrogen toward high-value sectors where the molecule’s unique chemical properties are indispensable—such as green ammonia for fertilizers, zero-carbon shipping fuels, high-heat industrial processes (steelmaking), and chemical feedstock applications.
By anchoring expectations in physical reality rather than statistical wishful thinking, the clean energy transition can successfully scale hydrogen infrastructure where it counts, ensuring robust economics and long-term industrial sustainability.