Executive Overview
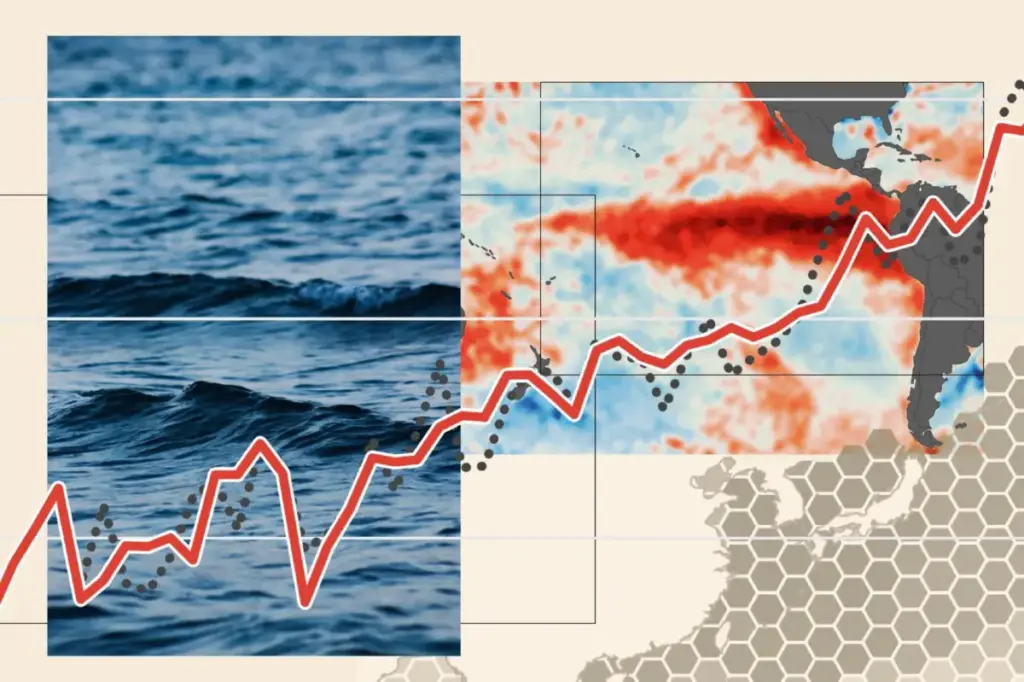
The global climate system is currently confronting a major atmospheric and oceanic shift. In June 2026, conditions across the tropical Pacific Ocean officially transitioned into an El Niño phase, setting off a cascade of weather anomalies that are expected to reverberate worldwide well into 2027. Multi-model ensemble forecasts tracking sea surface temperatures across the equatorial Pacific indicate that this event could become the most intense in recorded history. According to comparative analysis across 14 leading international climate modeling centers, an unprecedented 96% of model runs project that sea surface temperature anomalies in the critical Niño3.4 monitoring region will surpass the historical record of 2.75°C above baseline averages—a benchmark set during the severe 2015–2016 event.
                  TYPICAL ENSO STATE COMPARISON

  NEUTRAL STATE:
  [ Asia / Indo ] <--- Strong Trade Winds <--- [ South America ]
  (Warm Pool, Rain)                             (Cold Water Upwelling)

  EL NIÑO STATE:
  [ Asia / Indo ] ---> Weakened/Reversed Winds ---> [ South America ]
  (Drought Risk)       (Warm Pool Shifts East)      (Heavy Rain & Flooding)
The El Niño-Southern Oscillation (ENSO) is the planet’s single largest driver of year-to-year climate variability. Operating as a coupled ocean-atmosphere interaction across the equatorial Pacific, ENSO periodically swings between two contrasting phases: the warm ocean phase (El Niño) and the cool ocean phase (La Niña), flanked by intermediate "neutral" conditions. While these cycles have recurred for millennia, their modern manifestation takes place against a backdrop of steady, human-induced global warming.
When a major El Niño develops, the tropical ocean releases vast amounts of stored heat into the atmosphere. This temporary surge in global surface temperatures can trigger extreme heatwaves, alter global jet streams, disrupt agricultural yields, and destabilize global commodity markets. Understanding the underlying physical mechanisms, tracking metrics, and historical context of ENSO is vital for mitigating its socioeconomic impacts.
Detailed Chronology
The Ancient Origins and Historical Rediscovery (1600s–1960s)
The physical footprint of ENSO long pre-dates human record-keeping. Paleoclimate reconstructions using coral proxy data reveal that ENSO-like ocean-atmosphere variability has persisted across the tropical Pacific for at least 130,000 years, enduring through glacial and interglacial transitions.
  ========================================================================
  ENSO DISCOVERY & SCIENCE TIMELINE
  ========================================================================
  1600s       Peruvian fishers identify "El Niño de Navidad" off S. America
  1926        Sir Gilbert Walker coins the term "Southern Oscillation"
  1960s       Jacob Bjerknes links ocean warming to atmospheric pressure shifts
  1997–1998   First modern "Super El Niño" prompts automated buoy networks
  2015–2016   Extreme El Niño sets peak temperature anomaly record (+2.75°C)
  2026        NOAA adopts "Relative ONI"; 2026–27 event projected to break records
  ========================================================================
Documented human recognition of the phenomenon began in the 17th century. Fisherfolk operating off the coast of Peru observed a recurring, warm southward-flowing oceanic current that periodically replaced the cold, nutrient-rich coastal waters. Because this anomalous warming typically peaked around December, local communities christened the phenomenon El Niño de Navidad ("The Christ Child"). For centuries, it was understood purely as a regional oceanographic disruption that severely depleted local fish stocks.
The atmospheric component of the system was uncovered centuries later:
- 1926: Sir Gilbert Walker identified a planetary-scale "seesaw" in atmospheric pressure while attempting to forecast variations in the Indian summer monsoon. Walker noted that when atmospheric pressure rose in the eastern Pacific (near Tahiti), it simultaneously fell in the western Pacific (near Darwin, Australia), and vice versa. He coined this atmospheric pressure flip the "Southern Oscillation."
- Late 1960s: Swedish-American meteorologist Jacob Bjerknes connected the oceanographic and atmospheric dynamics. Bjerknes recognized that warming sea surface temperatures in the eastern Pacific were intrinsically tied to the weakening of the trade winds and the atmospheric pressure shifts Walker had documented. This synthesized understanding formed the modern framework of the coupled El Niño-Southern Oscillation (ENSO).
Modern Instrumental Eras and Super Events (1998–2024)
The systematic deployment of satellite altimetry, drifting ocean buoys, and equatorial mooring arrays (such as the TAO/TRITON array) during the late 20th century transformed ENSO monitoring from a reactive science into a predictive one.
       HISTORICAL PEAK NIÑO3.4 ANOMALIES (°C)

  2026-27 (Proj.) | ==================================== >2.75°C
  2015-16         | =================================== 2.75°C
  1997-98         | =================================== 2.60°C
  1982-83         | =============================== 2.30°C
                  +-------+-------+-------+-------+
                 0.0     1.0     2.0     3.0 (°C)
Three major "super" events defined the modern instrumental era prior to the current crisis:
- 1997–1998: A powerful El Niño caused widespread extreme weather, driving disastrous flooding in South America, severe droughts and forest fires across Indonesia, and setting a global mean surface temperature record that stood for years.
- 2015–2016: This event set a record peak sea surface temperature anomaly in the central Pacific of +2.75°C. Combined with background warming, it propelled 2016 to what was then the hottest year in recorded human history.
- 2023–2024: A third major event emerged, driving record ocean heat content and assisting in pushing global mean temperatures briefly beyond 1.5°C above pre-industrial baselines.
The Emerging 2026–2027 Event
The current sequence began unfolding in early 2026 as equatorial trade winds rapidly collapsed, triggering a strong downwelling Kelvin wave that pushed warm sub-surface water eastward across the Pacific Basin. By June 2026, official thresholds were crossed.
Updated forecast models from 14 international climate institutions now indicate an exceptionally high probability that the peak anomaly of the 2026–2027 event will surpass the 2.75°C record set in 2015–2016, positioning it as an unprecedented event in modern instrumental records.
Supporting Context & Metrics
The Pacific Engine: Neutral, El Niño, and La Niña Physics
To understand how ENSO alters global weather, one must examine the physical state of the tropical Pacific Ocean and its atmosphere.
                          OCEAN-ATMOSPHERE DYNAMICS

   [ Neutral State ]            [ El Niño State ]            [ La Niña State ]
   -----------------            -----------------            -----------------
- Strong E-to-W Trade Winds  - Weakened/Reversed Winds    - Amplified Trade Winds
- Deep Upwelling off Peru    - Suppressed Upwelling       - Extreme Upwelling
- Warm Water in West         - Warm Water Shifts East     - Warm Water Far West
- Cool Water in East         - Uniform Warm Surface       - Strong Ocean Gradient
Neutral Conditions
Under normal, neutral conditions, atmospheric circulation along the equator is driven by a combination of solar heating and Earth’s rotation. The easterly trade winds blow consistently from east to west across the tropical Pacific.
- Ocean Dynamics: These winds push surface water warmed by the tropical sun toward the western Pacific basin (around Indonesia and northern Australia), creating a "warm pool" where sea levels are up to 0.5 meters higher than in the east.
- Upwelling: In the eastern Pacific off South America, cold, nutrient-rich water rises from the deep ocean to replace the surface water pushed west. This process—known as upwelling—sustains the Humboldt Current ecosystem, feeding massive schools of anchoveta and making Peru’s fishery the largest in the world by volume.
- Atmospheric Response: The warm pool in the west fuels convective atmospheric activity, driving heavy rainfall across Southeast Asia, while cool eastern waters suppress cloud formation, bringing dry conditions to coastal South America.
El Niño Development
During El Niño, this equilibrium breaks down through a self-reinforcing process known as the Bjerknes feedback loop:
- The equatorial easterly trade winds weaken, relax, or reverse direction to blow from west to east.
- Deprived of the wind stress that maintains it, the western warm pool sloshes back eastward across the central and eastern Pacific.
- Cold upwelling off the coast of South America is suppressed or cut off entirely.
- As sea surface temperatures rise in the eastern Pacific, the ocean-atmosphere temperature gradient flattens. This weakens the atmospheric pressure differences across the ocean basin, further weakening the trade winds and reinforcing the cycle.
La Niña Development
La Niña is the inverse phase of ENSO:
- Easterly trade winds strengthen beyond average baseline levels.
- Warm surface waters are pushed farther westward into the extreme tropical Pacific.
- Ocean upwelling off South America intensifies, dragging cold, nutrient-dense waters to the surface and extending a cold tongue of ocean water far westward along the equator.
- Rainfall patterns sharpen: Southeast Asia experiences intense precipitation, while the eastern Pacific faces severe dry spells.
Quantifying Event Strength: Monitoring Regions and Metrics
To track these shifts, climate scientists monitor specific geographic sectors along the equatorial Pacific using satellite radiometers, autonomous ocean floats (Argo), and moored buoy arrays.
                    PACIFIC OCEAN MONITORING SECTORS

  +-----------------------------------------------------------------+
  |                                                                 |
  |   Niño 4          Niño 3.4          Niño 3        Niño 1+2      |
  | (160°E-150°W)   (170°W-120°W)    (150°W-90°W)   (90°W-80°W)     |
  |                                                                 |
  +-----------------------------------------------------------------+
  [ Western Pac ] <------------ EQUATOR ------------> [ S. America ]
Key Regions
- Niño 1+2 (Extreme East): Covers the region directly off the coast of Peru and Ecuador. Highly sensitive for coastal South American weather and fisheries.
- Niño 3 (Eastern Pacific): Tracks central-to-eastern ocean temperatures.
- Niño 4 (Western Pacific): Monitors the warm pool dynamics near the International Date Line.
- Niño 3.4 (Central Pacific): A rectangular area spanning over 6 million square kilometers (170°W to 120°W). This region is universally recognized as the primary indicator for global ENSO impacts.
Index Metrics and the Shift to "Relative ONI"
The traditional Oceanic Niño Index (ONI) tracks the three-month running average of sea surface temperature anomalies in the Niño3.4 region.
- El Niño Threshold: Sustained ONI values of +0.5°C or greater.
- La Niña Threshold: Sustained ONI values of -0.5°C or lower.
Historically, these anomalies were measured against fixed historical average temperatures. However, because global warming is driving up sea surface temperatures across the entire tropical ocean, using an unadjusted historical baseline can cause neutral conditions to look artificially like El Niño.
To correct for this background warming, major scientific agencies revised their tracking methodology. In 2026, the US National Oceanic and Atmospheric Administration (NOAA) officially transitioned to the Relative Oceanic Niño Index (Relative ONI). Relative ONI isolates true ENSO dynamics by calculating how much the Niño3.4 region is warming relative to the rest of the tropical oceans, ensuring that general climate warming is not confused with an El Niño event.
Official Statements and Regional Impacts
Worldwide Regional Consequences
The shifts in atmospheric circulation caused by El Niño propagate across the globe via teleconnections—atmospheric bridge channels that alter jet streams and high/low-pressure systems thousands of miles away.
                       GLOBAL IMPACT MATRIX: EL NIÑO
  +--------------------+---------------------------------------------------+
  | Region             | Primary Weather Shift & Vulnerability             |
  +--------------------+---------------------------------------------------+
  | South America      | Northern/Tropical: Severe Drought & Fire Risk     |
  |                    | Southern Coast: Heavy Deluges & Severe Flooding   |
  | Southeast Asia     | Intense Drought, Heatwaves, Crop Failures         |
  | India              | Monsoon Weakening, Agricultural Drought Risks     |
  | East Asia          | Shifted Typhoon Tracks (Higher East Asia Landfalls)|
  | North America      | Milder Northern Winters; Stormy/Wet Southern US   |
  | Southern Africa    | Severe Winter/Spring Drought                      |
  +--------------------+---------------------------------------------------+
South America and Southeast Asia
- South America: El Niño drives a stark divergence in weather across the continent. Northern Brazil, Colombia, and Venezuela suffer from warm, dry conditions that elevate the risk of drought and wildfires in the Amazon basin. Conversely, southern Brazil, Uruguay, central Chile, and northern Argentina experience heavy rain and severe flooding. Off the Peruvian coast, suppressed upwelling starves the marine food web, causing local anchoveta populations to collapse and disrupting global fishmeal supplies.
- Southeast Asia & Australia: Indonesia, Malaysia, the Philippines, and northern Australia experience severe dry spells. Reservoir levels drop, power generation suffers in hydro-dependent nations, and agricultural production of staple crops like rice and palm oil declines. Fire risks escalate sharply, often generating regional toxic haze events.
Asia and the Indian Subcontinent
- India: El Niño frequently weakens the summer monsoon winds, reducing critical seasonal rainfall needed for rain-fed agriculture across the subcontinent. Early months of the year often bring extreme pre-monsoon heatwaves.
- East Asia & Typhoons: Warm ocean waters shifting eastward change where tropical storms form. In East Asia, typhoons form farther out in the central Pacific, giving them more time over warm open ocean to gather moisture and strength before making landfall. Consequently, typhoon impacts shift away from the Philippines toward China, Japan, and the Korean Peninsula as higher-intensity storms.
North America and the Caribbean
- Jet Stream Displacement: El Niño extends and shifts the Pacific jet stream eastward. This produces milder winter temperatures across northern Canada and the northern United States.
- Southern US & California: The extended jet stream directs a series of atmospheric rivers into California and the southern US states, causing heavy winter rain, coastal erosion, and localized flooding.
- Atlantic Hurricane Suppression: In the North Atlantic basin and Caribbean Sea, El Niño increases vertical wind shear—strong, changing winds at high altitudes that tear apart developing tropical depressions. This generally suppresses the overall number of Atlantic hurricanes, though individual powerful storms can still form.
Africa
- Southern Africa: The region faces persistent dryness and severe agricultural drought from December through February.
- East Africa: Tropical East African nations often experience heavy rains and severe flooding during the short rains season, increasing waterborne disease risks while breaking long-standing droughts.
Future Outlook
Global Surface Temperature Acceleration
In addition to regional weather disruptions, El Niño exerts a direct warming effect on the global climate. As warm water spreads across the Pacific Ocean basin, it transfers massive amounts of heat from the ocean surface directly into the lower atmosphere.
             GLOBAL TEMPERATURE BOOST & LAG EFFECTION

  [ Niño3.4 Anomaly Peak ] ===(3-6 Month Lag)===> [ Global Peak Surface Warmth ]
  (e.g., +1.0°C in Pacific)                       (e.g., ~+0.1°C Global Mean)
Empirical oceanographic data shows that every 1.0°C increase in sea surface temperature anomalies within the Niño3.4 region corresponds to approximately a 0.1°C rise in global average surface temperature, with a lagged effect of three to six months.
Because of this thermal lag, the global warming impact of an El Niño that peaks in late 2026 will fully manifest in global surface temperature records in 2027. Major historical El Niño events were instrumental in setting annual global temperature records in 1998, 2016, and 2024.
  YEAR   GLOBAL TEMP RECORD MILESTONE (ERA5 DATASET)
  -------------------------------------------------------------
  1998   [###] Driven by Super El Niño
  2005   [####] Neutral year surpasses 1998 record via baseline warming
  2010   [#####] Moderate El Niño sets new global record
  2015   [######]
  2016   [#######] Major El Niño sets unprecedented global record
  2023   [########]
  2024   [#########] New record high driven by baseline warming + El Niño
  -------------------------------------------------------------
However, climate scientists emphasize that ENSO cycles only cause short-term fluctuations around a long-term trend. The rapid displacement of temperature records—where neutral or La Niña years systematically break records set during major El Niño events just a decade prior—proves that long-term global warming is driven primarily by human-caused greenhouse gas emissions.
Climate Change and the ENSO Cycle: The Attribution Debate
As climate models project an unprecedented "super El Niño" for 2026–2027, researchers are investigating whether human-caused climate change is increasing the frequency and intensity of these extreme events.
       SUMMARY OF SCIENTIFIC CONSENSUS & RESEARCH FINDINGS

  +----------------------------+-----------------------------------------------+
  | Body / Publication         | Key Research Finding                          |
  +----------------------------+-----------------------------------------------+
  | IPCC AR6 Assessment        | El Niño intensity has increased since 1950    |
  |                            | compared to historical baselines since 1400.  |
  +----------------------------+-----------------------------------------------+
  | Science Study (Galapagos)  | Century-scale ocean warming yields stronger   |
  |                            | El Niño events than pre-industrial 1,000-year |
  |                            | baseline reconstructions.                     |
  +----------------------------+-----------------------------------------------+
  | 2017 Climate Study         | Frequency of extreme El Niño events projected |
  |                            | to double under a 1.5°C global warming scenario.|
  +----------------------------+-----------------------------------------------+
The relationship between global warming and ENSO mechanics remains an active area of climate research:
- IPCC Findings: The Intergovernmental Panel on Climate Change (IPCC) Sixth Assessment Report noted that the overall magnitude and frequency of high-intensity El Niño events since 1950 are notably higher than those reconstructed from proxy data dating back to 1400.
- Paleoclimate Comparisons: Analyzing thousands of years of coral growth layers from the Galapagos Islands shows that strong El Niño events in the modern industrial era are significantly more intense than those recorded during the millennium preceding the Industrial Revolution.
- Future Projections: Climate modeling studies indicate that under a 1.5°C global warming scenario, the frequency of extreme El Niño events could double compared to pre-industrial conditions. As upper-ocean warming accelerates faster than deeper layer warming, the thermal stratification of the Pacific may create conditions that favor more intense ocean-atmosphere feedback loops.
Resilience, Adaptation, and Structural Preparedness
As the 2026–2027 event intensifies toward its projected winter peak, governments and international organizations are leveraging early warning systems to minimize economic and human losses.
Modern climate modeling provides months of advance warning, allowing for proactive adjustments in regional infrastructure and resource management:
- Agricultural Sector: Transitioning to drought-tolerant crop strains in vulnerable areas like Southeast Asia and Southern Africa, alongside preparing storage for excess harvest in regions expecting flood conditions.
- Water Resource Management: Adjusting reservoir capacity in the western Americas to accommodate atmospheric river downpours, while conserving water supplies in drought-prone regions.
- Fisheries Management: Implementing seasonal catch restrictions in coastal South America to preserve fish stock breeding populations affected by suppressed nutrient upwelling.
While early warning capabilities have advanced significantly, the projected severity of the 2026–2027 event highlights the urgency of long-term planning. As human-driven warming alters foundational climate systems, building resilience against extreme weather cycles remains critical for protecting global food security, infrastructure, and human life.