Executive Overview
In recent years, Reform UK—under the leadership of Nigel Farage and deputy leader Richard Tice—has positioned itself as a formidable force in British politics. Central to the hard-right populist party’s platform is a fierce opposition to net-zero policies and a foundational questioning of climate science consensus. Despite holding a small parliamentary footprint, Reform UK’s populist economic messaging—frequently linking decarbonization to the cost-of-living crisis, energy price hikes, and deindustrialization—has resonated across broad segments of the electorate.

However, an exhaustive factual audit of claims made by the party’s leadership reveals a persistent pattern of incorrect, misleading, and scientifically unviable assertions. Across public broadcasts, press conferences, and media interviews, party leaders have repeatedly relied on debunked climate denial tropes, misrepresented official economic data, and presented a flawed narrative regarding the UK’s energy grid dynamics, North Sea fossil fuel reserves, and renewable technology economics.

A comprehensive review of 45 central assertions made by key Reform UK figures demonstrates a stark divergence between political rhetoric and empirical realities:

- Climate Science Denials: Assertions that human activity plays no role in global warming, or that solar and volcanic activity drive current thermal trends, directly contradict the unequivocal consensus of the global scientific community.
- Economic Misconceptions: Claims that net-zero policies are "killing" the UK economy and will cost trillions of pounds ignore both current macroeconomic growth metrics and official forecasts from the Climate Change Committee (CCC) and the Office for Budget Responsibility (OBR).
- Energy Grid Fallacies: Attributing high domestic electricity prices primarily to renewable energy expansion overlooks the structural role played by volatile wholesale gas markets, which remain the principal driver of UK power costs.
- Fossil Fuel Realities: Rhetoric surrounding a return to North Sea energy independence fails to account for the physical depletion of the basin, where approximately 90% of recoverable reserves have already been extracted.
Detailed Chronology of Reform UK’s Climate Rhetoric
The integration of climate skepticism into populist platform messaging in the UK has evolved systematically over the past decade, mirroring political trends observed in right-wing movements across Europe and North America.

+-----------------------------------------------------------------------------------+
|                           CHRONOLOGY OF CLIMATE RHETORIC                          |
+-----------------------------------------------------------------------------------+
|  2019-2021 | Shift from Brexit focus to anti-lockdown & anti-decarbonization.      |
|            | Net-zero framed as an elite-imposed tax burden.                      |
+------------+----------------------------------------------------------------------+
|  2022-2023 | Capitalizing on global energy price spikes post-Ukraine invasion.     |
|            | Farage & Tice brand net-zero as "Net Stupid Zero."                    |
+------------+----------------------------------------------------------------------+
|  2024-2025 | Launch of formal party manifestos targeting renewable expansion,      |
|            | calling for fracking reinstitution and scrapping clean energy mandates.|
+------------+----------------------------------------------------------------------+
|  2026      | Escalation of anti-grid upgrade campaigns and intensified attacks     |
|            | on international climate modeling (e.g., RCP8.5 misinterpretations). |
+-----------------------------------------------------------------------------------+
The Origins: From UKIP to the Brexit Party
The precursor to Reform UK—the UK Independence Party (UKIP)—frequently flirted with climate skepticism, viewing international environmental treaties as infringements on national sovereignty. Following the 2016 referendum, as the Brexit Party rebranded into Reform UK, party leadership pivoted toward domestic policy targets. The UK’s legally binding commitment to reach net-zero carbon emissions by 2050, enacted under Theresa May’s administration in 2019, became a prime political target.

The Post-Pandemic Pivot (2021–2023)
As energy markets began to tighten following post-pandemic demand recovery and the subsequent Russian invasion of Ukraine in 2022, Reform UK intensified its messaging around energy security. Deputy Leader Richard Tice coined the phrase "Net Stupid Zero," arguing that unilateral decarbonization was bankrupting households. During this period, the party began advocating for the immediate revival of hydraulic fracturing (fracking) and expanded North Sea drilling, presenting fossil fuel expansion as a quick fix for domestic energy inflation.

The General Election and Media Blitz (2024–2026)
By 2024, climate policy critique formed a core pillar of Reform UK’s local and national campaigns. Press conferences held by Nigel Farage and Richard Tice systematically challenged established climate science, claiming that carbon dioxide accounted for only a negligible fraction of global greenhouse mechanisms and arguing that clean energy initiatives were causing widespread deindustrialization. High-profile appearances on Sky News, Bloomberg, and the BBC provided a broad platform for these claims, necessitating rigorous empirical verification by independent energy and climate institutions.

Supporting Context & Metrics: Economic and Scientific Realities
Evaluating the validity of Reform UK’s positions requires contextualizing their claims within verified scientific datasets, macroeconomic indicators, and energy infrastructure analyses.

1. The Scientific Consensus on Global Warming
According to the Intergovernmental Panel on Climate Change (IPCC)—the world authority on climate science involving hundreds of leading experts across 90 countries—it is "unequivocal" that human influence has warmed the atmosphere, ocean, and land. Atmospheric concentrations of carbon dioxide ($CO_2$) have reached levels unprecedented in at least 2 million years, driven overwhelmingly by fossil fuel combustion and land-use changes.

       HISTORICAL VS. MODERN GLOBAL TEMPERATURE TRENDS

  Temp Change (°C relative to 1850-1900 baseline)
  1.5°C |                                              /-- (Current: ~1.4°C)
        |                                             /
  1.0°C |                                            /
        |                                      -----/
  0.5°C |                                -----/
        |                    -----------/
  0.0°C +-------------------/---------------------------------
        1850               1900              1950         2025

  *Note: Scientific consensus confirms ~100% of modern warming is human-caused,
   with natural cycles (solar/volcanic) exerting negligible long-term net influence.
While natural cycles, solar variations, and volcanic events exert minor short-term effects on global temperatures, climate modeling demonstrates that human activity accounts for approximately 100% of the observed warming trend since the pre-industrial era (1850–1900).

2. Decoupling Economic Growth from Carbon Emissions
A central tenet of Reform UK’s political platform is the claim that decarbonization depresses economic productivity. However, official statistics from the Office for National Statistics (ONS) demonstrate that the UK has successfully achieved "absolute decoupling"—reducing territorial greenhouse gas emissions while simultaneously growing gross domestic product (GDP).

| Metric | 1990 Baseline | Recent Status (2024–2025) | Net Change (%) |
|---|---|---|---|
| UK Territorial Emissions | ~794 $MtCO_2e$ | ~365 $MtCO_2e$ | -54% |
| UK Real GDP | Baseline index | Nearly Doubled | +85% to +90% |
| Net-Zero Economy Sector Value | N/A | £105 Billion Gross Value Added | Significant Growth |
| Net-Zero Sector Employment | Negligible | ~1.1 Million Jobs Supported | Significant Growth |
Data Sources: Carbon Brief Analysis, ONS, CBI Economics.

3. The True Cost of Net-Zero vs. Unchecked Climate Change
Claims that achieving net-zero will cost the UK "trillions of pounds" mischaracterize accounting models by counting gross capital expenditures while completely omitting operational savings, avoided fossil fuel costs, and environmental damage mitigation.

- CCC Net Capital Investment: The Climate Change Committee estimates the total net cost to reach net-zero by 2050 at £108 billion—equivalent to less than 0.2% of GDP annually.
- Operational Savings: Transitioning to electrified transport and heating yields vast operational efficiency. Electrified technology (heat pumps, EVs) requires significantly less energy input than internal combustion or fossil gas systems.
- Economic Benefit: The UK government’s seventh carbon budget analysis indicates that meeting 2040 climate milestones delivers up to £865 billion in net economic benefits, primarily through reduced fossil fuel import dependency, air quality health benefits, and avoided extreme weather damages.
Official Statements & Fact-Checks
Below is a detailed thematic breakdown evaluating core claims made by Reform UK leadership against scientific and economic consensus.

Category I: Climate Science & Earth Systems
Claim 1: "There’s no evidence that man-made $CO_2$ is going to change climate change… The Norwegian government’s own statistics bureau produced a report confirming this." (Richard Tice, Sky News)
- Verdict: FALSE
- Factual Analysis: The IPCC confirms that anthropogenic $CO_2$ emissions are the primary driver of modern global climate change. $CO_2$ concentrations have spiked at rates unprecedented in 800,000 years. The paper cited by Tice was a discussion paper authored by two independent individuals; Statistics Norway explicitly issued a clarification stating the paper represented the personal views of the authors and was not an official policy statement or peer-reviewed institutional position. Scientific evaluations classified the document as containing standard, unverified climate-sceptic talking points.
Claim 2: "The climate’s always changed for millions of years… it goes through natural cycles." (Richard Tice, Bloomberg)
- Verdict: MISLEADING
- Factual Analysis: While Earth’s climate has historically experienced ice ages and warm periods driven by Milankovitch cycles (orbital shifts over tens of thousands of years), the current rate of warming is occurring exponentially faster. Global surface temperatures are ~1.4°C above pre-industrial levels, making the planet warmer than at any point in roughly 125,000 years. Natural factors (solar activity, volcanic eruptions) cannot account for modern thermal acceleration; scientists agree human greenhouse gas emissions account for virtually 100% of modern warming.
Claim 3: "The idea that you can stop the power of the sun or volcanoes is simply ludicrous." (Richard Tice, BBC Breakfast)
- Verdict: FALSE
- Factual Analysis: Climate mitigation does not seek to alter solar output or volcanic eruptions. Observational data shows solar irradiance has slightly declined over recent decades while global temperatures have steadily risen, disproving solar output as the cause of modern warming. Volcanic eruptions release sulfur dioxide (causing brief cooling) and minor amounts of $CO_2$ (less than 1% of annual human emissions).
Claim 4: "Man produces about 3% of the $CO_2$ produced in the world every year… it is nuts to call $CO_2$ a poison." (Nigel Farage, BBC Radio 5 Live)
- Verdict: MISLEADING
- Factual Analysis: While human emissions constitute a relatively small percentage of total gross carbon exchanges between Earth’s biosphere, oceans, and atmosphere, natural sources and sinks were in a delicate equilibrium before the Industrial Revolution. Human activity adds carbon to the active carbon cycle without adding a corresponding natural sink. This unbalances the system, causing atmospheric $CO_2$ accumulation to surge by over 50% since 1850.
                  THE GLOBAL CARBON BALANCE

   NATURAL CYCLE                    HUMAN DISRUPTION
 (In Near-Equilibrium)              (Unbalanced Input)

 [ Atmosphere ]                     [ Atmosphere ]
   ^        |                         ^    ^    |
   | ~100   | ~100                    |    |    |
   | Gt/yr  | Gt/yr             Natural|    |Human (~35 Gt/yr)
   |        v                         |    |    v
 [Land/Ocean Sinks]                 [Land/Ocean Sinks]
                                    (Can only re-absorb ~50%
                                     of human emissions)
Claim 5: "Clean air equals higher temperatures, not $CO_2$." (Richard Tice, Twitter/X)
- Verdict: MISLEADING
- Factual Analysis: Tice misrepresented research regarding industrial aerosols. Sulfate aerosols from air pollution do exert a local cooling effect by reflecting sunlight—a phenomenon known as aerosol masking. Reducing toxic air pollution unmasks underlying warming, but $CO_2$ remains the primary, overarching driver of long-term temperature rise. Reducing air pollution saves millions of lives annually from respiratory disease, and does not alter the fundamental reality of greenhouse gas-driven climate change.
Category II: Net-Zero Policy & Economic Impacts
Claim 6: "It’s incredibly stupid for the UK to almost unilaterally say, we’re going to lead the way…" (Richard Tice, Bloomberg)
- Verdict: FALSE
- Factual Analysis: The UK is not acting unilaterally. Over 140 countries covering approximately 74% of global emissions have legally binding or policy-backed net-zero targets. This includes major industrial economies across the European Union, East Asia, and the Americas. If the UK abandoned its net-zero framework, it would align with a tiny minority of major nations without formal decarbonization goals.
       GLOBAL COVERAGE OF NET-ZERO TARGETS

  [█████████████████████████████████████░░░░░░░░░░]
  74% of Global Emissions Covered by Net-Zero Mandates
Claim 7: "We’re responsible for only 0.7% or 0.8% of global $CO_2$ emissions." (Richard Tice, Bloomberg)
- Verdict: MISLEADING
- Factual Analysis: While the UK currently generates ~0.7% of annual global emissions, over one-third of all global emissions originate from nations that individually contribute less than 1% to the global total. If all small-share emitters refused to decarbonize, global climate stabilization would be impossible. Furthermore, on a historical cumulative basis, the UK is responsible for approximately 3% to 5% of all $CO_2$ emitted since the start of the industrial era (including colonial rule), creating a significant historical responsibility.
Claim 8: "Net-zero is killing our economy." (Richard Tice, Bloomberg)
- Verdict: FALSE
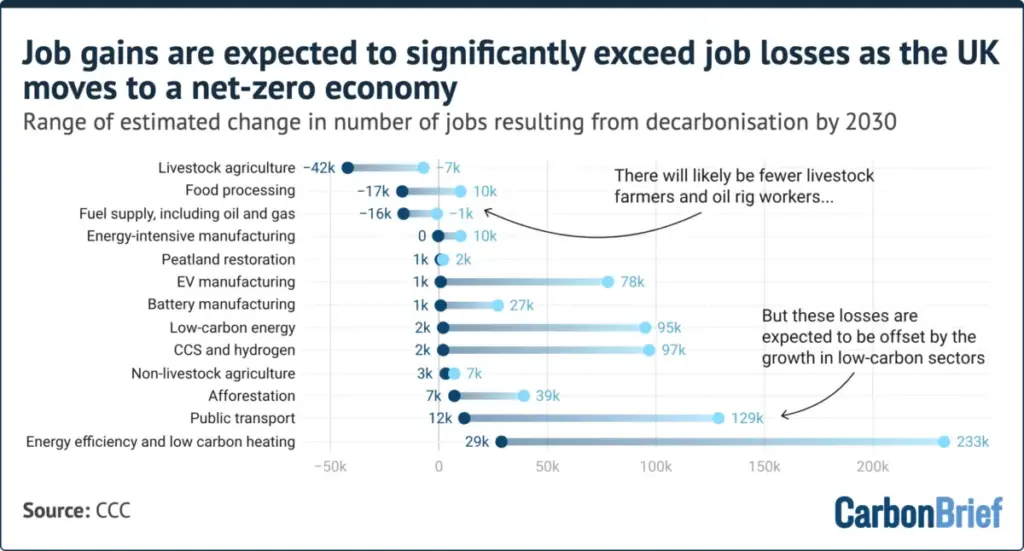
- Factual Analysis: Empirical economic data shows that the net-zero sector is one of the UK’s fastest-growing industrial segments. According to CBI Economics, the net-zero economy contributed £105 billion in Gross Value Added (GVA) in 2025 and supported over 1.1 million high-productivity jobs. UK GDP has grown consistently alongside decarbonization efforts.
Claim 9: "Labour’s reckless net-zero fantasies are destroying hundreds of thousands of industrial jobs." (Richard Tice, Press Association)
- Verdict: FALSE
- Factual Analysis: Historical employment declines in heavy industries such as coal mining and steel manufacturing occurred decades before the UK enacted its net-zero legislation in 2019. These shifts were driven by international competition, fuel-switching to gas, and automation. Conversely, low-carbon employment now exceeds traditional fossil fuel extraction employment in Great Britain.
        EMPLOYMENT TRANSITION IN LOW-CARBON VS FOSSIL SECTORS

   Number of Workers
      ^
      |     (Traditional Oil & Gas / Mining Decline)
      |                      /--- (Clean Energy & Efficiency Growth)
      |                     /
      |                    /
      +-------------------/------------------------> Time
                Pre-2019   Modern Era
Claim 10: "Net-zero targets are the prime reason for the deindustrialisation of Britain." (Nigel Farage, Press Conference)
- Verdict: FALSE
- Factual Analysis: The deindustrialization of the UK economy began in the post-WWII era and accelerated rapidly throughout the 1970s and 1980s—long before environmental legislation was framed. Manufacturing dropped from 30% of UK employment post-WWII to around 10% by 2000. Current industrial pricing pressures stem primarily from structural reliance on imported natural gas rather than green regulations.
Category III: Energy Bills, Grid Infrastructure, & Renewables
Claim 11: "There was a direct link between the growth in renewable generating capacity and the growth in electricity prices in the UK." (Richard Tice, Bloomberg)
- Verdict: FALSE
- Factual Analysis: Comparative energy metrics confirm that the spike in UK electricity bills was driven primarily by global wholesale fossil gas price surges, not renewable generation expansion. Under the UK’s marginal pricing power market, gas-fired power plants set the wholesale market price of electricity most of the time. Systems with higher shares of zero-marginal-cost renewables consistently record lower wholesale electricity generation costs.
  UK POWER PRICE DYNAMICS: THE GAS MARGINAL PRICING MECHANISM

  Wholesale Electricity Price Set By Most Expensive Generator (Fossil Gas)

  Price (£/MWh)
    ^
    |                                    +-----------------------+
    |                                    | FOSSIL GAS POWER      | <-- Sets Market Price
    |                                    | (High & Volatile Cost)|     for ALL Generators
    |             +----------------------+-----------------------+
    |             | NUCLEAR / HYDRO      |
    |  +----------+----------------------+
    |  | WIND & SOLAR (Zero Fuel Cost)   |
    +--+---------------------------------+----------------------------------> Demand
Claim 12: "It would cost over a trillion—and maybe nearer two—to upgrade the entirety of our grid for carbon-free electricity." (Nigel Farage, Press Conference)
- Verdict: FALSE
- Factual Analysis: Independent figures from National Energy System Operator (NESO) and the Climate Change Committee demonstrate that grid transmission and distribution reinforcement costs through the 2030s are estimated at approximately £60 billion to £89 billion—over ten times lower than Farage’s claim. Furthermore, these capital investments prevent structural grid bottlenecks and enable long-term bill savings by integrating cheap renewable power.
Claim 13: "It is as cost-effective or indeed cheaper to put the cables underground." (Richard Tice, Press Conference)
- Verdict: FALSE
- Factual Analysis: Detailed engineering assessments conducted by the Institution of Engineering and Technology (IET), Ramboll, and DNV consistently demonstrate that burying high-voltage underground transmission cables is 3.5 to 5 times more expensive than constructing traditional overhead lines (and up to 11 times more expensive for subsea alternatives). Mandating total undergrounding across the UK grid would add tens of billions in infrastructure costs directly to consumer bills.
          RELATIVE TRANSMISSION INFRASTRUCTURE COSTS

  Overhead Lines (Baseline) [1.0x]  ■■■
  Underground Cables        [4.5x]  ■■■■■■■■■■■■■■
  Subsea Cable Routes      [11.0x]  ■■■■■■■■■■■■■■■■■■■■■■■■■■■■■■■■■
Claim 14: "A windfall tax on renewables is the best way that we can help get domestic bills down." (Richard Tice, Press Conference)
- Verdict: FALSE
- Factual Analysis: Levying retrospective taxes on low-carbon electricity generators would depress private sector capital investment in UK infrastructure without lowering underlying power generation costs. Analysis by the New Economics Foundation (NEF) indicates that destabilizing low-carbon investment frameworks could remove tens of billions in economic output.
Claim 15: "Our electricity prices for industry are between five and six times higher than those in America." (Nigel Farage, Press Conference)
- Verdict: MISLEADING
- Factual Analysis: UK industrial electricity prices are approximately 3.5 to 4 times higher than US averages—not 5 to 6 times. This discrepancy is driven by the structural abundance of domestic shale gas in the US market, which cannot export all output due to LNG terminal capacity limits, keeping domestic US gas artificially cheap. The UK’s exposure to international LNG pricing—not net-zero legislation—explains this industrial price differential.
Category IV: Oil, Gas, & Fracking
Claim 16: "In the 80s and 90s… we had deep, plentiful energy driven by oil and gas from the North Sea… No one was worried about supply." (Richard Tice, Bloomberg)
- Verdict: MISLEADING
- Factual Analysis: North Sea fossil fuel production peaked in 1999 and has since entered an irreversible, natural geological decline. Gas production in the UK Continental Shelf fell by 74% between 2000 and 2025, while oil production fell by 75%. This drop is due to natural depletion: approximately 90% of the UK’s economically recoverable North Sea reserves have already been extracted.
             UK NORTH SEA PRODUCTION DECLINE (2000 vs. 2025)

  Gas Production  [2000] ■■■■■■■■■■■■■■■■■■■■ (Peak Era)
                  [2025] ■■■■■ (Down 74%)

  Oil Production  [2000] ■■■■■■■■■■■■■■■■■■■■ (Peak Era)
                  [2025] ■■■■■ (Down 75%)
Claim 17: "If you issue new North Sea licences and increase supply, basic economics says the price will come down." (Richard Tice, Bloomberg)
- Verdict: FALSE
- Factual Analysis: UK North Sea fields produce less than 1% of global gas supplies. Because oil and gas are globally traded commodities, local UK extraction is sold at international market rates. Expanding UK licensing has virtually zero impact on global wholesale prices, meaning it cannot reduce domestic utility bills.
Claim 18: "Why are the Norwegians drilling 49 new wells… while we drill zero?" (Richard Tice, Bloomberg)
- Verdict: FALSE
- Factual Analysis: Norway’s higher drilling activity reflects geological differences and resource management decisions. Norway has consumed only ~57% of its total estimated North Sea resources, compared to the UK’s ~90% depletion. Furthermore, official Norwegian petroleum forecasts project a steady structural decline in output over coming decades as their fields mature.
Claim 19: "Countries that frack get rich. Countries that don’t frack get poor." (Nigel Farage, Press Conference)
- Verdict: FALSE
- Factual Analysis: The commercial viability of hydraulic fracturing is dictated by geology. Geological surveys by the British Geological Survey (BGS) revealed that UK shale formations are highly complex, fault-dense, and compartmentalized, holding roughly 10 times less accessible gas than early speculative estimates suggested. Fracking in the UK faces severe geological barriers, high population density constraints, and public opposition, making US-style shale booms geologically impossible in Britain.
Category V: Impacts, Adaptation, & Clean Technology
Claim 20: "It’s much cheaper to adapt to climate change than to think you can stop it." (Richard Tice, Bloomberg)
- Verdict: FALSE
- Factual Analysis: Economic assessments by the OBR and CCC prove that unmitigated climate change incurs far greater economic costs than decarbonization. Climate-related extreme weather damages already cost the UK economy tens of billions annually, with damages projected to exceed £260 billion per year by 2050 under unmitigated warming scenarios. Furthermore, adaptation has physical and economic limits; unmitigated global temperature increases will exceed the threshold where effective adaptation is possible.
   ECONOMIC COSTS: MITIGATION VS. UNMITIGATED CLIMATE DAMAGES

  Annual Cost Trend
    ^
    |                                   / (Unmitigated Climate Damages)
    |                                  /
    |                                 /
    |  +-----------------------------+ (Adaptation Investment Needs)
    |  |
    |  +-----------------------------+ (Net-Zero Mitigation Cost: ~0.2% GDP)
    +--+-----------------------------+----------------------------------> Time
       2025                         2035                        2050
Claim 21: "Summer 2026 heatwaves feel just like 1976… heat cycles just repeat." (Richard Tice, Press Conference)
- Verdict: FALSE
- Factual Analysis: Climate research confirms that climate change has made heatwaves substantially more frequent, intense, and prolonged. The summer of 1976—previously an extreme outlier—now ranks outside the top five hottest UK summers, with all five hottest recorded summers occurring post-2003. Attribution studies by the Met Office show that human-induced warming made recent summer temperature records over 130 times more likely.
Claim 22: "A hell of a lot more people have died building wind turbines than have died in the nuclear power industry." (Richard Tice, Bloomberg)
- Verdict: MISLEADING
- Factual Analysis: Statistical safety assessments compiled by Our World in Data show that solar, wind, and nuclear are all exceptionally safe forms of energy generation, exhibiting death rates per terawatt-hour (TWh) produced that are orders of magnitude lower than coal, oil, and gas. Differences in mortality between wind, solar, and nuclear are statistically marginal and driven by minor industrial construction incidents, whereas fossil fuel air pollution alone causes millions of premature deaths globally each year.
          DEATH RATES PER TERA WATT-HOUR (TWh) OF ELECTRICITY

  Brown Coal (Lignite) [32.7]  ■■■■■■■■■■■■■■■■■■■■■■■■■■■■■■■■■
  Coal                 [24.6]  ■■■■■■■■■■■■■■■■■■■■■■■■■
  Oil                  [18.4]  ■■■■■■■■■■■■■■■■██
  Gas                  [ 2.8]  ■■■
  Wind                 [0.04]  | (Negligible)
  Nuclear              [0.03]  | (Negligible)
  Solar                [0.02]  | (Negligible)
Claim 23: "Solar farms are destroying productive farmland and decimating village property prices." (Richard Tice, Bloomberg)
- Verdict: FALSE
- Factual Analysis: Existing ground-mounted solar accounts for less than 0.1% of total UK land area. Even if solar capacity expands to meet national 2050 targets, it will occupy roughly 0.7% of UK land—less than the land area currently dedicated to golf courses. The National Farmers Union (NFU) confirms solar developments pose no threat to national food security. Additionally, peer-reviewed economic research from the London School of Economics (LSE) found no statistically significant negative impact from solar farms on nearby residential property values.
Claim 24: "Battery energy storage systems are highly dangerous fire hazards and should be banned." (Richard Tice, Press Conference)
- Verdict: FALSE
- Factual Analysis: Grid-scale Battery Energy Storage Systems (BESS) are heavily regulated and feature advanced thermal management, gas detection, and fire suppression safety systems. Across more than 1,600 operational utility-scale battery storage facilities in the UK, only two fires have occurred over a five-year period, resulting in zero injuries or fatalities. Empirical failure rates for domestic battery installations (~0.005%) are comparable to standard household electrical appliances like tumble dryers.
Future Outlook: Economic & Environmental Implications
The dissemination of unverified claims regarding energy systems and climate science carries direct policy, financial, and environmental consequences for the UK’s national transition.

Investment Capital Uncertainty
Energy infrastructure development relies heavily on long-term policy clarity