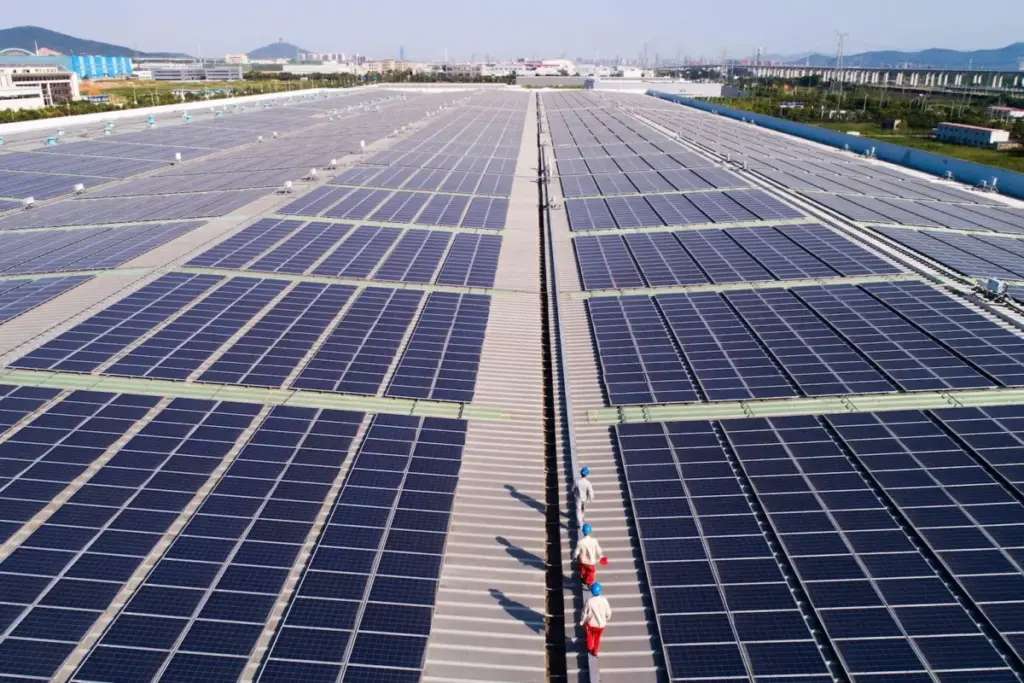
As climate change fuels historic heatwaves across Great Britain, solar output climbs to an all-time high of 8.8 TWh, delivering crucial energy price suppression and household savings amid rapid infrastructure expansion.
Executive Overview
Over the summer of 2026, Great Britain’s solar power architecture achieved unprecedented milestone performance. Driven by record-breaking summer temperatures and relentless infrastructure growth, solar farms and rooftop arrays across England, Scotland, and Wales generated a total of 8.8 terawatt-hours (TWh) of electricity across June, July, and August, according to a detailed analysis published by Carbon Brief.
This historic volume represents a 23% increase compared to the same three-month period in 2025, and effectively doubles the solar energy produced during the summer of 2021. The record output underscores how rapid structural expansion in green infrastructure is reshaping the national power grid, providing a growing buffer against expensive fossil fuel imports during periods of peak seasonal demand.
The surge in output occurred against the backdrop of Great Britain’s hottest summer since records began, characterized by five distinct heatwaves, extreme solar irradiance, and historic rainfall deficits. During July—the peak month of generation—solar power produced 3.3 TWh, covering 15% of total national electricity demand.
While extreme thermal conditions can present operational challenges for photovoltaic (PV) materials, the combination of extended daylight hours and high solar irradiation easily surpassed minor heat-induced efficiency losses. Ultimately, the summer of 2026 has provided a definitive proof-of-concept for the role of decentralized solar power in stabilizing wholesale energy markets and insulating consumers from volatile energy costs.
Detailed Chronology: The Anatomy of a Record-Breaking Summer
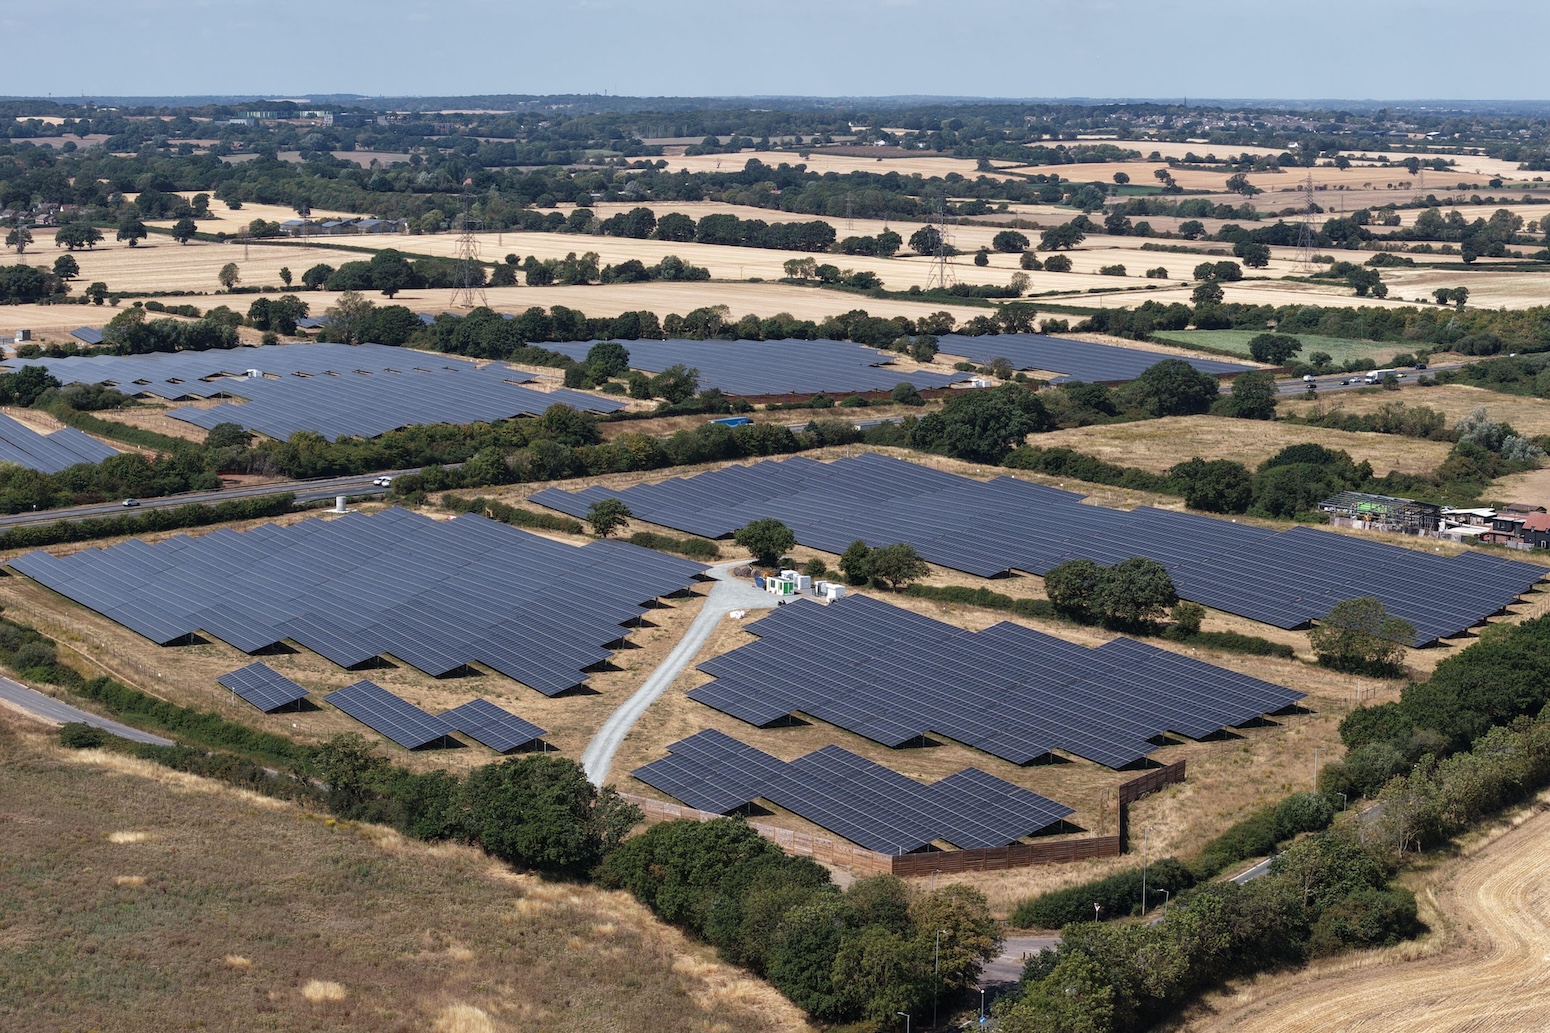
The unprecedented solar output of 2026 was forged over three consecutive months of historic meteorological conditions. Each month set new individual benchmarks for monthly solar generation, reflecting both weather anomalies and expanded generation capacity.
       GREAT BRITAIN SUMMER 2026 SOLAR TIMELINE

  MAY / JUNE                  JULY                      AUGUST
┌──────────────┐          ┌──────────────┐          ┌──────────────┐
│  Hottest     │ ───────► │ Driest July  │ ───────► │ Peak Temp    │
│  June on     │          │ since 1836;  │          │ 38.1°C at    │
│  Record      │          │ 3.3 TWh Solar│          │ Kew Gardens  │
│  (since 1884)│          │ (15% demand) │          │ (13 Aug)     │
└──────────────┘          └──────────────┘          └──────────────┘
       │                          │                         │
       └──────────────────────────┴─────────────────────────┘
                                  ▼
                   Total Summer Output: 8.8 TWh
               (+23% vs 2025 / Double 2021 levels)
May to June 2026: Early Heat and Historical Precedents
The summer’s extraordinary trajectory began in early June, when persistent high-pressure systems established themselves across the British Isles. According to Met Office data, June 2026 was recorded as the warmest June in England since records began in 1884. Wales and Great Britain as a whole logged their second-warmest June on record. High clear-sky solar irradiance allowed rooftop systems and commercial solar farms to ramp up generation early in the season, establishing the first of three back-to-back monthly generation records.
July 2026: Historic Drought and the All-Time Monthly Generation Peak
Conditions intensified through July, which became the driest July for England and Wales since 1836. Extensive regional dry spells were documented across the southern territories:
- Parts of central London recorded zero precipitation throughout the entire month.
- Wisley in Surrey experienced a continuous 62-day dry spell, marking one of the longest droughts in recent regional history.
These cloudless, rain-free conditions propelled solar generation to an all-time monthly high. In July alone, solar systems delivered 3.3 TWh to the grid, satisfying 15% of the nation’s total monthly power consumption. This performance stands as the single highest monthly volume of solar electricity ever recorded in Great Britain.
August 2026: Peak Temperatures and Cumulative Milestones
The heatwave sequence culminated in mid-August. On August 13, temperatures peaked at 38.1°C at Kew Gardens in London, marking the highest temperature of the year. By the end of August, Great Britain had experienced 26 official heatwave days spread across five separate heatwave events between May and August.
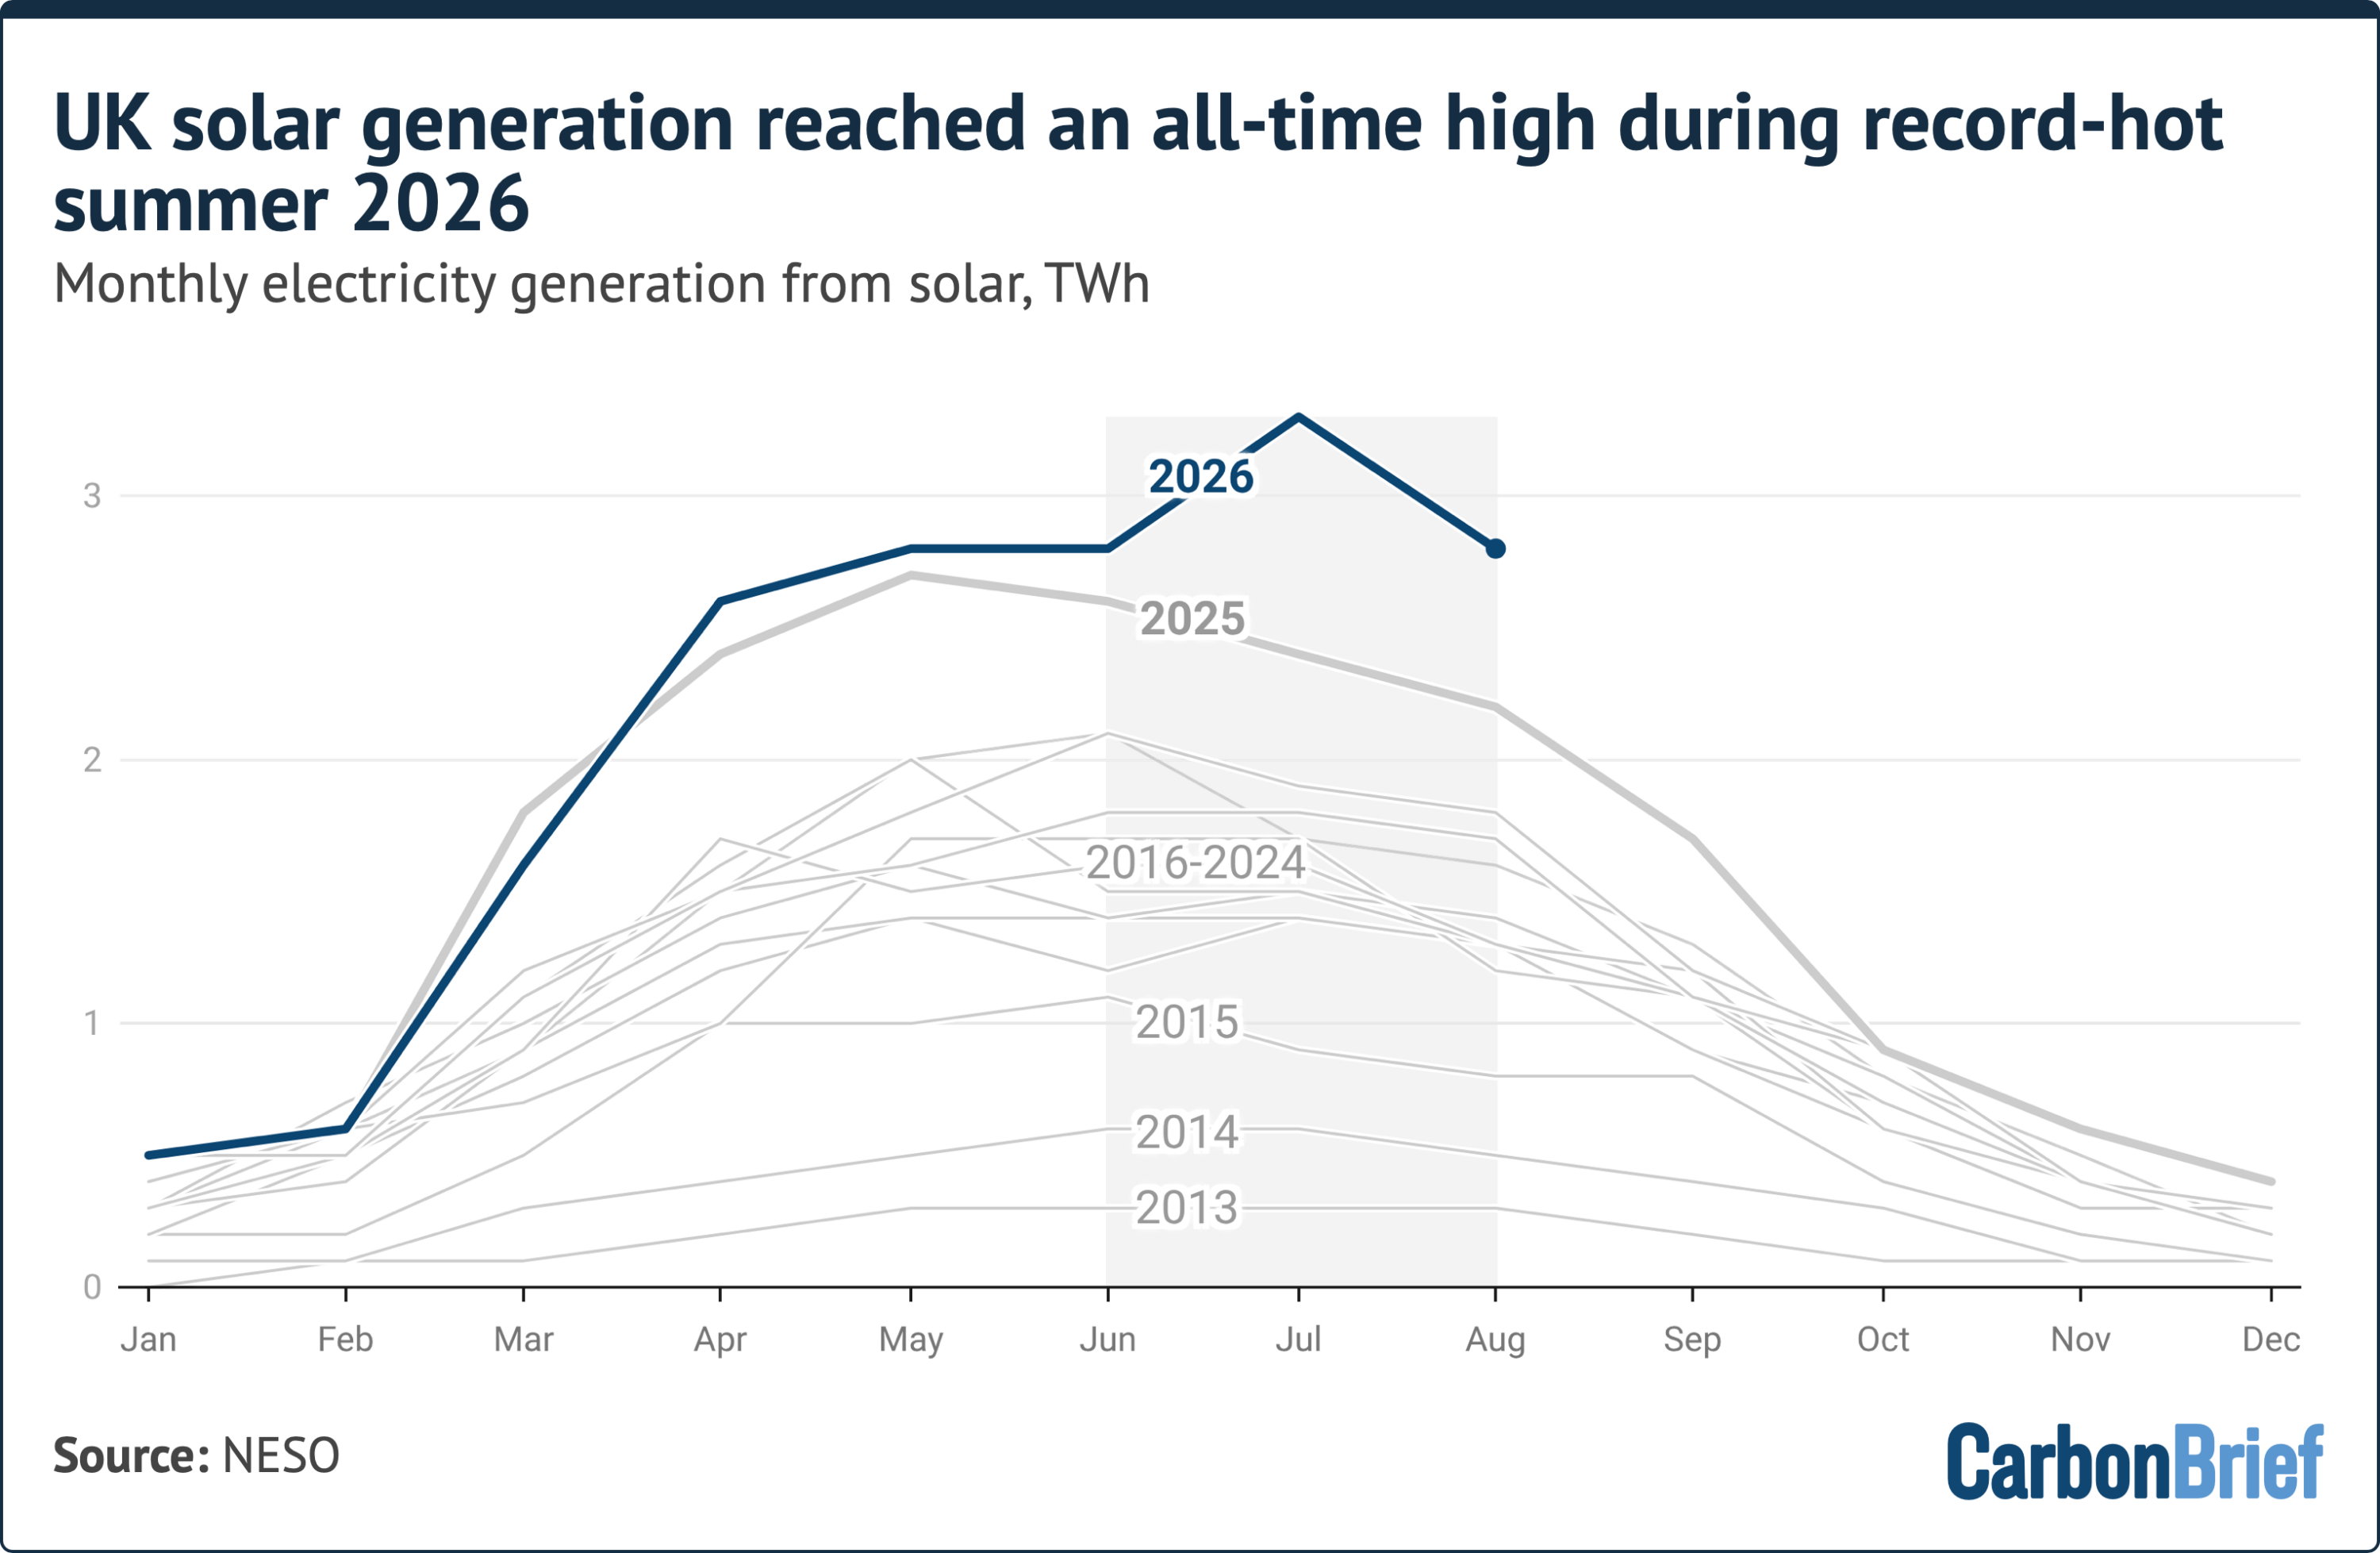
Despite high ambient heat, solar generation remained elevated throughout August, cementing the 8.8 TWh seasonal benchmark. By the close of the month, total cumulative UK solar generation for 2026 reached 17 TWh—a 13% increase over the same year-to-date period in 2025.
Supporting Context & Metrics: Infrastructure, Physics, and Economics
Rapid Infrastructure Expansion and Capacity Dynamics
The record generation achieved in 2026 was made possible by rapid, compound growth in installed photovoltaic capacity over preceding years.
               UK INSTALLED SOLAR CAPACITY GROWTH
 25 GW ─────────────────────────────────────────────────── ~24 GW (Current)
                                                   ┌───────┐
 20 GW ─────────────────────────── 21 GW           │       │
                           ┌───────┐               │       │
 15 GW ─────────────────── │       │               │       │
                           │       │               │       │
 10 GW ─────────────────── │       │               │       │
                           │       │               │       │
  0 GW ────────────────────┴───────┴───────────────┴───────┴
                            Q3 2025                 Late 2026
According to figures tracking the UK grid:
- In the third quarter of 2025, official government statistics recorded UK solar capacity at 21 gigawatts (GW), reflecting an 18% (3 GW) year-on-year increase.
- By late summer 2026, data from the University of Sheffield’s PV_Live platform indicated total installed capacity had climbed to nearly 24 GW.
| Metric | Recorded Value (2026) | Historical Context / Comparison |
|---|---|---|
| Summer Generation (Jun–Aug) | 8.8 TWh | +23% vs. Summer 2025; 2x Summer 2021 |
| July Generation (Peak Month) | 3.3 TWh | Highest single calendar month ever (15% of grid demand) |
| Year-to-Date Output (thru Aug) | 17.0 TWh | +13% higher than same period in 2025 |
| Estimated National Capacity | ~24 GW | Up from 21 GW in Q3 2025 (+18% YoY growth rate) |
| 2026 New Installations | ~172,000 | Total residential footprint now ~1.7 million homes |
| July Installation Pace | >19,800 | Equivalent to one new rooftop system every two minutes |
| Consumer Heatwave Savings | £86.7 million | Direct consumer savings across 26 heatwave days |
A central driver of this capacity growth is the residential sector. Domestic rooftop installations currently account for roughly 29% of total UK solar capacity.
Government data indicates that nearly 172,000 new solar PV systems were fitted across Great Britain in the first eight months of 2026 alone. Installation velocity peaked in July, when over 19,800 rooftop installations were completed—a deployment rate of roughly one new solar array installed every two minutes. Nationwide, approximately 1.7 million households now generate self-produced solar power.
The Photovoltaic Paradox: Heat Degradation vs. Total Irradiance
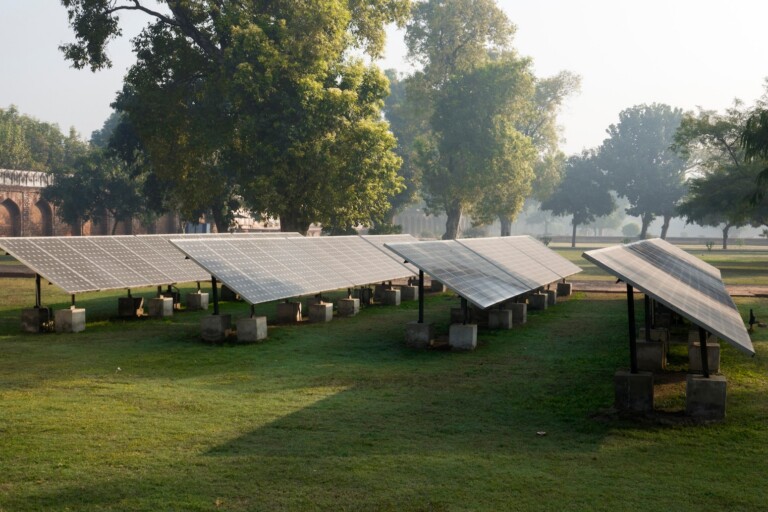
A common misconception regarding solar power is that extreme heat inherently optimizes output. In reality, silicon solar cells operate with maximum thermodynamic efficiency at ambient temperatures around 25°C. Beyond this threshold, panels experience a temporary efficiency drop (typically between 0.3% and 0.5% per degree Celsius of temperature rise above baseline).
   [ Extended Summer Daylight Hours ]  ──┐
                                         ├──► Net Generation Boost (+23%)
   [ High Solar Irradiance (Clear Skies) ] ──┤     (Overcomes Heat Penalty)
                                         │
   [ High Temperature Efficiency Penalty ]─┘
However, during the summer of 2026, the potential drag from high temperatures was heavily outweighed by two factors:
- Daylight Duration: Long summer daylight hours provided an expanded window for power generation.
- Radiation Density: Clear, cloudless skies delivered higher total solar irradiance to panel surfaces.
Interestingly, while summer 2026 broke overall seasonal and monthly volume records, it did not break the record for maximum instantaneous half-hourly output. That peak remains 15.2 megawatts (MW), set during cooler, highly radiant atmospheric conditions on 23 April 2026, when low air temperatures allowed panels to operate at peak thermodynamic efficiency.
Climate Change Attribution and Energy Economics
The climatic background of this generation boom was heavily influenced by broader global climate trends. Met Office attribution studies concluded that the record mean temperatures observed across Great Britain during summer 2026 were made 130 times more likely as a direct result of human-induced climate change. The summer ranked as the sixth sunniest on record nationally (>620 sunshine hours), while England and Wales recorded their second-sunniest summers in history.
From an economic perspective, this solar expansion delivered measurable relief to consumers and energy markets:

- Direct Household Savings: An analysis by Utility Bidder revealed that British households equipped with rooftop solar arrays collectively avoided an estimated £86.7 million in electricity bills during the 26 heatwave days.
- Wholesale Market Stabilization: By supplying substantial zero-marginal-cost power during peak daytime hours, solar generation directly offset expensive natural gas-fired power plants, driving down wholesale power market clearing prices for the wider grid.
Official Statements and Industry Insights
Key stakeholders across the renewable energy sector and climate research organizations highlighted both the tactical success and strategic implications of the summer’s solar performance.
Speaking to Carbon Brief, Chris Hewett, Chief Executive of trade body Solar Energy UK, underscored the dual forces driving the milestone:
"The new record was driven by clear skies and continued growth in deployment. This surge in generation not only kept bills down for people with solar and batteries in their homes, but helped keep overall power prices much lower than they would have been if Britain had been relying on more gas generation during the day."
Industry analysts noted that the rapid deployment of residential solar systems combined with home battery storage is fundamentally altering the UK’s daytime load profile. During midday peak periods in June and July, decentralized rooftop solar significantly reduced net demand on the transmission network, allowing system operators to turn off carbon-intensive peaking units.
However, grid experts caution that realizing the full value of this expanding generation capacity will require continued investment in infrastructure to manage localized distribution limits and smooth out supply volatility.
Future Outlook and Strategic Imperatives
The record-setting summer of 2026 demonstrates both the progress and the emerging challenges of Great Britain’s energy transition. As installed solar capacity trends toward national targets, energy policy and grid management must address several key operational imperatives.
                  FUTURE GRID INTEGRATION ARCHITECTURE

 ┌──────────────────────┐     ┌──────────────────────┐     ┌──────────────────────┐
 │ Long-Duration Energy │     │ Distribution Grid    │     │ Dynamic Market       │
 │ Storage (LDES)       │ ──► │ Upgrades             │ ──► │ Reform               │
 │ Pumped hydro, high-  │     │ Reinforcing regional │     │ Real-time pricing to │
 │ capacity batteries   │     │ substations          │     │ incentivize storage  │
 └──────────────────────┘     └──────────────────────┘     └──────────────────────┘
1. Scaling Long-Duration Energy Storage (LDES)
With daytime solar generation reaching levels capable of meeting 15% or more of national demand, energy storage is vital to capture surplus generation during midday peaks for use during evening demand spikes. Expanding utility-scale battery energy storage systems (BESS) and pumped hydro storage remains essential to prevent power curtailment during periods of high irradiance.
2. Modernizing Distribution Networks
The addition of nearly 20,000 new rooftop systems per month is altering the flow of power across regional distribution networks. Network operators face growing pressure to reinforce local substations, streamline grid interconnection processes, and deploy smart transformer technologies to manage bidirectional power flows from residential generators.
3. Market Design and Gas Displacement
As solar generation displaces thermal gas plants during the summer, market regulators must continue refining dynamic energy pricing structures. Tariff models that reward flexible consumption, home battery dispatch, and real-time grid balancing will be key to optimizing renewable output as Great Britain advances toward its net-zero energy goals.
Note: Data cited in this analysis strictly references the electricity grid of Great Britain (England, Scotland, and Wales). Northern Ireland operates as part of the separate, integrated Single Electricity Market (SEM) of the island of Ireland.