Executive Overview
For decades, the conversation surrounding the urban "heat island" effect has focused overwhelmingly on major metropolitan sprawls. Cities like New York, Chicago, and Phoenix have long commanded the attention of climate scientists, urban planners, and public health officials as they grapple with how impermeable asphalt, concrete canyons, and sparse tree canopies can elevate neighborhood temperatures by upwards of 7 degrees Fahrenheit compared to surrounding rural areas. But as global temperatures shatter historical records year after year, this phenomenon is no longer confined to the asphalt jungles of America’s megacities.
Across the Intermountain West, historical climate baselines are unraveling. In western Montana, Missoula County is experiencing longer, drier summers, an increasing frequency of days topping 90 degrees Fahrenheit, and dramatic overnight warming. Because the region was historically engineered for cool, brisk climates, its built environment—including residential housing stock and public infrastructure—lacks the adaptive capacity seen in historically scorching regions like the American Southwest. Most notably, Montana maintains one of the lowest rates of residential air conditioning in the United States, leaving local populations acutely vulnerable when extreme heat waves strike.
To confront this unfolding public health hazard head-on, a coalition of local governments, nonprofits, and community volunteers joined forces to launch a groundbreaking heat-mapping initiative. Funded initially through federal climate programs and executed during the scorching summer months, the project yielded the first-of-its-kind high-resolution heat map for Missoula County, filling a critical data gap for the northern Rockies.
Yet, this triumph of grassroots science and civic engagement unfolded against a turbulent political backdrop. Shortly after securing grants through federal climate legislation, local organizers faced the sudden termination of their funding following a directive by the Trump administration in May 2025. Despite the abrupt revocation of federal dollars, Missoula’s leaders and community partners forged ahead, relying on pro-bono technical assistance and localized resource-pooling to complete the map. Today, this data is not merely an academic exercise; it serves as a vital blueprint guiding urban forestry efforts, shaping industrial zoning discussions, and underpinning the "Stay Cool Missoula" campaign—a localized resilience initiative designed to save lives in a rapidly warming world.
Detailed Chronology: From Concept to Community Resilience
The journey to map Missoula County’s microclimates and confront its rising temperatures is a testament to the agility of local climate governance. The initiative’s timeline maps out how a community-driven vision overcame logistical hurdles and sudden political disruption to deliver a critical public resource.
2022–2024: Laying the Groundwork and Securing Federal Support
The initiative’s roots trace back to growing community concern over shifting weather patterns in western Montana. Recognizing that summers were becoming persistently hotter and drier, local stakeholders—spearheaded by the nonprofit organization Climate Smart Missoula alongside city and county agencies—began laying the groundwork for a systematic study of local heat distribution.
In 2024, these efforts received a major boost when the partnership successfully secured federal funding. The grant was awarded through the National Oceanic and Atmospheric Administration’s (NOAA) Center for Collaborative Heat Monitoring Program, financed via the Inflation Reduction Act of 2022. Missoula was selected as one of 11 communities nationwide—alongside cities like New Orleans, Memphis, Buffalo, and Moab—to participate in a synchronized federal effort to map urban and regional heat islands.
Summer 2024: On-the-Ground Data Collection
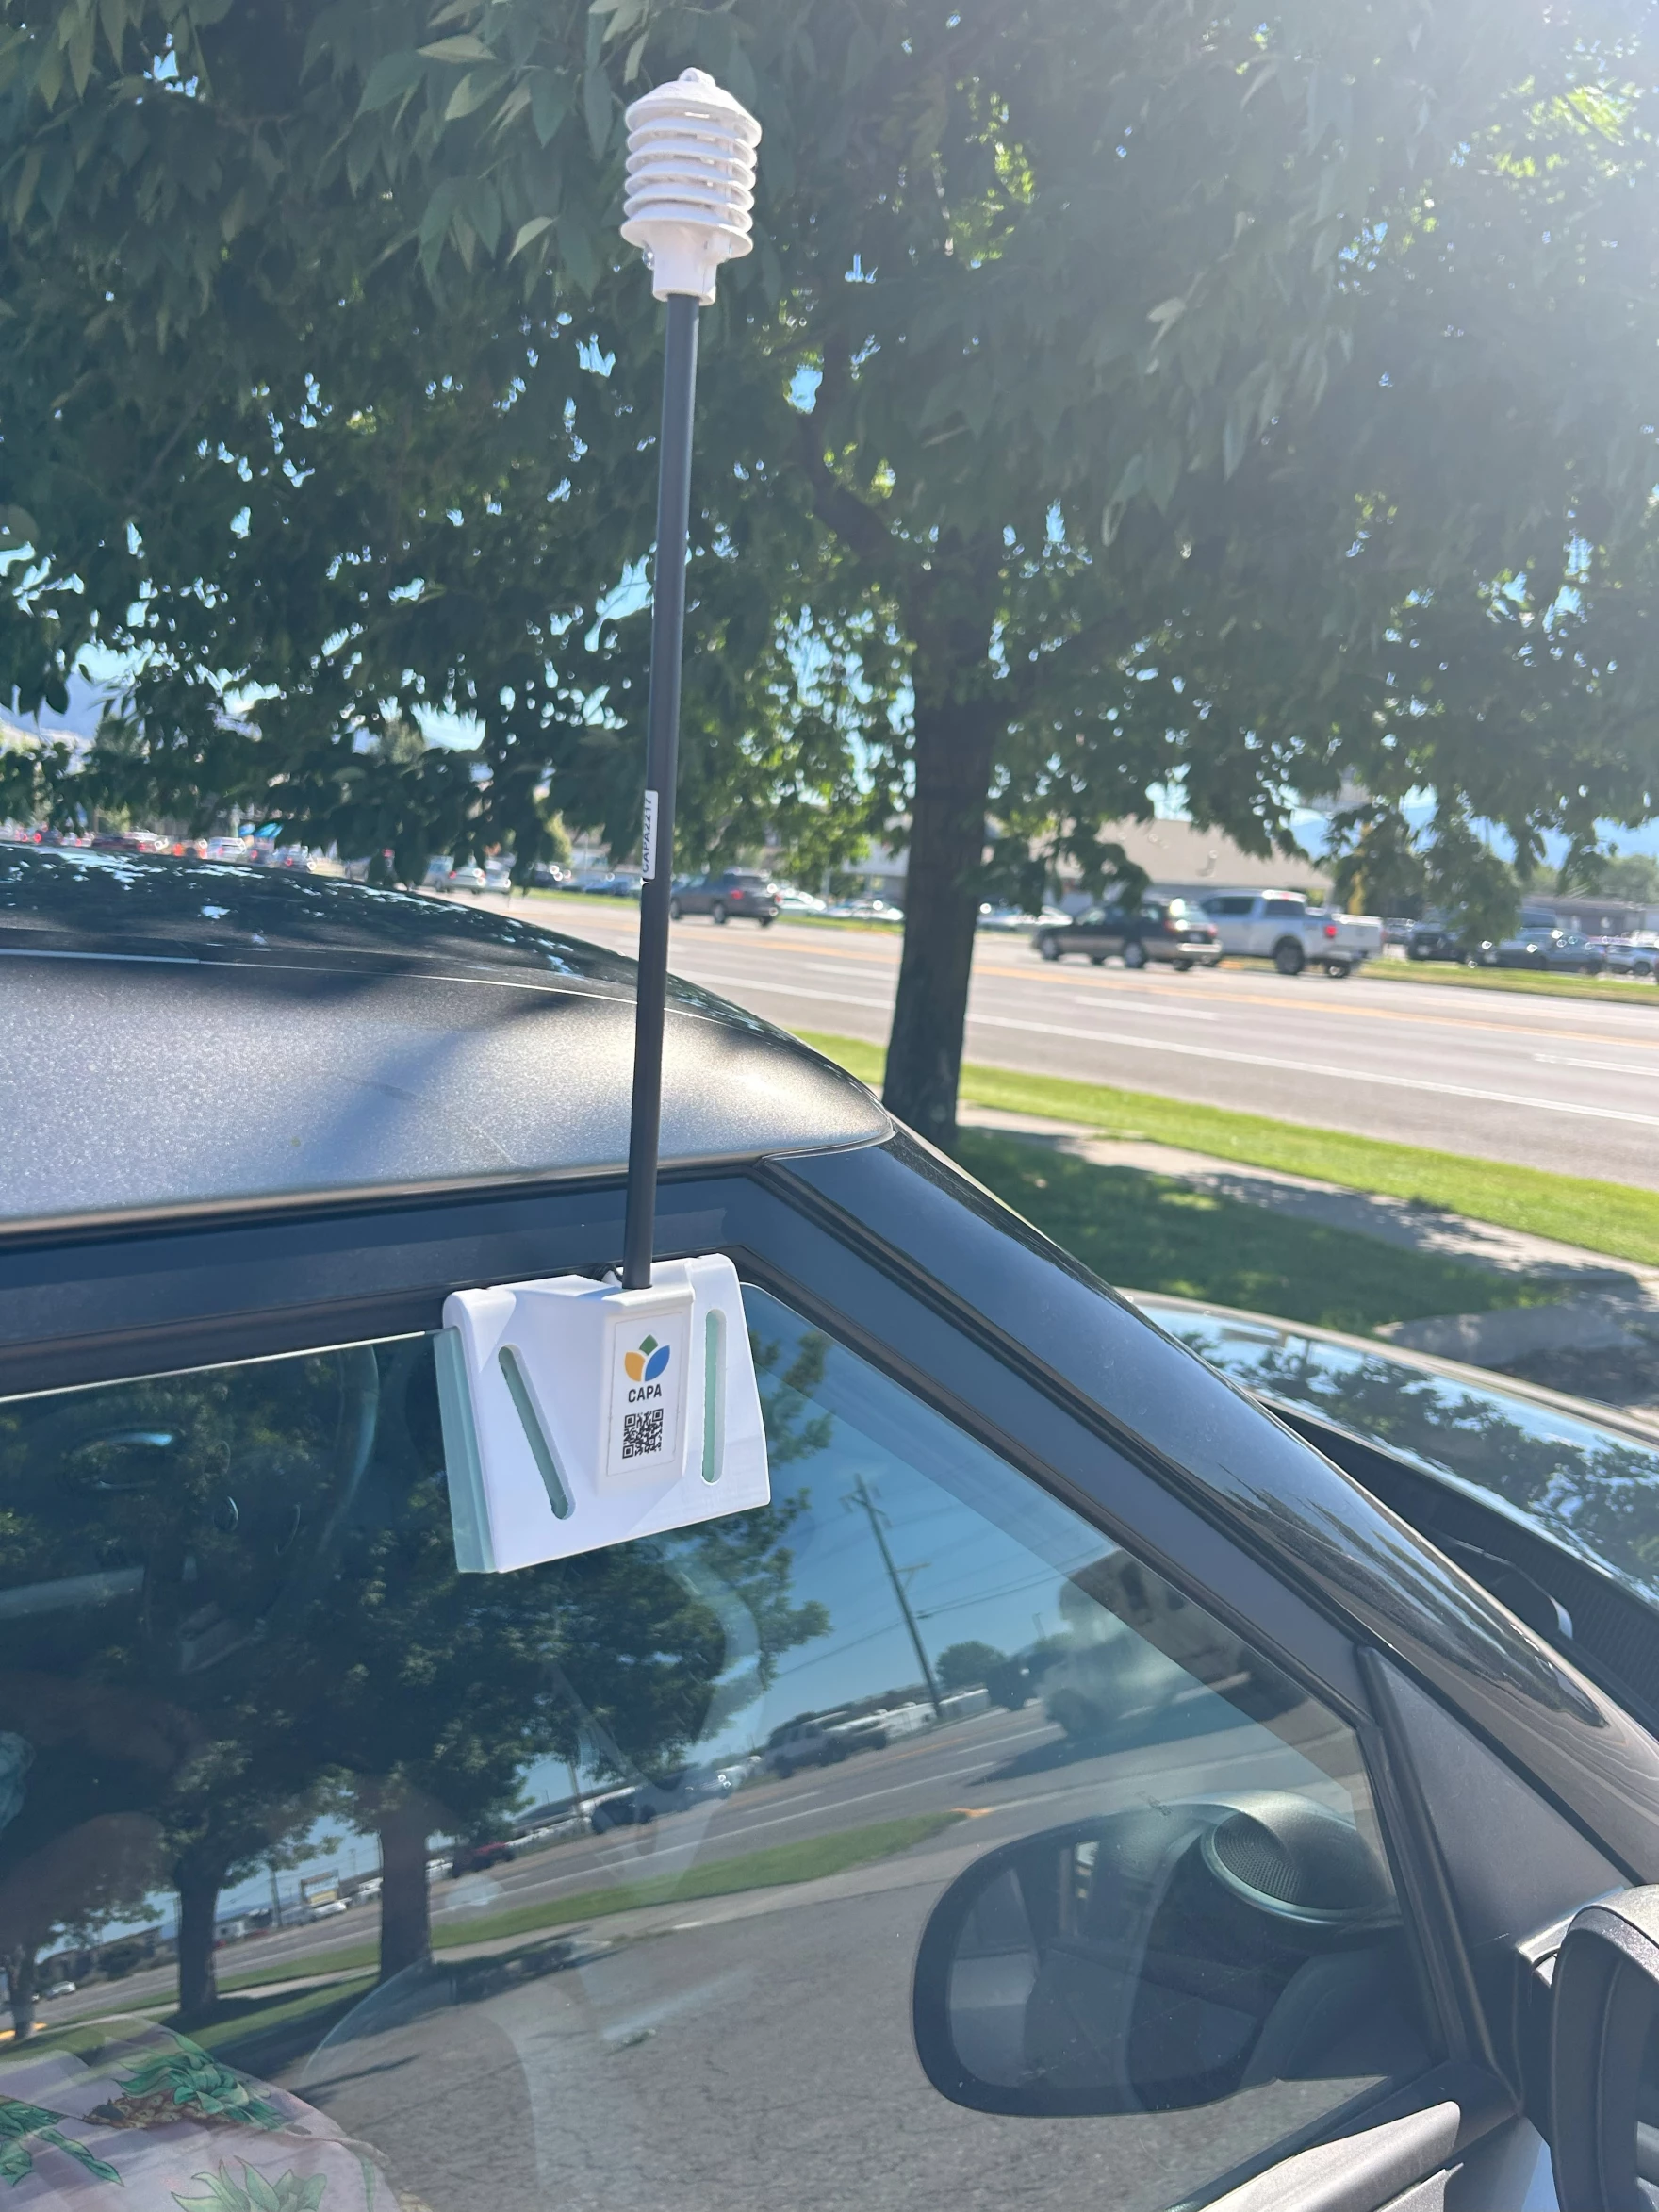
With financial backing secured, the operational phase of the project kicked into high gear. During the peak of the summer heat, teams of dedicated local volunteers took to the roads. Armed with specialized temperature and humidity sensors attached to the windows of their personal vehicles, volunteers drove designated countywide routes—known as transects—at precisely timed intervals throughout the day. These sensors recorded second-by-second microclimate data, capturing the nuanced interplay of shade, vegetation, elevation, and built infrastructure across diverse neighborhoods.
Late 2024 to Early 2025: Data Processing and Map Launch
Following the data collection blitz, raw sensor logs were transmitted to CAPA Strategies, a climate adaptation consulting firm specializing in urban heat island mapping. Analysts at CAPA processed the immense volume of environmental data, translating second-by-second readings into a comprehensive, publicly accessible digital heat map hosted on ArcGIS. Released for public use, this map became the first of its kind in Montana and the broader northern Rockies region, establishing a foundational baseline for communities across Wyoming, North Dakota, and South Dakota, which lack comparable regional heat models.

May 2025: Federal Funding Termination and Community Pivoting
The project’s momentum faced a severe roadblock in May 2025. In alignment with shifting federal priorities under the Trump administration, the remaining allocations from the NOAA collaborative heat monitoring grant were officially terminated. By the time the funding was rescinded, approximately half of the grant money had already been expended or earmarked for immediate project expenses.
Faced with a sudden budgetary shortfall, the core partners—Climate Smart Missoula, the City of Missoula, and Missoula County—did not abandon the initiative. Instead, they leaned heavily on community resilience. Recognizing the existential necessity of the work, CAPA Strategies and other national collaborators stepped in to provide their analytical services entirely pro bono. This extraordinary display of cross-sector solidarity allowed the project to reach completion despite the federal pullback.
Present Day and Beyond: Operationalizing the Data
Today, the Missoula heat map is actively integrated into municipal and county planning. Organizers are utilizing the granular temperature data to direct tree-planting initiatives in under-resourced neighborhoods, inform zoning and environmental review processes, and power the "Stay Cool Missoula" public resilience campaign. Rather than stalling out due to federal cuts, local leadership has transformed the adversity into a model for decentralized, community-led climate adaptation.
Supporting Context & Metrics: Unpacking the Microclimate Data
To fully grasp the significance of Missoula’s heat-mapping project, one must examine the underlying climatological shifts and the stark disparities revealed by the data. The metrics paint a vivid picture of a region transitioning from a historically mild climate into a high-risk thermal environment.
Shifting Baselines and Long-Term Projections
Historically, Missoula County was characterized by warm, dry summers where daytime temperatures hovered comfortably in the 80s, occasionally breaching the 90-degree mark before dropping sharply after sunset. This reliable nocturnal cooling provided a crucial physiological relief valve for residents.
In recent years, however, this pattern has broken down. The region is experiencing an increasing accumulation of days exceeding 90 degrees Fahrenheit, accompanied by stifling overnight minimum temperatures that fail to drop off sufficiently. According to regional climate assessments, including the Climate Ready Missoula plan, the county’s average annual temperature is projected to increase by a staggering 4 to 5 degrees Fahrenheit by the year 2050.
The Infrastructure Gap: Air Conditioning Vulnerability
Perhaps the most critical vulnerability facing Missoula—and northern climates more broadly—is the lack of adaptive housing infrastructure. Nationally, Montana consistently ranks among the states with the lowest rates of residential air conditioning. While residents in traditionally hot states like Arizona or Texas live in homes engineered with robust central cooling, insulation, and reflective roofing, Montanans have historically had little need for mechanical cooling systems.
When multi-day heat waves settle over the valleys, homes quickly trap daytime heat. Without widespread air conditioning, indoor environments can become thermal traps, posing severe health risks—particularly for vulnerable demographics such as the elderly, outdoor laborers, and low-income residents.
Quantifying the Disparity: 20 Degrees of Separation
The most striking revelation of the CAPA Strategies-processed heat map is the sheer magnitude of temperature variation across Missoula County. Depending on the density of the tree canopy, surface materials, and geographic features, ambient temperatures across the county can vary by nearly 20 degrees Fahrenheit during peak heat events.
The data reveals clear thermal divides that mirror those found in larger metropolitan centers across the United States:
- Cool Havens: Wealthier or historically established residential areas—such as the University District and the Rattlesnake neighborhood—feature robust canopies of large, mature trees. These neighborhoods consistently registered significantly lower temperatures, benefiting from natural evapotranspiration and deep shade.
- Urban Heat Islands: As anticipated by city planners, densely built environments such as downtown Missoula and commercial zones surrounding the Southgate Mall acted as pronounced heat islands, driven by high concentrations of asphalt, concrete, and dark roofing materials.
- The Rural and Open-Land Paradox: While urban centers behaved as expected, the mapping revealed surprising thermal anomalies in rural and undeveloped spaces. Dry, brown open lands—such as vacant lots within town limits—frequently acted as intense heat islands. These unmanaged spaces are often overrun by invasive plant species that thrive in hot, dry conditions. Lacking irrigation and natural shade, these weed-choked lots absorb and radiate intense heat.
- Canopy Trapping in Dense Forests: In a counterintuitive twist, heavily forested rural areas like Seeley Lake and Evaro (located north of the city center) were found to hold onto heat overnight. Dense tree canopies acted as thermal blankets, trapping heat absorbed during the day and resulting in some of the county’s highest recorded morning temperatures.
Public Health Impacts: The 911 Correlation
The urgency of mapping and mitigating extreme heat is underscored by empirical public health data. Federal agencies, including the National Weather Service, consistently classify extreme heat as the leading cause of weather-related mortality in the United States—outpacing hurricanes, floods, and tornadoes combined.
This national trend is directly mirrored at the local level. Landmark research published in 2024 by the University of Montana investigated the public health implications of extreme weather events in the region. The study uncovered a chilling linear correlation: for every 1-degree Celsius increase in temperature, emergency 911 calls increased correspondingly by 1 percent. A significant portion of these emergency dispatches originated from rural and suburban pockets housing older, retired populations who are physiologically more susceptible to heat stress and dehydration.
Official Statements and Perspectives
Local leaders, researchers, and project coordinators have been vocal about both the scientific implications of the mapping project and the resilience required to sustain it in the face of federal policy shifts.
Susan Teitelman of Climate Smart Missoula emphasized the universal nature of the environmental justice issues uncovered by the data:
"What we’re seeing in Missoula mimics larger cities like New York and Boston. You see the same thing happening everywhere: Poorer, hotter neighborhoods have fewer trees; wealthier, greener neighborhoods have lower temperatures. Extreme heat is dangerous. It is impacting Missoula and Montana. It’s impacting northern climates, and it’s an issue of equity."
Teitelman also highlighted the silver lining of national professional solidarity following the revocation of federal grant funds:
"They’ve done all this pro bono work for our community and other communities. That’s just been a boon for us and communities across the U.S. who got to do this heat mapping in light of federal funding being revoked."
Alli Kane, the county’s climate action program coordinator, discussed the nuanced realities of local geography revealed by the sensors:
"Places where we anticipated we would have heat islands were downtown Missoula, around Southgate Mall, those areas that are more urban and more built up. But you’ll see, especially in the morning map, [places like Seeley Lake and Evaro] are retaining heat from the day before because of that really dense canopy, and so that effect is resulting in some of our highest-recorded morning temperatures."
Addressing the abrupt halt of federal climate grants under the new administration, Kane expressed unwavering resolve regarding local autonomy:
"There has been so much disruption overturned because of what’s happening at the federal level. But I do think that our local governments and our local organizations are pretty uniquely positioned to continue to work on this, and so we’re putting everything we can behind it."
Future Outlook: Building Climate Resilience from the Ground Up
The completion of the Missoula County heat map marks not an endpoint, but a beginning. Armed with empirical data that pinpoints exact thermal vulnerabilities down to the neighborhood block, local stakeholders are deploying targeted strategies to safeguard public health and reshape regional planning.
Targeted Urban Forestry and the "Stay Cool Missoula" Campaign
Climate Smart Missoula, alongside municipal partners, has leveraged the heat map insights to direct the deployment of the Stay Cool Missoula campaign. Recognizing that tree equity is directly tied to survival during heat waves, Susan Teitelman and her team are aggressively directing urban forestry initiatives—including strategic tree-planting campaigns—toward lower-income neighborhoods where historical canopy cover is sparse or entirely absent. By increasing shade where it is needed most, the city aims to shave degrees off ambient neighborhood temperatures and shield vulnerable residents from heat-related illness.
Informing Zoning, Development, and Industrial Policy
The utility of the heat map extends far beyond urban forestry. Municipal and county leaders are integrating the dataset into regulatory frameworks and land-use decisions.
A prime example involves recent discussions surrounding a proposed industrial data center in Bonner, situated along the scenic banks of the Blackfoot River. Although the property manager ultimately canceled the project, the controversy underscored the environmental friction of industrial development in river valleys. Alli Kane noted that having precise data illustrating how land-clearing and industrial surface modifications drastically elevate local temperatures will empower county commissioners to draft smarter, climate-conscious zoning regulations for future commercial proposals.
A Decentralized Blueprint for Rural America
Missoula’s experience serves as both a cautionary tale and an inspiring model for rural and mid-sized communities across the United States. As federal funding for climate adaptation initiatives remains politically vulnerable, the capacity of local governments, grassroots nonprofits, and pro-bono technical partners to collaborate will dictate the resilience of America’s interior.
By proving that rigorous scientific data collection can be sustained through local grit and shared expertise, Missoula County has established a forward-looking playbook. In a warming world where extreme heat respects neither municipal boundaries nor political changes in Washington, local action is proving to be the ultimate frontline defense.